3011
Microscopic Fractional Anisotropy Estimation of Spinal Cord in Multiple Sclerosis and Neuromyelitis Optica Spectrum Disorder
Masaaki Hori1,2, Kouhei Kamiya1,2,3, Akifumi Hagiwara2, Kazumasa Yokoyama4, Issei Fukunaga5, Sano Katsuhiro2, Koji Kamagata2, Murata Katsutoshi6, Shohei Fujita2, Christina Andica2, Akihiko Wada2, Julien Cohen-Adad7, and Shigeki Aoki2
1Radiology, Toho University Omori Medical Center, Tokyo, Japan, 2Radiology, Faculty of Medicine, Juntendo University, Tokyo, Japan, 3Radiology, Tokyo University, Tokyo, Japan, 4Neurology, Faculty of Medicine, Juntendo University, Tokyo, Japan, 5Radiological Technology,, Faculty of Health Science, Juntendo University, Tokyo, Japan, 6Siemens Japan K.K., Tokyo, Japan, 7NeuroPoly Lab, Polytechnique Montreal, Montreal, QC, Canada
1Radiology, Toho University Omori Medical Center, Tokyo, Japan, 2Radiology, Faculty of Medicine, Juntendo University, Tokyo, Japan, 3Radiology, Tokyo University, Tokyo, Japan, 4Neurology, Faculty of Medicine, Juntendo University, Tokyo, Japan, 5Radiological Technology,, Faculty of Health Science, Juntendo University, Tokyo, Japan, 6Siemens Japan K.K., Tokyo, Japan, 7NeuroPoly Lab, Polytechnique Montreal, Montreal, QC, Canada
Synopsis
We investigated the microstructural changes in the spinal cords of patients with multiple sclerosis (MS) and neuromyelitis optica spectrum disorder (NMOSD) using micro fractional anisotropy (μFA) derived from both double diffusion encoding (DDE) and 2-shell single diffusion encoding data with spherical mean techniques (SMT). There was no significant difference in μFA between MS and NMO. SMTs were not correlated with μFA derived from DDE. Therefore, SMT may be better treated as a separate diffusion MRI metric from μFA to investigate the microstructural alterations of spinal cord in patients with MS and NMOSD in vivo.
Introduction:
Multiple sclerosis (MS) and Neuromyelitis Optica Spectrum Disorder (NMOSD) are diseases of the immune system. In the past, a fraction of patients with NMOSD were misdiagnosed and treated as a form of MS because of the limitation of conventional MR imaging for demonstration of structural changes and lesions1, and the method for evaluating so-called normal-appearing nervous tissue remains to be established for both diseases. Microscopic fractional anisotropy (μFA) from double diffusion encoding (DDE) technique recently showed promising results and might provide more pathologically specific, clinically meaningful information of microstructural changes compared with FA2, 3. There are also other methods to evaluate μFA from diffusion MRI (dMRI) data acquired with conventional single diffusion encoding(SDE), using both modeling and a set of constraints4. The purpose of this preliminary study is to investigate μFA using these methods to distinguish microstructural changes in the spinal cord of patients with MS and NMOSD in vivo, and investigate the association of μFA calculated with different methods.Methods:
We prospectively enrolled 8 MS patients (age 51±11 years, 5 females; 7 RRMS, 1 SPMS, median EDSS score 1.25, disease duration range 9-30y) and 6 NMOSD patients (age 62±16 years, all females). After T2-, T2*- and T1-weighted imaging, 2-shell SDE imaging data using regional excitation technique (ZoomIt) were acquired with a Siemens Prisma 3T scanner with a body coil excitation and 64-ch head/neck coil for reception. Imaging parameters for 2-shell SDE dMRI were as follows: repetition time (TR)/echo time: 2200/76 (ms/ms); section thickness: 5 mm; 39 slices; in-plane pixel size: 0.9x0.9 mm; SMS factor: 2; imaging time: approximately 12 min; 2 b values (1000 and 2000 s/mm2) with two b=0 images and diffusion encoding in 30 direction for every b value. DDE data were acquired with the imaging parameters as follows: TR/echo time, 5200/84 (ms/ms); number of signals acquired, one; section thickness, 5 mm; 32 slices; in-plane pixel size, 1.23 x 1.23 mm; SMS factor, 2; imaging time, approximately 4 min; 2 b-values (500 and 500 s/mm2 for the first and second trains of MPG) with one b=0 image and diffusion encoding in 36 directions, based on a modified Jespersen’s protocol2. All diffusion MRI data were transferred to an offline workstation, denoised data5 and processed using in-house programs developed in Matlab (R2019a, Math Works, Inc, Natick, MA) to derive parametric maps of μFA using DDE data. Other 2 types of μFA maps, termed spherical mean technique (SMT) 1 6 and SMT2 7 derived from 2-shell SDE data were also obtained4. After that, semi-automated analysis was performed using the Spinal Cord Toolbox8 for cord and lesion segmentation9, motion correction, normal-appearing white matter (NAWM) and gray matter (NAGM) maps generation, registration to white matter and gray matter atlas, and extraction of metrics (Figure 1). Quantitative metrics in the NAWM and NAGM at C2, C3, C4 and C5 were compared between MS and NMOSD. Statistical evaluations were performed by using Microsoft Excel 2019 and SPSS (SPSS Inc. version 27). P value less than 0.05 was considered statistically significant.Results:
All metrics values of NAWM and NAGM of spinal cords at each spinal level in patients with MS and NMOSD are summarized in Figure 2. There were no significant differences in μFA , SMT1, and SMT2 between MS and NMO. SMT1 and SMT2 were not correlated with μFA (Figure 3A). There was a strong correlation between SMT1 and SMT2(r=0.971, P<0.01, Spearman's rho, Figure 3 B).Discussion:
Our results show that there was no significant difference in μFA, SMT1 and SMT2 in the spinal cords between MS and NMOSD, although all the values seemed to be lower than normal spinal cord white matter metrics of healthy volunteers (values not shown here). We also found that μFA calculated with DDE data was not correlated with SMT1 and SMT2. Therefore,, SMT may be better treated as a separate dMRI metric from μFA in the assessment of microstructural changes in the spinal cord of MS patients. Limitations of this study are, small sample size of patients and sex/age un-matched population, different TE, diffusion time and in-plane spatial resolution between 2-shell SDE and DDE. Further studies with larger patients and the investigation of imaging, pathological, and clinical correlation are needed to establish the usefulness of μFA and SMTs in the evaluation of the spinal cords in patients with MS and NMOSD.Acknowledgements
This work was supported by JSPS KAKENHI Grant Number 19K08161, the Canada Research Chair in Quantitative Magnetic Resonance Imaging [950-230815], the Canadian Institute of Health Research [CIHR FDN-143263], the Canada Foundation for Innovation [32454, 34824], the Fonds de Recherche du Québec - Santé [28826], the Fonds de Recherche du Québec - Nature et Technologies [2015-PR-182754], the Natural Sciences and Engineering Research Council of Canada [435897-2013], the Canada First Research Excellence Fund (IVADO and TransMedTech) and the Quebec BioImaging Network [5886].References
1. Miki Y, et al.Relapsing-remitting multiple sclerosis: longitudinal analysis of MR images--lack of correlation between changes in T2 lesion volume and clinical findings. Radiology. 1999;213(2):395-9.2. Jespersen, Sune Nørhøj, et al. "Orientationally invariant metrics of apparent compartment eccentricity from double pulsed field gradient diffusion experiments." NMR in Biomedicine 26.12 (2013): 1647-1662.3.
3. Yang, Grant, et al. "Double diffusion encoding MRI for the clinic." Magnetic resonance in medicine 80.2 (2018): 507-520.
4. Henriques RN, Jespersen SN, Shemesh N. Microscopic anisotropy misestimation in spherical-mean single diffusion encoding MRI. Magn Reson Med. 2019 ;81(5):3245-3261.
5. https://dipy.org/documentation/1.4.1./examples_built/denoise_patch2self/#example-denoise-patch2self
6. https://github.com/ekaden/smt
7. https://dipy.org/documentation/1.4.1./examples_built/reconst_msdki/#id6
8. De Leener B,et al. SCT: Spinal Cord Toolbox, an open-source software for processing spinal cord MRI data. Neuroimage. 2017 Jan 15;145(Pt A):24-43.
9. Gros C, et al. Automatic segmentation of the spinal cord and intramedullary multiple sclerosis lesions with convolutional neural networks. Neuroimage. 2019;184:901-915.
Figures
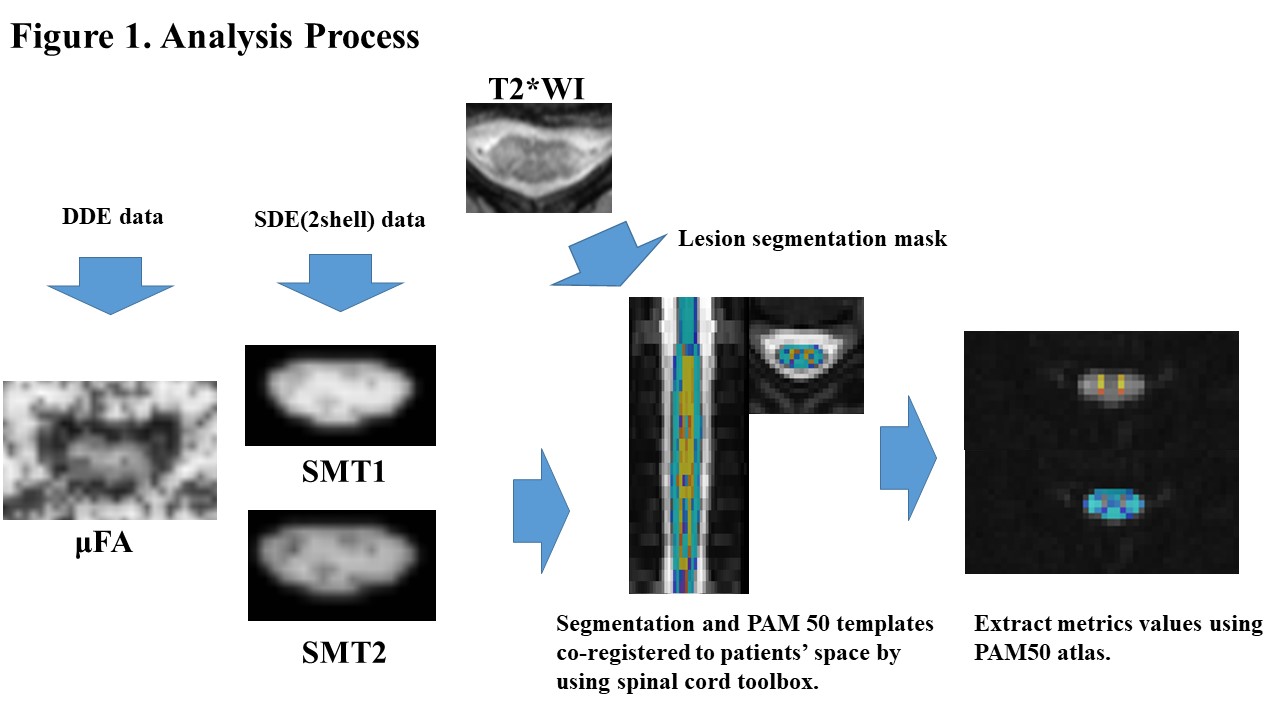
Figure
1. Representative metric maps of a case with multiple sclerosis (44 year old
woman) and analysis process.
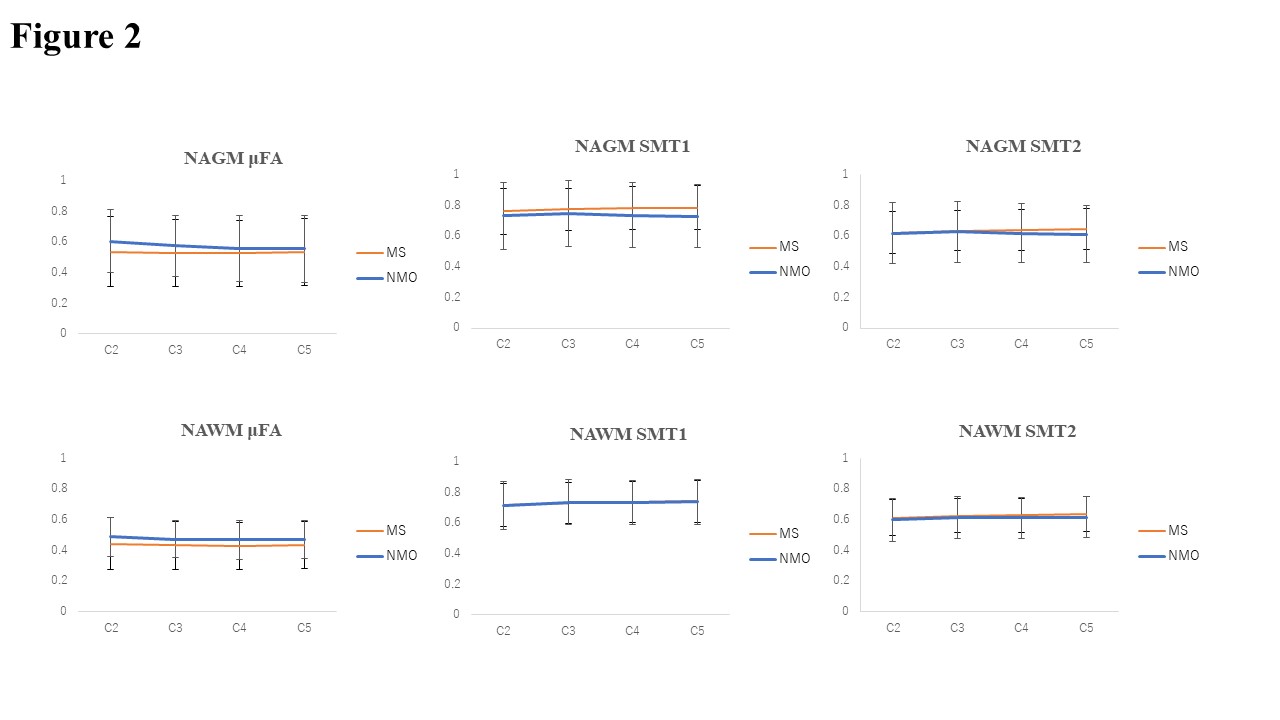
Figure 2. The
results of all metrics values of white matter of spinal cords at each spinal
level in patients with MS and NMOSD.
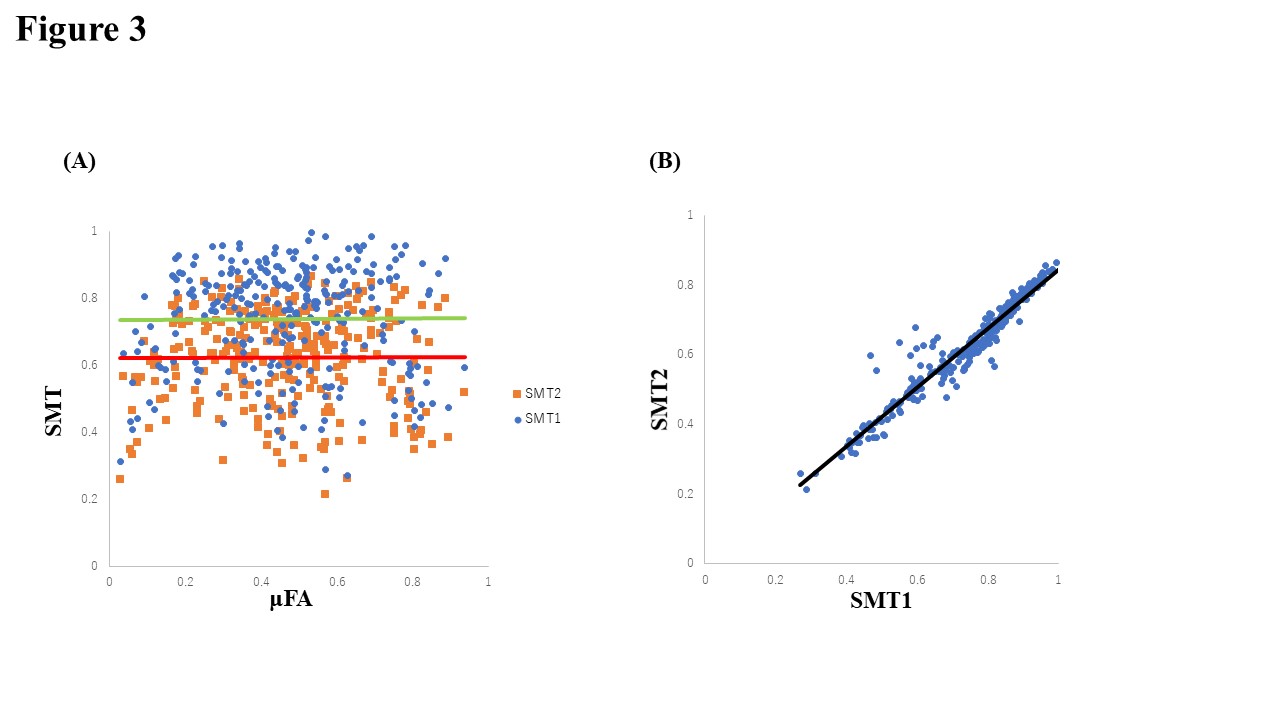
Figure 3.
Correlation between μFA from DDE and 2-shell SDE (SMT1 and SMT2) in patients
with MS and NMO. A, The red line and green line indicate the regression lines
of μFA and SMT1, and μFA and SMT2, respectively. B, The black line indicates
the regression line of SMT1 and SMT2.
DOI: https://doi.org/10.58530/2022/3011