3007
Clinical Value of Synthetic MRI and DWI in the diagnosis of Hippocampal Sclerosis in medial temporal lobe Epilepsy1General Hospital of Ningxia Medical University, Ningxia yinchuan, China, 2GE Healthcare, Beijing, China
Synopsis
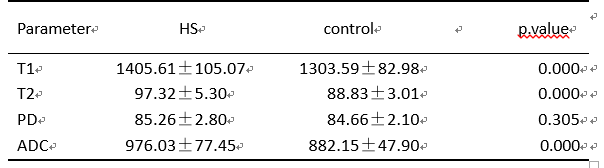
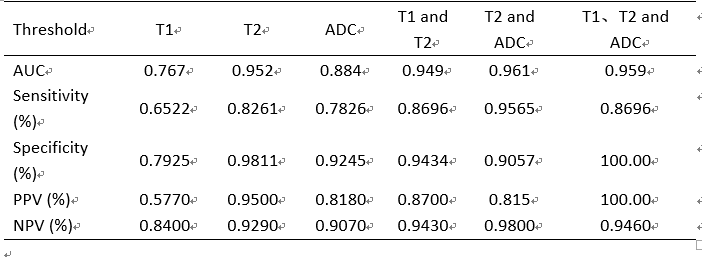
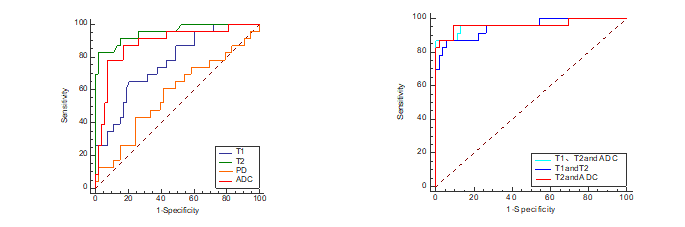
The purpose of this study is to explore the value of different quantitative parameters derived from Synthetic MRI and combined with DWI in the diagnosis of hippocampal sclerosis. It was concluded that the values of T1, T2 and ADC in the hippocampal sclerosis were significantly higher than those in the normal control group .In addition, the AUC of the combined model of T2 and ADC was 0.96, which was higher than that of ADC (AUC 0.884) or T2 alone (AUC 0.952). Its sensitivity, specificity, positive predictive value and negative predictive value were 0.95,0.91,0.81,0.98 respectively.
Introduction
Medial temporal lobe epilepsy (MTLE) is the most common type of refractory temporal lobe epilepsy, and its most common cause is hippocampal sclerosis[1], which is characterized by massive loss of neurons in the hippocampus and reactive proliferation of glial cells[2]. Surgical resection of epileptogenic foci is an effective method to cure medial temporal lobe epilepsy[3], but how to effectively locate the side and focus before operation is a big challenge. In clinic, the diagnosis of MTLE and the evaluation of the efficacy of drug treatment mainly rely on clinical symptoms and EEG[4]. Quantitative MRI and DWI have been widely used in the localization of hippocampal sclerosis[5-7]. In recent years, with the emerging novel synthetic MRI technology (MAGiC), which is based on the multi-delay saturated multi-echo (multiple-delaymultiple-echo,MDME) fast spin echo pulse sequence, absolute quantification of T1, T2, and PD maps can be generated simultaneously in a single scan. Contrast-weighted images can then be reconstructed based on the measurement of tissue physical properties with this technique. The purpose of this study is to explore the value of different quantitative parameters derived from Synthetic MRI in the diagnosis of hippocampal sclerosis and to further evaluate the diagnostic efficacy of synthetic MRI parameters combined with diffusion-weighted imaging in epileptic foci of hippocampal sclerosis.Material and Methods
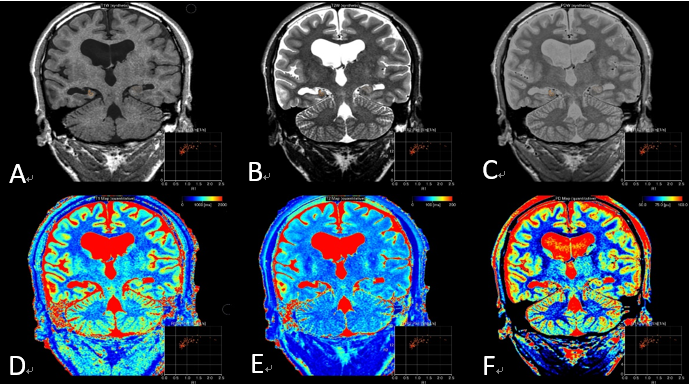
Our Institutional Review Board approved the protocol and written informed consent was obtained from each subject. From October 2020 to October 2021, on the basis of clinical history, manifestation, interictal scalp electroencephalography and radiologic image features (hippocampal atrophy and higher signal intensity of hippocampi on T2-weighted images), a total of 22 hippocampal sclerosis patients, along with 1 pathologically confirmed hippocampal sclerosis patient, were included in the study (HS group). As a control group, 56 age matched subjects were recruited from the local community. All subjects underwent MRI examination on a 3.0T scanner (Signa Architect, GE Healthcare) with a 48-channel phased array head coil. Briefly, imaging protocol include traditional epilepsy MRI protocol (3D T1 weighted imaging, 3D T2 weighted and T2FLAIR imaging), diffusion weighted imaging and MAGiC. Detailed MAGiC scan parameters are as follows: TR:4417ms, two echoes (TE1: 22.9 msec, TE2: 97.8 msec) were acquired under four different delay times (176, 680, 1850, and 3855 msec), slice thickness: 3.0mm, slice spacing: 0mm, number of excitation times 1, bandwidth: 22.73Hz. Quantitative measurements, including T1, T2, and PD maps, were generated from the raw data produced by the MAGiC imaging sequence using a vendor-provided program (MAGiC, v. 100.1.1). For ADC, T1, T2 and PD maps, 3 ROIs are drawn manually at the head, body and tail of hippocampus to form an average value. Differences in the parameters between HS group and control group were compared with an independent Student’s t-test. Quantitative parameters with significant differences between HS and control groups were further combined for multiparametric analysis with logistic regression. The area under the receiver operating characteristic (ROC) curve (AUC), sensitivity (Sen), specificity (Spe), positive predictive value (PPV), and negative predictive value (NPV) were calculated at maximal Youden’s index. P < 0.05 was considered statistically significant.Results
In 23 patients with hippocampal sclerosis, the values of T1, T2 and ADC in the ipsilateral hippocampus were significantly higher than those in the normal control group(Table1, Figure2). No significant difference observed for PD between the 2 groups. The ROC analysis results are summarized in table 2. The ROC curves plotted in Figure1. T2 value demonstrated best performance in univariable analysis, with AUC 0.95, sensitivity 0.82, specificity 0.98, PPV 0.95 and NPV 0.93 respectively. In addition, the AUC of the combined model of T2 and ADC was 0.96, which was higher than that of ADC alone (AUC 0.884) or T2 alone (AUC 0.952). its sensitivity, specificity, positive predictive value and negative predictive value were 0.95,0.91,0.81,0.98 respectively(Table2, Figure1).Discussion and Conclusion
In this study the difference of quantitative MR parameters including T1, T2, PD, and ADCs, and the multiparametric strategies that contained more than one of the parameters, were all evaluated between MTLE hippocampal sclerosis and normal controls. The results demonstrated that the quantitative T1, T2, and ADC values differ significantly in hippocampal sclerosis patients over controls. However, PD was not statistically significant. Our findings was consistent with the results of CongyuLiao et al[8]. This may be related to the loss of neurons and cell proliferation in the hippocampus. The area under the ROC curve of T2 combined with ADC (AUC 0.961) is higher than the area under ROC curve of ADC alone (AUC 0.884), suggesting that the integrated MRI quantitative metrics can be used as an important reference index of hippocampal sclerosis in medial temporal lobe epilepsy. To conclude, Quantitative synthetic MRI might be beneficial in the diagnosis of hippocampal sclerosis. The approach combining T2 relaxation time (T2) and apparent diffusion coefficient (ADC) from DWI demonstrates highest AUC.Acknowledgements
This abstract would not have been possible without the consistent and valuable reference materials that I received from my tutor, whose insightful guidance and enthusiastic encouragement in the course of my shaping this abstract definitely gain my deepest gratitude.References
[1] Blumcke I, Spreafico R, Haaker G, et al. Histopathological Findings in Brain Tissue Obtained during Epilepsy Surgery[J]. N Engl J Med, 2017, 377(17): 1648-1656.
[2] Peixoto-Santos J E, Kandratavicius L, Velasco T R, et al. Individual hippocampal subfield assessment indicates that matrix macromolecules and gliosis are key elements for the increased T2 relaxation time seen in temporal lobe epilepsy[J]. Epilepsia, 2017, 58(1): 149-159.
[3] Téllez-Zenteno J F, Dhar R, Wiebe S. Long-term seizure outcomes following epilepsy surgery: a systematic review and meta-analysis[J]. Brain, 2005, 128(5): 1188-1198.
[4] Tsougos I, Kousi E, Georgoulias P, et al. Neuroimaging methods in Epilepsy of Temporal Origin[J]. Curr Med Imaging Rev, 2019, 15(1): 39-51.
[5] Vos S B, Winston G P, Goodkin O, et al. Hippocampal profiling: Localized magnetic resonance imaging volumetry and T2 relaxometry for hippocampal sclerosis[J]. Epilepsia, 2020, 61(2): 297-309.
[6] Sato S, Iwasaki M, Suzuki H, et al. T2 relaxometry improves detection of non-sclerotic epileptogenic hippocampus[J]. Epilepsy Res, 2016, 126: 1-9.
[7] Forster A, Griebe M, Gass A, et al. Diffusion-weighted imaging for the differential diagnosis of disorders affecting the hippocampus[J]. Cerebrovasc Dis, 2012, 33(2): 104-15.
[8] Liao C, Wang K, Cao X, et al. Detection of Lesions in Mesial Temporal Lobe Epilepsy by Using MR Fingerprinting[J]. Radiology, 2018, 288(3): 804-812.
Figures