3006
Simultaneous PET-MRI reveals differences in aerobic glycolysis in temporal lobe versus extra temporal lobe epilepsy1iHuman Institute, ShanghaiTech University, Shanghai, China, 2School of Life Science and Technology, ShanghaiTech University, Shanghai, China, 3Department of Nuclear Medicine, Ruijin Hospital, Shanghai Jiao Tong University School of Medicine, Shanghai, China, 4Collaborative Innovation Center for Molecular Imaging of Precision Medicine, Ruijin Center, Shanghai, China
Synopsis
Locating epileptic foci is critical for surgery in drug-resistant epilepsy. However, conventional methods (MRI, PET, SEEG) often cannot provide sufficient information alone. We have developed a new method, relative oxygen-glucose index (OGI), based on simultaneous PET and calibrated fMRI, which we used as a biomarker to locate epileptic foci during inter-ictal period. Relative OGI reflects aerobic glycolysis relative to global levels, which is useful as many diseases are characterized by metabolic pathway alterations. In this study, we not only demonstrate its potential in foci localization in epilepsy, but also distinguish temporal-lobe and extra-temporal-lobe epilepsy based on their different pathogenesis.
Introduction
Resecting the epileptic focus is an effective treatment for drug-resistant epilepsy, thus, accurately locating the primary focus is necessary. Usually, a single-modal measurement cannot provide sufficient information for diagnosis. Even though MRI can detect epileptic foci caused by focal cortical dysplasia (FCD), many cases with other pathogenesis, especially for temporal lobe epilepsy (TLE), are MRI-negative. To overcome this limitation, PET and SEEG examinations need to be introduced as well. The combination of MRI, PET and SEEG improve the diagnosis greatly, but their results can be contradictory1 since each technique only reflects partial biology of the disease. Because metabolic pathways in epileptic foci change during seizures, the biomarker oxygen-to-glucose index (OGI) which integrates multi-modal information to generate an overall aerobic glycolysis map, has strong potential for diagnosis. However, patients can usually be scanned during inter-ictal period when the metabolism significantly differs from during seizures. Here, we present a simultaneous PET-MRI method, which uses OGI as an imaging biomarker to reveal the differences in aerobic glycolysis in temporal-lobe (TLE) versus extra-temporal-lobe epilepsy (ETLE). This method shows potential in locating metabolic abnormality, in other words, the primary epileptic focus in the brains of patients.Methods
SubjectsThe study was conducted in accordance with the Helsinki Protocol, and was approved by the Ethics Committee of ShanghaiTech University (IRB#2021-002) and the Ethics Committee of Shanghai Ruijin Hospital, Shanghai Jiao Tong University School of Medicine (No. 2016-123). For all included participants, written informed consent was provided. 24 TLE patients (age 31±10), 11 ETLE patients (age 25±10), and 18 healthy controls (age 47±9) were included. All patients went through PET-MRI scan during inter-ictal period.
PET-MRI Protocol
Static FDG-PET data were acquired in sinogram mode for 15 min covering the whole brain. Sagittal T1-MPRAGE: TE = 2.44 ms, TR = 1900 ms, flip angle = 9º. Axial GRE T2* map: TE = 2.46 / 4.92 / 7.38 / 9.84 ms, TR = 391 ms, averages = 3, flip angle = 25º. Axial SE T2 map: TE = 10.5 / 21.0 / 31.5 / 42.0 /52.5 / 63.0 ms, TR = 2000 ms, flip angle = 180º. Axial PASL: TE = 11 ms, TR = 2500 ms, flip angle = 90º.
Relative OGI Calculation
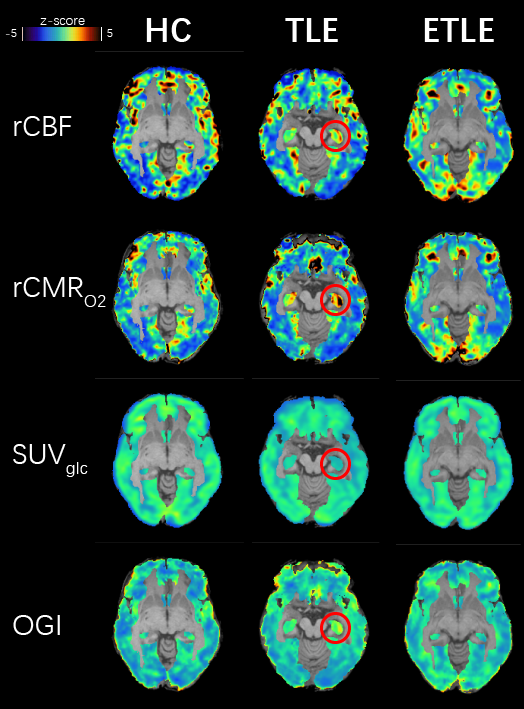
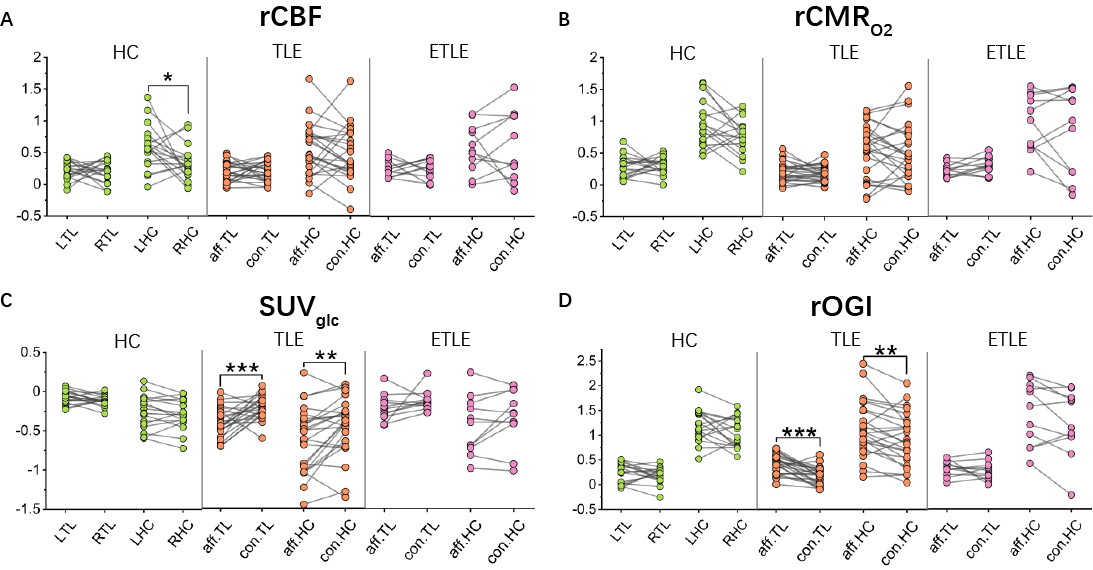
All image modalities of each subject were first registered to that subject’s T1WI. Then T1WI images were registered to the MNI template and this transformation was applied to other modalities. We used a calibrated fMRI method to draw the relative consumption metabolic rate of oxygen (CMRO2) from T2 map, T2* map2,3, and CBF. Standard utilization value of 18F-FDG (SUVglc) was used from PET data. Relative OGI is the ratio between CMRO2 and SUVglc. The final maps were presented as z-scores for comparison (Fig.1). Statistics We used Shapiro-Wilk normality test to confirm the normal distribution of the mean values of brain regions (parietal lobe, temporal lobe, frontal lobe, insular cortex, occipital lobe, and hippocampus). Then we used paired-sample, two-tailed t-tests to compare the differences between left and right hemispheres (healthy controls) or affected and contralateral hemispheres (epilepsy patients) at the 0.05 confidence level. p-values are ***p ≤ 0.001, **p ≤ 0.01, *p ≤ 0.05 and non-significant difference are p > 0.05.
Results
Relative OGI is uniform across brain regions in healthy controls.We found that even though asymmetry happens in some interest brain regions in relative CBF, relative CMRO2, and SUV (Fig.2A), the relative OGI shows no significant difference between two hemispheres across all selected brain regions (Fig.2), consistent with previous PET studies4. This asymmetry is likely due to the elder age of this group5 and differences in grey matter density. However, the robustness of relative OGI demonstrates its potential as a diagnostic biomarker.
Relative OGI significantly increases at foci in TLE patients.
Similar but opposite to PET results, relative OGI increased in the affected temporal lobe and hippocampus (Fig.2C-D). We found that even though glucose uptake decreased in TLE foci, the oxidization level increased, in other words, aerobic glycolysis decreased. Thus, during inter-ictal period changes to aerobic glycolysis are opposite of what happens in the ictal period, suggesting some kind of metabolic compensation.
ETLE patients show different metabolic characteristics.
Most ELTE cases in this study were caused by FCD, unlike the TLE patients. There was no significant difference between two hemispheres in temporal lobe and hippocampus (Fig.2), indicating different metabolic characteristics of the two types of epilepsy.
Conclusion and Discussion
We established a novel biomarker, relative OGI, to locate the epileptic foci during inter-ictal period. We observed a significant increase in relative OGI in the affected temporal lobe and hippocampus of TLE patients only. This is opposite to the change observed with SUVglc suggests lower aerobic glycolysis during TLE inter-ictal period. Also, we observed different metabolic characteristics between TLE and ETLE. Even though conventional 15O-PET method for OGI measurement proved its value in Huntington's disease diagnosis6, the difficulty of 15O operation limits its application. Fortunately, our relative OGI method based on simultaneous PET and calibrated fMRI shows potential to detect metabolic abnormalities in an accessible manner for many hospitals. However, more data and analysis are required before it can become a complementary diagnostic method for neuronal metabolic-related disorders like epilepsy.Acknowledgements
This work was supported by ShanghaiTech University, the Shanghai Municipal Government, the National Natural Science Foundation of China Grant (No. 81950410637) and Shanghai Municipal Key Clinical Specialty (No. shslczdzk03403).References
1. Guedj E, Bonini F, Gavaret M, et al. 18FDG-PET in different subtypes of temporal lobe epilepsy: SEEG validation and predictive value. Epilepsia. 2015;56(3):414-421.
2. Shu CY, Herman P, Coman D, et al. Brain region and activity-dependent properties of M for calibrated fMRI. NeuroImage. 2016;125:848-856.
3. Xu M, Bo B, Pei M, et al. High-resolution relaxometry-based calibrated fMRI in murine brain: Metabolic differences between awake and anesthetized states. JCBFM. Accepted on 25th Oct. 2021.
4. Hyder F, Herman P, Bailey CJ, et al. Uniform distributions of glucose oxidation and oxygen extraction in gray matter of normal human brain: No evidence of regional differences of aerobic glycolysis. JCBFM. 2016/05/01 2016;36(5):903-916.
5. He X, Qin W, Liu Y, et al. Age-related decrease in functional connectivity of the right fronto-insular cortex with the central executive and default-mode networks in adults from young to middle age. Neuroscience Letters. 2013;544:74-79.
6. Powers WJ, Videen TO,
Markham J, et al. Selective defect of
in vivo glycolysis in early Huntington's disease striatum.
PNAS. 2007;104(8):2945-2949.
Figures