3004
A multimodal meta-analysis of regional functional and structural brain abnormalities in obsessive-compulsive disorder1Medical Imaging Center, First Affiliated Hospital of Jinan, Guangzhou, China, 2GE Healthcare, Beijing, China, Beijing, China
Synopsis
Numerous neuroimaging studies have revealed abnormalities in specific brain regions in obsessive-compulsive disorder (OCD), but results have been inconsistent. We conducted a whole-brain voxel-wise meta-analysis on resting-state functional imaging and VBM studies between OCD patients and HCs by using Seed-based d Mapping (SDM) software. The meta-analysis demonstrated that OCD exhibits similar abnormalities in both function and structure in the prefrontal and insula. Few regions exhibited only functional or only structural abnormalities in OCD. These results expand the current understanding of functional and structural brain abnormalities in OCD patients, which would provide additional potential targets for therapeutic intervention.
Background
Obsessive-compulsive disorder (OCD), a common and disabling psychiatric illness, is characterized most notably by recurrent and intrusive thoughts that cause distress (obsessions) as well as repetitive behaviors performed to reduce this distress (compulsions) 1,2. The symptoms of obsessions or compulsions severely impact the patient’s normal life, occupational and social functioning 3,4, and even cause suicidality 5. With a lifetime prevalence of 2–3% (more than twice that of schizophrenia) and an early disease onset, OCD imposes a huge burden on patients, their families and society 6,7. Despite numerous studies that have been done on OCD, the precise pathophysiology of this complex disorder remains unclear. In recent years, neuroimaging approaches provide a noninvasive and powerful method to investigate the neurobiological mechanisms of OCD 8,9. Numerous neuroimaging studies of resting-state functional imaging and voxel-based morphometry (VBM) have revealed abnormalities in specific brain regions in obsessive-compulsive disorder, but results have been inconsistent. This may be partially due to limited statistical power from relatively small samples and clinical heterogeneity related to variation in disease profile and developmental stage.Methods
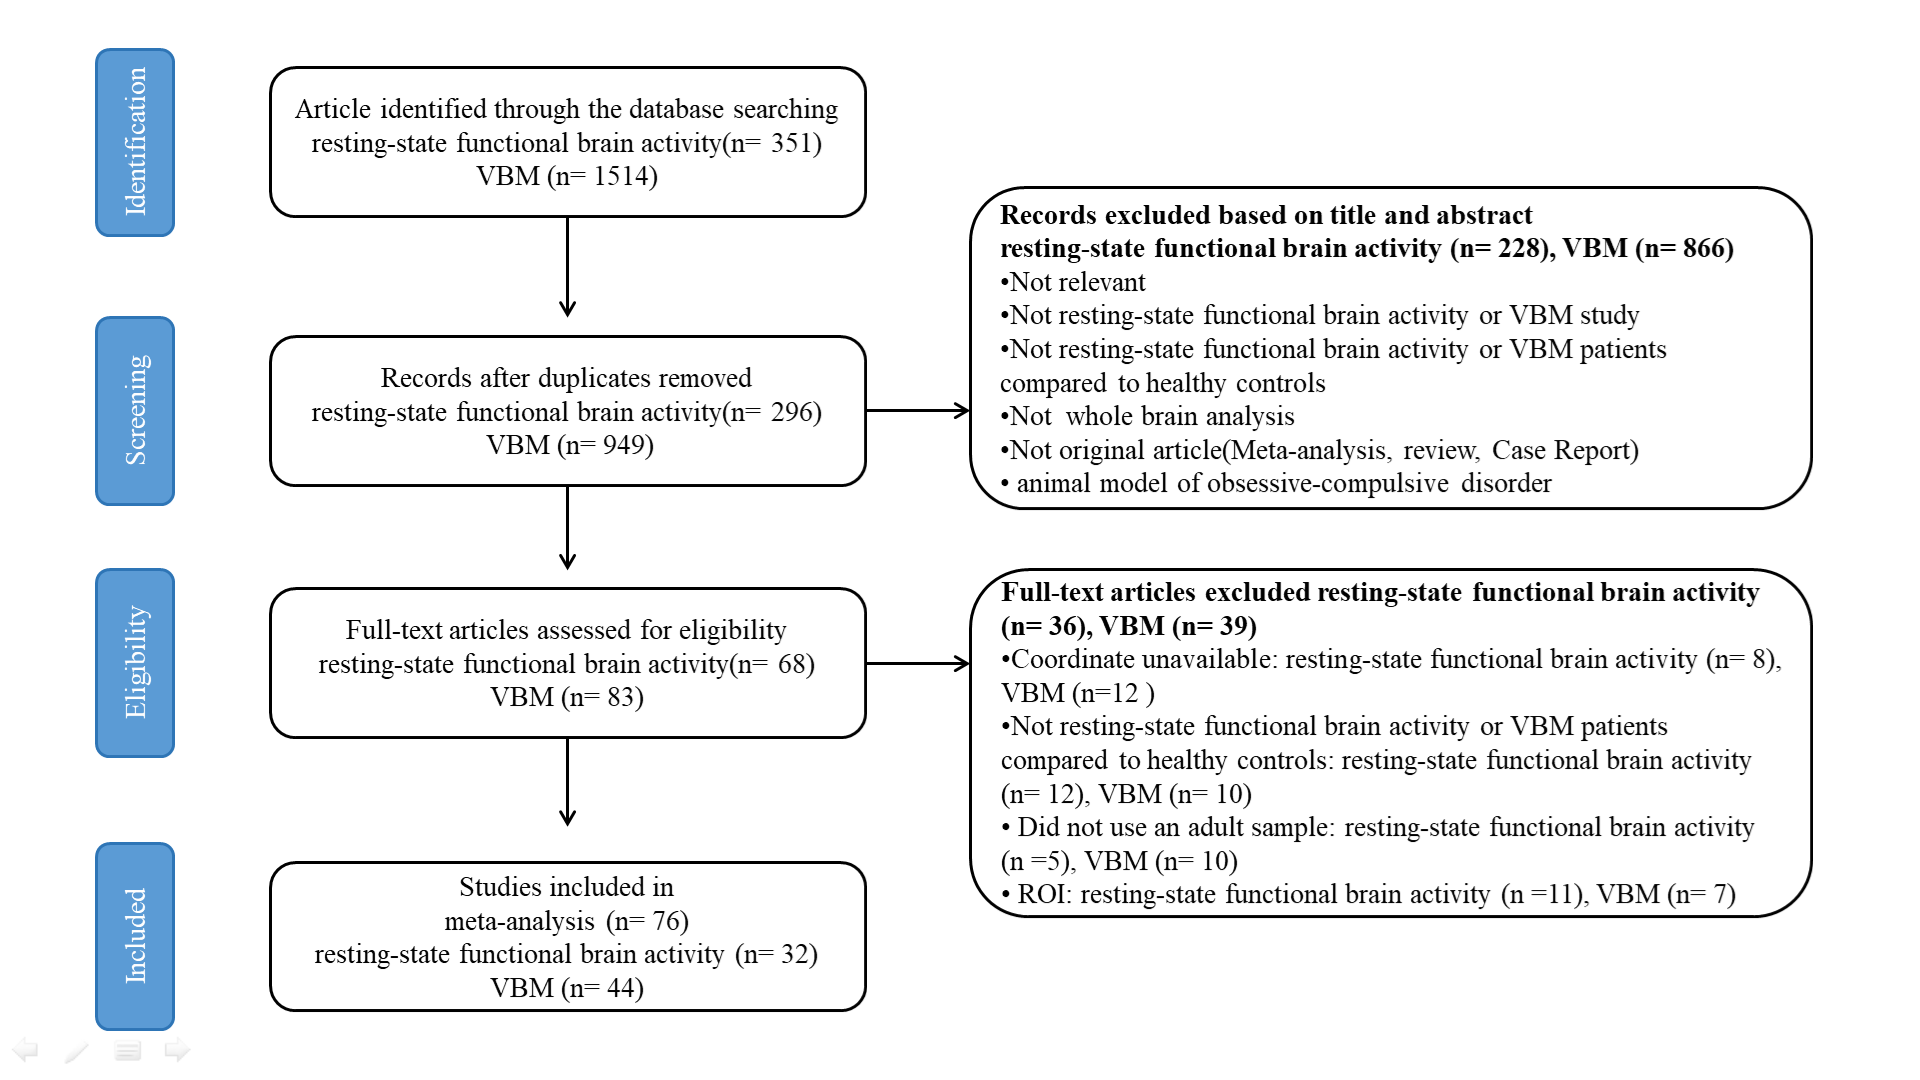
We conducted a whole-brain voxel-wise meta-analysis on resting-state functional imaging and VBM studies that investigated differences of functional activity and grey matter volume (GMV) between patients with OCD and healthy controls (HCs) by using Seed-based d Mapping (SDM) software.Results
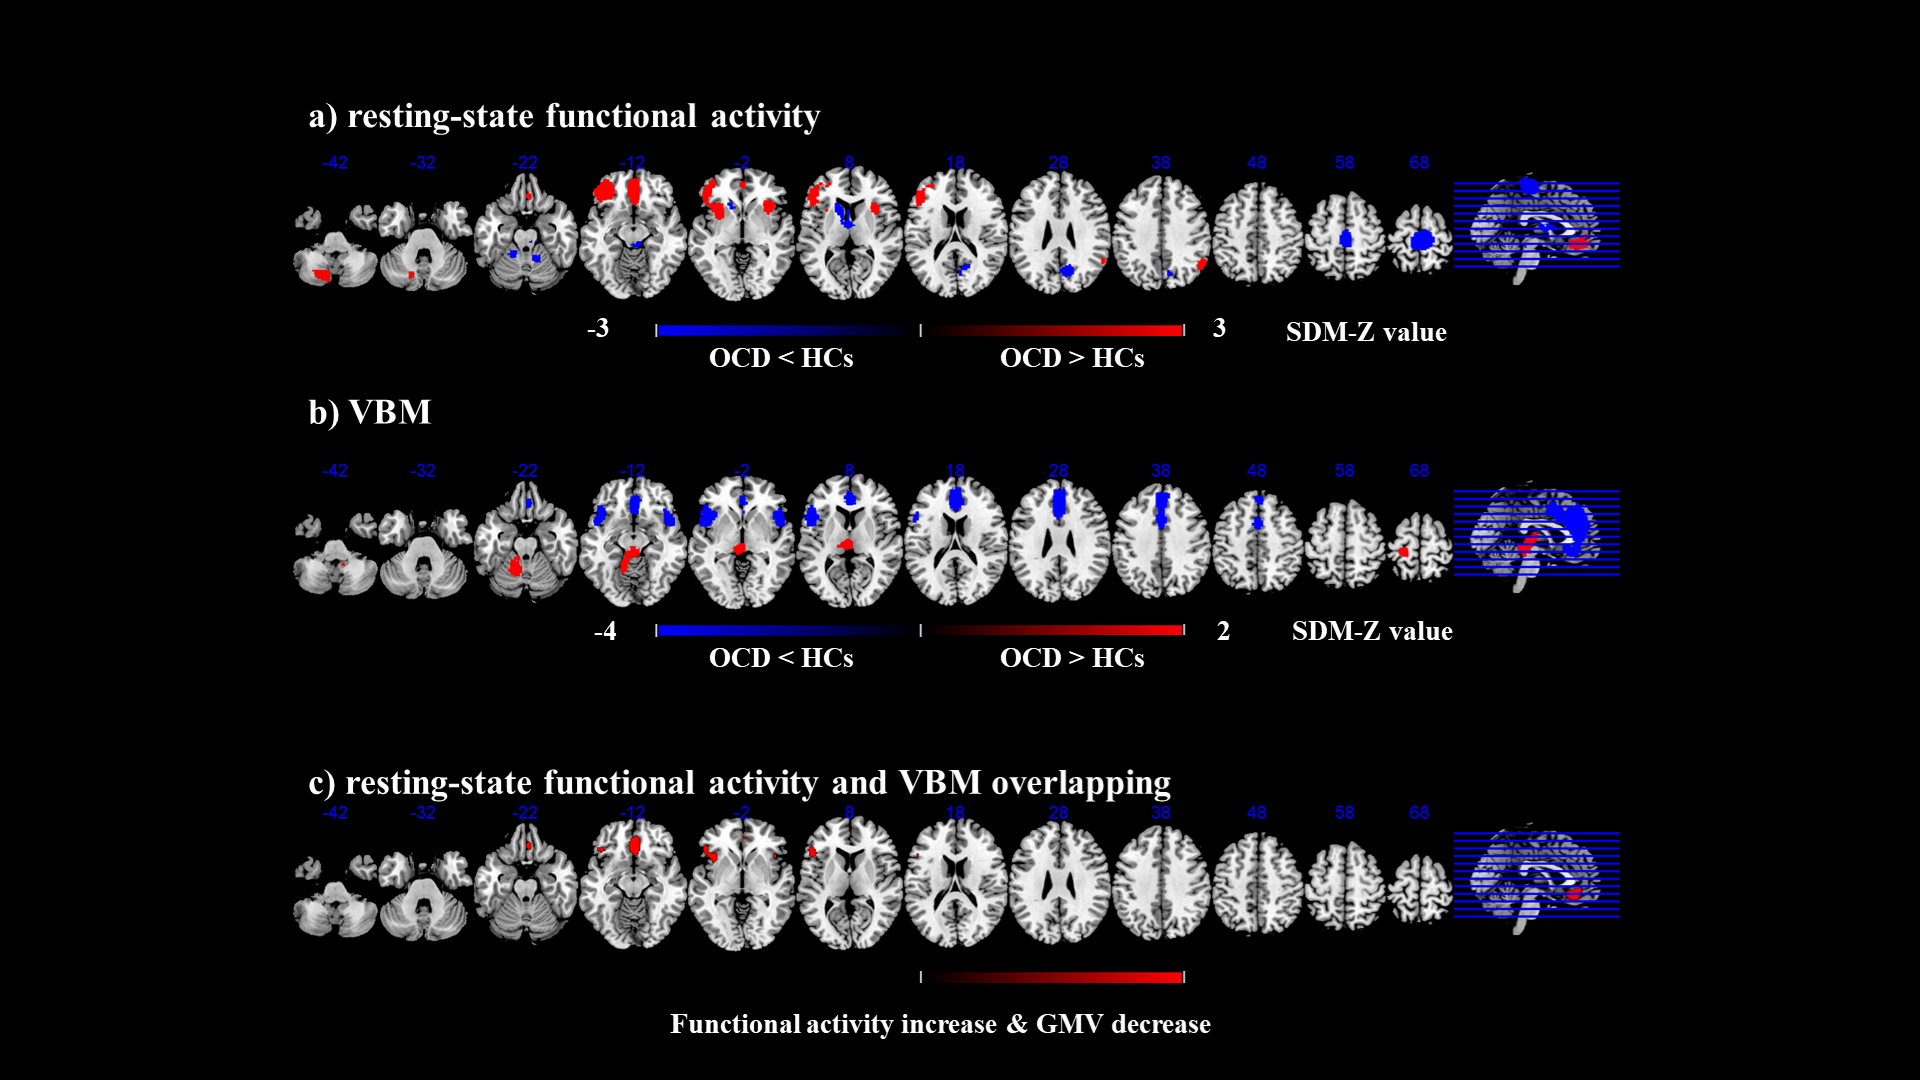
A total of 32 independent studies (39 datasets) comprising 1239 OCD patients and 1374 HCs for resting-state functional imaging and 44 studies (52 datasets) comprising 2021 OCD patients and 2402 HCs for VBM were included by a systematic literature search. Overall, patients with OCD displayed functional increase in the left inferior frontal gyrus (IFG) (extending to the left insula), bilateral medial prefrontal cortex/ anterior cingulate cortex (mPFC/ACC), right insula, right inferior parietal gyri (IPG), and left posterior lobe of cerebellum, as well as decrease in the bilateral paracentral lobule, right precuneus cortex, left striatum and bilateral anterior lobe of cerebellum. For the VBM meta-analysis, we found that patients with OCD displayed decreased GMV in the bilateral mPFC/ACC, bilateral insula and IFG, and increased GMV in the left postcentral gyrus and bilateral anterior lobe of cerebellum (extending to the bilateral thalamus).Conclusions
The multimodal meta-analyses suggest that OCD patients show similar patterns of aberrant regional spontaneous intrinsic brain activity and structure mainly in the mPFC/ACC, left IFG, and insula, which suggest that structural deficits might underlie alterations in function. In addition, few regions exhibited only functional or only structural abnormalities in OCD, such as in the DMN (default mode network), sensorimotor cortices, striatum and cerebellum.Acknowledgements
The study was supported by grants from the National Natural Science Foundation of China (81671670 and 81971597); National Key R&D Program of China (2020YFC2005700); Project in Basic Research and Applied Basic Research in General Colleges and Universities of Guangdong, China (018KZDXM009); Planned Science and Technology Project of Guangzhou, China (201905010003). The funding organizations played no further role in study design, data collection, analysis and interpretation and paper writing.References
1. Pauls D L, Abramovitch A, Rauch S L, et al. Obsessive-compulsive disorder: An integrative genetic and neurobiological perspective[J]. Nat Rev Neurosci, 2014, 15(6): 410-424.
2. Stein D J, Costa D L C, Lochner C, et al. Obsessive-compulsive disorder[J]. Nat Rev Dis Primers, 2019, 5(1): 52.
3. Micali N, Heyman I, Perez M, et al. Long-term outcomes of obsessive-compulsive disorder: Follow-up of 142 children and adolescents[J]. Br J Psychiatry, 2010, 197(2): 128-134.
4. Rosa A C, Diniz J B, Fossaluza V, et al. Clinical correlates of social adjustment in patients with obsessive-compulsive disorder[J]. J Psychiatr Res, 2012, 46(10): 1286-1292.
5. Fernández de la Cruz L, Rydell M, Runeson B, et al. Suicide in obsessive-compulsive disorder: A population-based study of 36 788 swedish patients[J]. Mol Psychiatry, 2017, 22(11): 1626-1632.
6. Ruscio A M, Stein D J, Chiu W T, et al. The epidemiology of obsessive-compulsive disorder in the national comorbidity survey replication[J]. Mol Psychiatry, 2010, 15(1): 53-63.
7. Baxter A J, Vos T, Scott K M, et al. The global burden of anxiety disorders in 2010[J]. Psychol Med, 2014, 44(11): 2363-2374.
8. Masdeu J C. Neuroimaging in psychiatric disorders[J]. Neurotherapeutics, 2011, 8(1): 93-102.
9. Kwon J S, Jang J H, Choi J S, et al. Neuroimaging in obsessive-compulsive disorder[J]. Expert Rev Neurother, 2009, 9(2): 255-269.
Figures