3003
Application of quantitative magnetic resonance imaging in the diagnosis of autism in children1Children's Hospital of Chongqing Medical University, Chongqing, China, 2GE Healthcare, MR Research China, Beijing, Beijing, China
Synopsis
Purpose: To explore the application of quantitative magnetic resonance imaging in the diagnosis of autism in children. Methods: All the children were scanned using head MRI conventional sequences, 3D-T1,DKI, ESWAN and 3D-pcASL sequences. The QSM, CBF and brain microstructure of each brain area were compared between the groups, and correlations were analyzed. Results: The frontal lobe, temporal lobe and hippocampal regions may be the first areas to show microstructural changes in autistic children . Conclusion: Quantitative magnetic resonance imaging can shows the abnormal changes of brain microstructural in children with autism .
Introduction
ASD is a group of neurodevelopmental disorder with the onset in early childhood, characterized by impairment in communication, and social interaction, rigidity of interests, and repetitive stereotypical behaviors. The incidence of ASD is increasing worldwide While the etiology and pathogenesis of autism are poorly understood and no specific drug is available.Currently, the early diagnosis of ASD is mainly based on the patients’ clinical manifestations, but the clinical manifestations of most ASD children are atypical and the symptoms-based early diagnosis is difficult, especially for low-age children with ASD, which eventually leads to many ASD children missing effective early intervention expectations. Therefore, there is an urgent need for early, fast, convenient and feasible diagnostic methods for ASD.
In previous studies, only a few researchers explored whether the brain blood flow or gray matter of ASD children was abnormal by 3D-ASL, QSM and DKI sequences.However they did not prove whether there are spatial overlap in brain regions with reduced iron content, cerebral blood flow perfusion, abnormal gray matter microstructure, and whether there is a correlation between them.
In this study, we performed multimodal MRI (conventional MRI sequences, ESWAN, DKI, 3D-pcASL and 3D-T1 MRI sequences) to scan the brains of autistic children and healthy children . The quantitative maps of the QSM, DKI, and CBF MRI data and a 3D-T1 structure map of the brain were obtained through postprocessing. The quantitative and structural maps of the two groups were compared and analyzed. The correlation was analyzed to obtain a specific MRI diagnostic basis of autism in children if any differences were found.
Methods
This study was approved by the institutional review board, and written informed consent was obtained from all patients.Sixty autistic children aged 2-3 years and 60 age- and sex-matched healthy children participated in the study. All the children were scanned using head MRI conventional sequences, 3D-T1, DKI, ESWAN and 3D-pcASL sequences on a 3.0 T MRI scanner(Discovery MR 750W, GE Healthcare).
3D-pcASL: thickness, 4 mm; TR, 4628 ms; PLD, 1525 ms; scanning time, 4 minutes and 29 seconds. DKI: thickness, 3 mm; TR, 4500 ms; total diffusion direction, 30; and B values of 0, 1000, 2000; scanning time, 5 minutes and 20 seconds. ESWAN: thickness, 3 mm; TR, 81.8; flip angle, 20; TE, 4 ms; scanning time, 7 minutes and 47 seconds. 3D-T1: FOV, 24 cm; thickness, 1 mm; TR, 7.9 ms; flip angle, 12; TE, 3.1 ms; and 156 layers; scanning time, 3 minutes and 43 seconds.
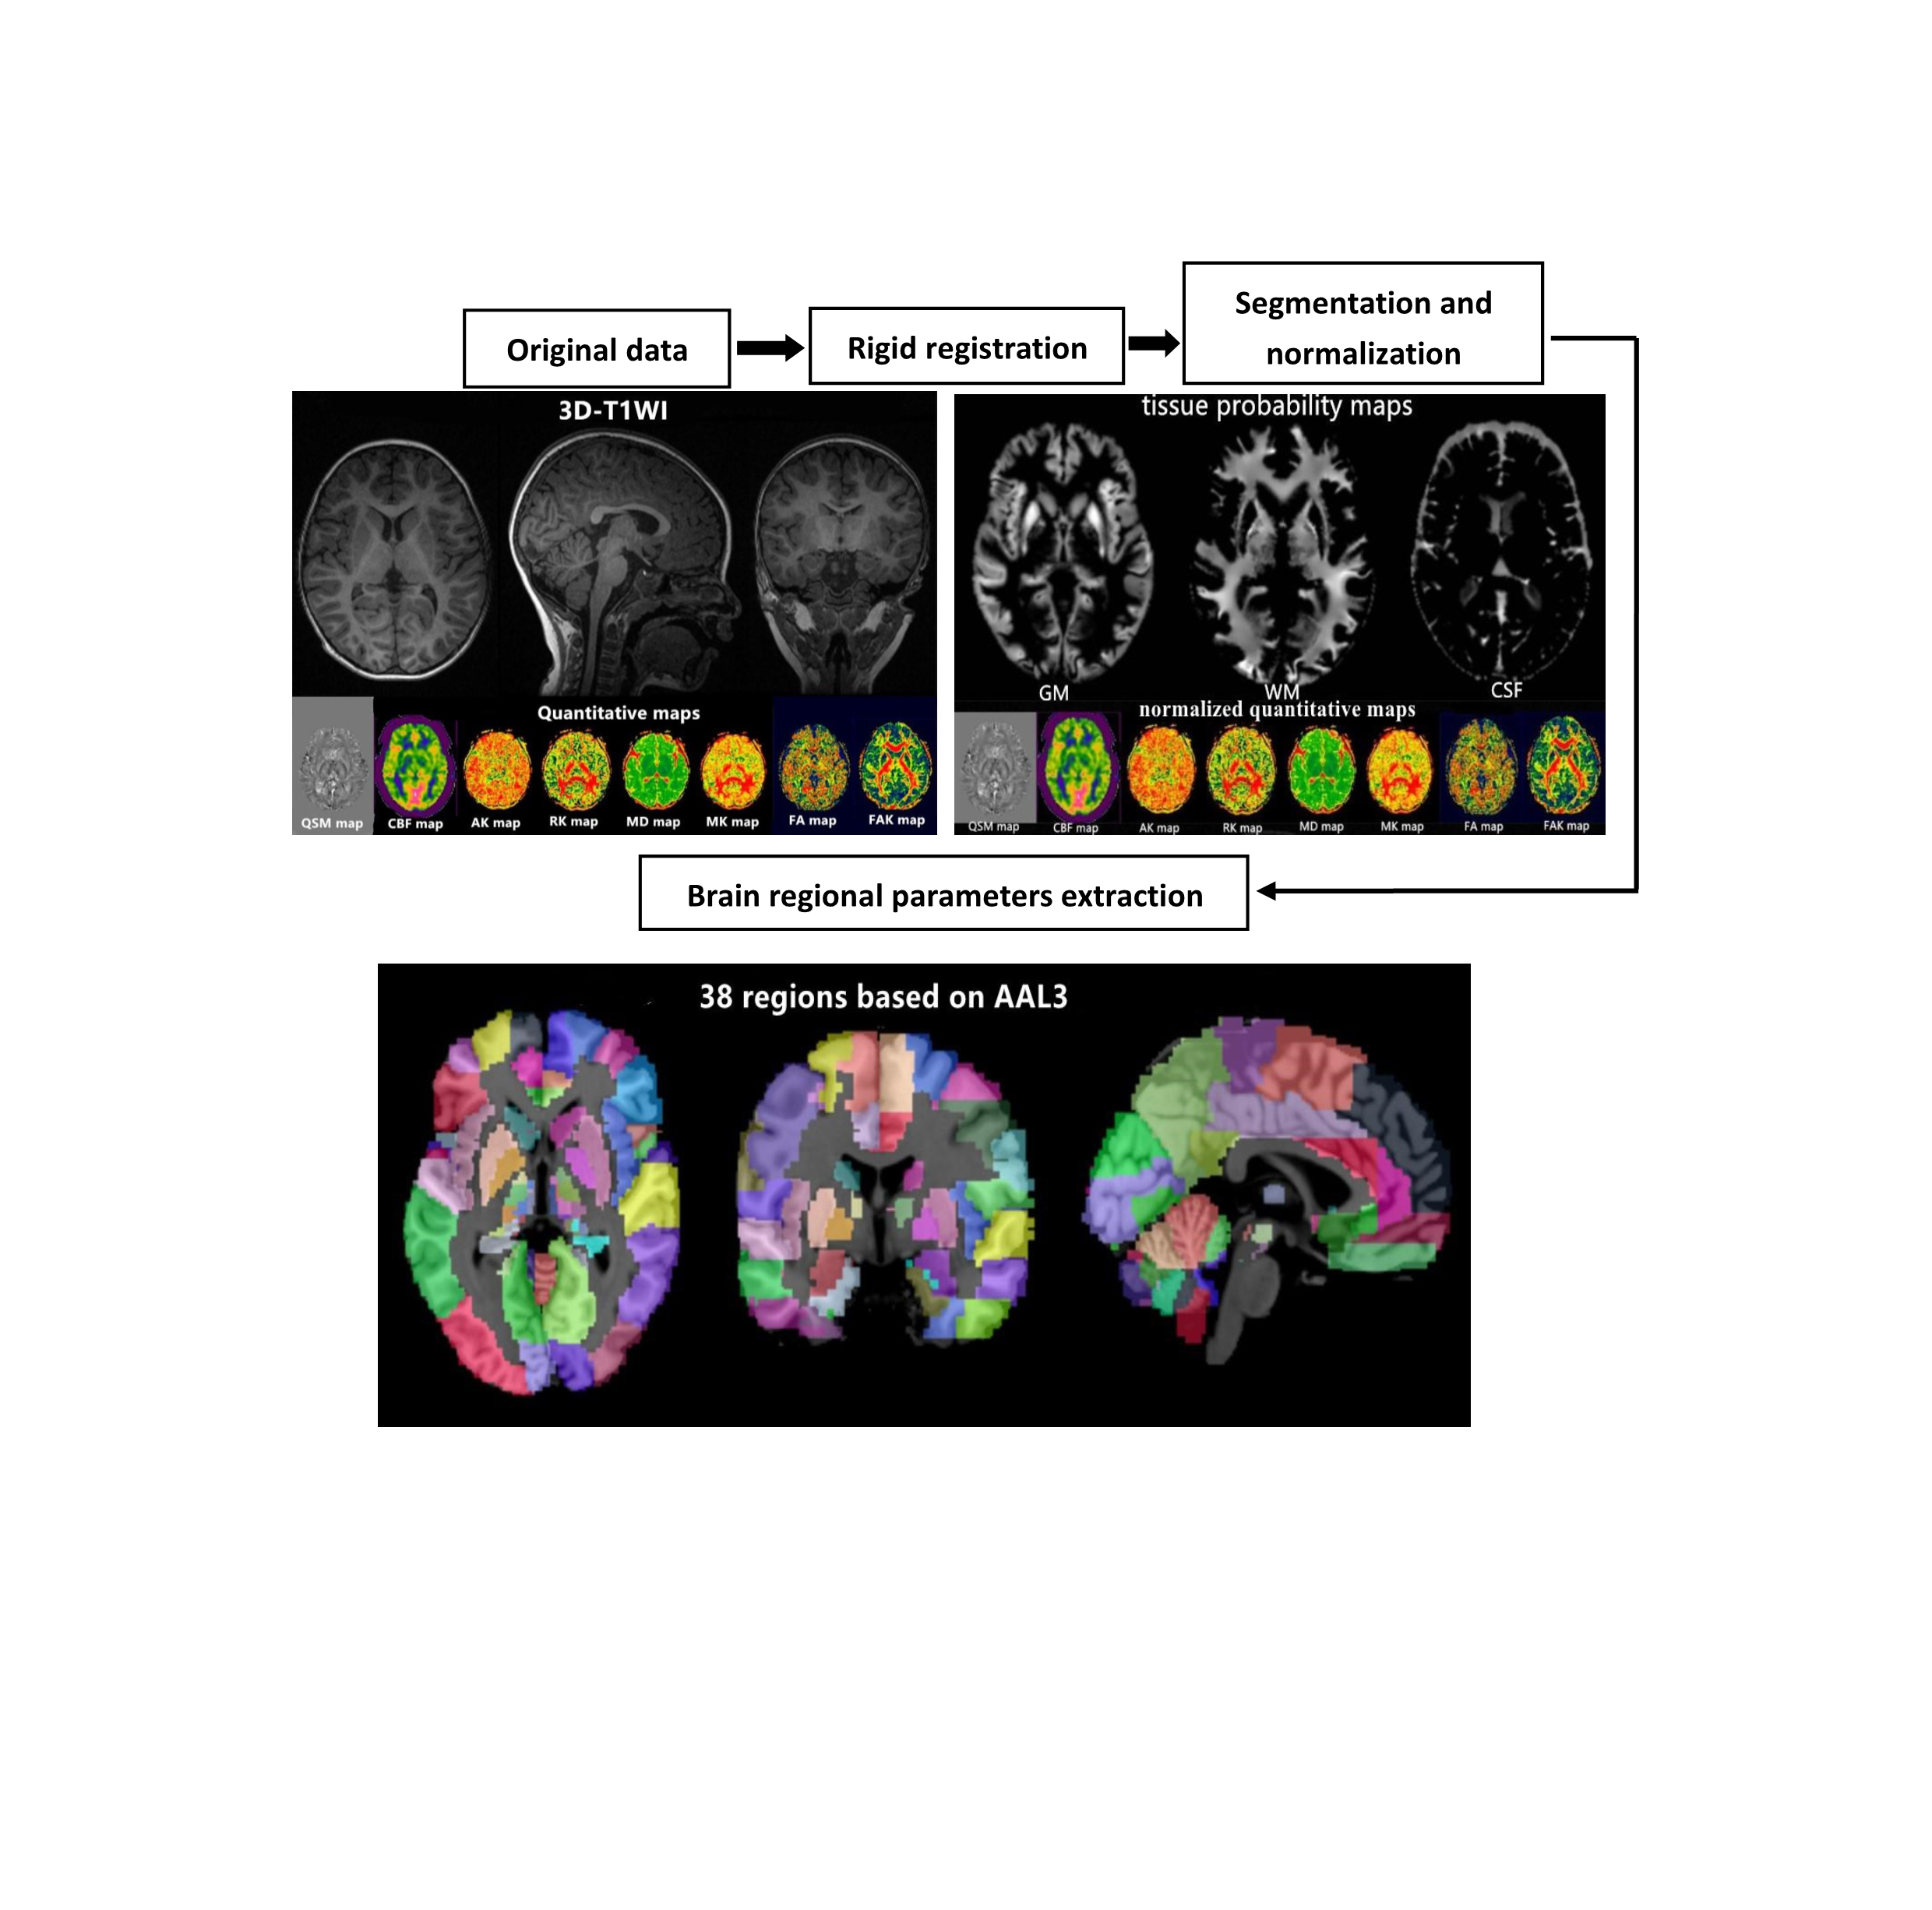
All MRI postprocessing was performed at the Advantage workstation (v. 4.6, GE Healthcare). The qsm, CBF and brain microstructure of each brain area were compared between the groups, and correlations were analyzed. To calculate the quantitative parameters, including the gray matter volume (GMV), white matter volume (WMV), QSM, CBF, MD, FA, FAK, RK, MK and AK values of different brain regions, we followed an atlas-based image processing approach (Fig 1).
SPSS 25.0 statistical software was used, All data were tested for normality and variance homogeneity prior to analyses, and the the independent two-sample t test was used if the data conform to the normality and variance homogeneity.
Results
The iron content and cerebral blood flow in the frontal lobe, temporal lobe, hippocampus, caudate nucleus, substantia nigra and red nucleus of the study group were lower than those in the corresponding brain areas of the control group (p < 0.05).The MK, RK and AK values of the frontal lobe, temporal lobe, putamen, hippocampus, caudate nucleus, substantia nigra and red nucleus in the study group were lower than those of the corresponding brain areas in the control group (p < 0.05). The MD and FAK values of the frontal lobe, temporal lobe and hippocampus in the control group were lower than those in the corresponding brain areas in the study group (p < 0.05).
The values of CBF, QSM and DKI in frontal lobe, temporal lobe and hippocampus could distinguish ASD children (AUC > 0.5, P < 0.05), among which multimodal technology (QSM, CBF, DKI) had the highest AUC(0.917) and DKI had the lowest AUC(0.642).(Fig 2)
Conclusion
We speculate that the frontal lobe, temporal lobe and hippocampal regions may be the first areas to show microstructural changes in autistic children. The values of CBF, QSM and DKI in frontal lobe, temporal lobe and hippocampus could distinguish ASD children (AUC > 0.5, P < 0.05), among which multimodal technology (QSM, CBF, DKI) had the highest AUC (0.917) and DKI had the lowest AUC (0.642). Therefore, these three brain regions could be served as the key areas of brain imaging in the diagnosis of ASD children, and multimodal technology (QSM, CBF, DKI) could be considered as the first choice of imaging diagnostic technology.In conclusion, the iron content and cerebral blood flow in the frontal lobe, temporal lobe, and hippocampus of autistic children are lower than those of healthy children, and the brain microstructures in the children with autism are changed. Quantitative magnetic resonance imaging (including QSM, 3D-pcASL and DKI) can detect abnormalities in the iron content, cerebral blood flow and brain microstructure in young autistic children,multimodal technology could be considered as the first choice of imaging diagnostic technology.
Acknowledgements
No acknowledgement found.References
[1] Gabrielsen TP1, Anderson JS2, Stephenson KG, et al. Functional MRI connectivity of children with autism and low verbal and cognitive performance. Mol Autism. 2018,27(9):67-75.
[2] Cox AD, Virues-Ortega J, Julio F, et al. Establishing motion control in children with autism and intellectual disability: Applications for anatomical and functional MRI. J Appl Behav Anal. 2017,50(1):8-26.
[3] Peterson BS, Zargarian A, Peterson JB, et al.Hyperperfusion of Frontal White and Subcortical Gray Matter in Autism Spectrum Disorder.Biol Psychiatry. 2019,85(7):584-595.
[4] Dell'Osso L, Lorenzi P, Carpita B.Autistic Traits and Illness Trajectories. Clin Pract Epidemiol Ment Health. 2019,30(15):94-98.
[5] Nuntanee S, Daranee S. Effect of Motorized Elephant-Assisted Therapy Program on Balance Control of Children with AutismSpectrum Disorder. Occup Ther Int. 2019, (11)18.2019:5914807.
[6] Dean DC 3rd, Freeman A, Lainhart J, et al.The development of the social brain in baby siblings of children with autism. Curr Opin Psychiatry. 2020,33(2):110-116.
[7] Sen B, Borle NC, Greiner R, et al. A general prediction model for the detection of ADHD and Autism using structural and functional MRI. PLoS One. 2018,13(4):e0194856.
[8] Tseng PT, Cheng YS, Chen YW, et al. Peripheral iron levels in children with autism spectrum disorders vs controls: a systematicreview and meta-analysis.Nutr Res. 2018,50(8):44-52.
[9] Hrdlicka M, Sanda J, Urbanek T, et al. Diffusion Tensor Imaging And Tractography In Autistic, Dysphasic, And Healthy Control Children. Neuropsychiatr Dis Treat. 2019, (3)15:2843-2852.
[10] Wei H, Dibb R, Zhou Y, et al. Streaking artifact reduction for quantitative susceptibility mapping of sources with large dynamic range. NMR in Biomedicine. 2015,28(10):1294-1303.
[11] Wei H, Xie L, Dibb R, et al. Imaging whole-brain cytoarchitecture of mouse with MRI-based quantitative susceptibility mapping. Neuroimage.2016,15(137):107-115.
[12] Uchida Y, Kan H, Sakurai K, et al. Voxel-based quantitative susceptibility mapping in Parkinson's disease with mild cognitive impairment. Mov Disord. 2019,34(8):1164-1173.
[13] Dean DC 3rd, Freeman A, Lainhart J, et al. The development of the social brain in baby siblings of children with autism. Curr Opin Psychiatry. 2020,33(2):110-116.
[14] Sen B, Borle NC, Greiner R, et al. A general prediction model for the detection of ADHD and Autism using structural and functional MRI. PLoS One. 2018,13(4):e0194856.
[15] Andrews DS, Lee JK, Solomon M, et al. A diffusion-weighted imaging tract-based spatial statistics study of autism spectrum disorder in preschool-aged children. J Neurodev Disord.2019,11(1):32-40.
[16] Shilong Tang, Ye Xu, Xianfan Liu, Zhuo Chen, Yu Zhou, Lisha Nie, Ling He1. Quantitative susceptibility mapping shows lower brain iron content in children with autism. European radiology. 2021 ,31(4):2073-2083.
[17] Mori T, Ito H, Harada M, Hisaoka S, Matsumoto Y, Goji A, Toda Y, Mori K, Kagami S. Multi-delay arterial spin labeling brain magnetic resonance imaging study for pediatric autism. Brain Dev. 2020,42(4):315-321
[18] McKenna F, Miles L, Donaldson J, Castellanos FX, Lazar M. Diffusion kurtosis imaging of gray matter in young adults with autism spectrum disorder. Sci Rep. 2020,10(1):21465
[19] Bener A, Khattab AO, Bhugra D, et al. Iron and vitamin D levels among autism spectrum disorders children.Ann Afr Med. 2017,16(4):186-191.
[20] Yan F, He N, Lin H, et al. Iron deposition quantification: Applications in the brain and liver.J Magn Reson Imaging. 2018,48(2):301-317.
[21] Lyudmila Pivina, Yuliya Semenova, Monica Daniela Doşa, et al. Iron Deficiency, Cognitive Functions, and Neurobehavioral Disorders in Children.Journal of Molecular Neuroscience. 2019,68(1):1–10
[22] Gunes S, Ekinci O, Celik T. Iron deficiency parameters in autism spectrum disorder: clinical correlates and associated factors. Ital J Pediatr. 2017,43(1):86-92.
[23] Azuma M, Hirai T, Nakaura T, et al. Combining quantitative susceptibility mapping to the morphometric index in differentiating between progressive supranuclear palsy and Parkinson's disease. J Neurol Sci. 2019,15(406):116443.
[24] Cheng Z, Zhang J, He N, et al. Radiomic Features of the Nigrosome-1 Region of the Substantia Nigra: Using QuantitativeSusceptibility Mapping to Assist the Diagnosis of Idiopathic Parkinson's Disease. Front Aging Neurosci.2019,16(11):167-178.
[25] Zhang S, Nguyen TD, Hurtado Rúa SM, et al. Quantitative Susceptibility Mapping of Time-Dependent Susceptibility Changes in Multiple Sclerosis Lesions. AJNR Am J Neuroradiol.2019,40(6):987-993.
[26] Kaunzner UW, Kang Y, Zhang S,et al. Quantitative susceptibility mapping identifies inflammation in a subset of chronic multiple sclerosis lesions. Brain. 2019,142(1):133-145.
[27] Arabi M, Saberi Kakhki A, Sohrabi M, et al. Is visuomotor training an effective intervention for children with autism spectrum disorders? Neuropsychiatr Dis Treat. 2019,8(15):3089-3102.
[28]Tang S, Liu X, He L, Liu B, Qin B, Feng C. Application of a 3D pseudocontinuous arterial spin-labeled perfusion MRI scan combined with a postlabeling delay value in the diagnosis of neonatal hypoxic-ischemic encephalopathy. PLoS One. 2019 , 14(7):e0219284
[29]Tang S, Liu X, He L, Liu B, Qin B, Feng C. Application of Postlabeling Delay Time in 3-Dimensional Pseudocontinuous Arterial Spin-Labeled Perfusion Imaging in Normal Children. J Comput Assist Tomogr. 2019 ,43(5):697-707
[30] Morana G, Piccardo A, Tortora D, Puntoni M, Severino M, Nozza P, Ravegnani M, Consales A, Mascelli S, Raso A, Cabria M, Verrico A, Milanaccio C, Rossi A. Grading and outcome prediction of pediatric diffuse astrocytic tumors with diffusion and arterial spin labeling perfusion MRI in comparison with 18F-DOPA PET. Eur J Nucl Med Mol Imaging, 2017 ,44(12):2084-2093.
[31] Wong AM, Yeh CH, Liu HL, Wu TW, Lin KL, Wang HS, Toh CH. Arterial spin-labeling perfusion imaging of children with subdural hemorrhage: Perfusion abnormalities in abusive head trauma. J Neuroradiol, 2017,44(4):281-287.
[32] Boulouis G, Dangouloff-Ros V, Boccara O, Garabedian N, Soupre V, Picard A, Couloigner V, Boddaert N, Naggara O, Brunelle F. Arterial Spin-Labeling to Discriminate Pediatric Cervicofacial Soft-Tissue Vascular Anomalies. AJNR Am J Neuroradiol, 2017 ,38(3):633-638.
[33] Hu HH, Li Z, Pokorney AL, Chia JM, Stefani N, Pipe JG, Miller JH. Assessment of cerebral blood perfusion reserve with acetazolamide using 3D spiral ASL MRI: Preliminary experience in pediatric patients. Magn Reson Imaging, 2017 ,35:132-140.
[34] Zeng Q, Jiang B, Shi F, et al. 3D Pseudocontinuous arterial spin-labeling MR imaging in the preoperative evaluation of gliomas. AJNR Am J Neuroradiol, 2017,38(10):1876-1883.
[35] Christina Andica , Koji Kamagata , Taku Hatano , Yuya Saito , Kotaro Ogaki , Nobutaka Hattori , Shigeki Aoki . MR Biomarkers of Degenerative Brain Disorders Derived From Diffusion Imaging. J Magn Reson Imaging. 2020,52(6):1620-1636.
[36] Anas Arab, Anna Wojna-Pelczar , Amit Khairnar , Nikoletta Szabó , Jana Ruda-Kucerova. Principles of diffusion kurtosis imaging and its role in early diagnosis of neurodegenerative disorders. Brain Res Bull. 2018 ,139(5):91-98.
[37] Kamagata K, Andica C, Hatano T, Ogawa T, Takeshige-Amano H, Ogaki K, Akashi T, Hagiwara A, Fujita S, Aoki S. Advanced diffusion magnetic resonance imaging in patients with Alzheimer'sand Parkinson's diseases. Neural Regen Res. 2020 ,15(9):1590-1600
[38] Abdalla G, Dixon L, Sanverdi E, Machado PM, Kwong JSW, Panovska-Griffiths J, Rojas-Garcia A, Yoneoka D, Veraart J, Van Cauter S, Abdel-Khalek AM, Settein M, Yousry T, Bisdas S. The diagnostic role of diffusional kurtosis imaging in glioma grading and differentiation of gliomas from other intra-axial brain tumours: a systematic review with critical appraisal and meta-analysis. Neuroradiology. 2020 ,62(7):791-802
Figures
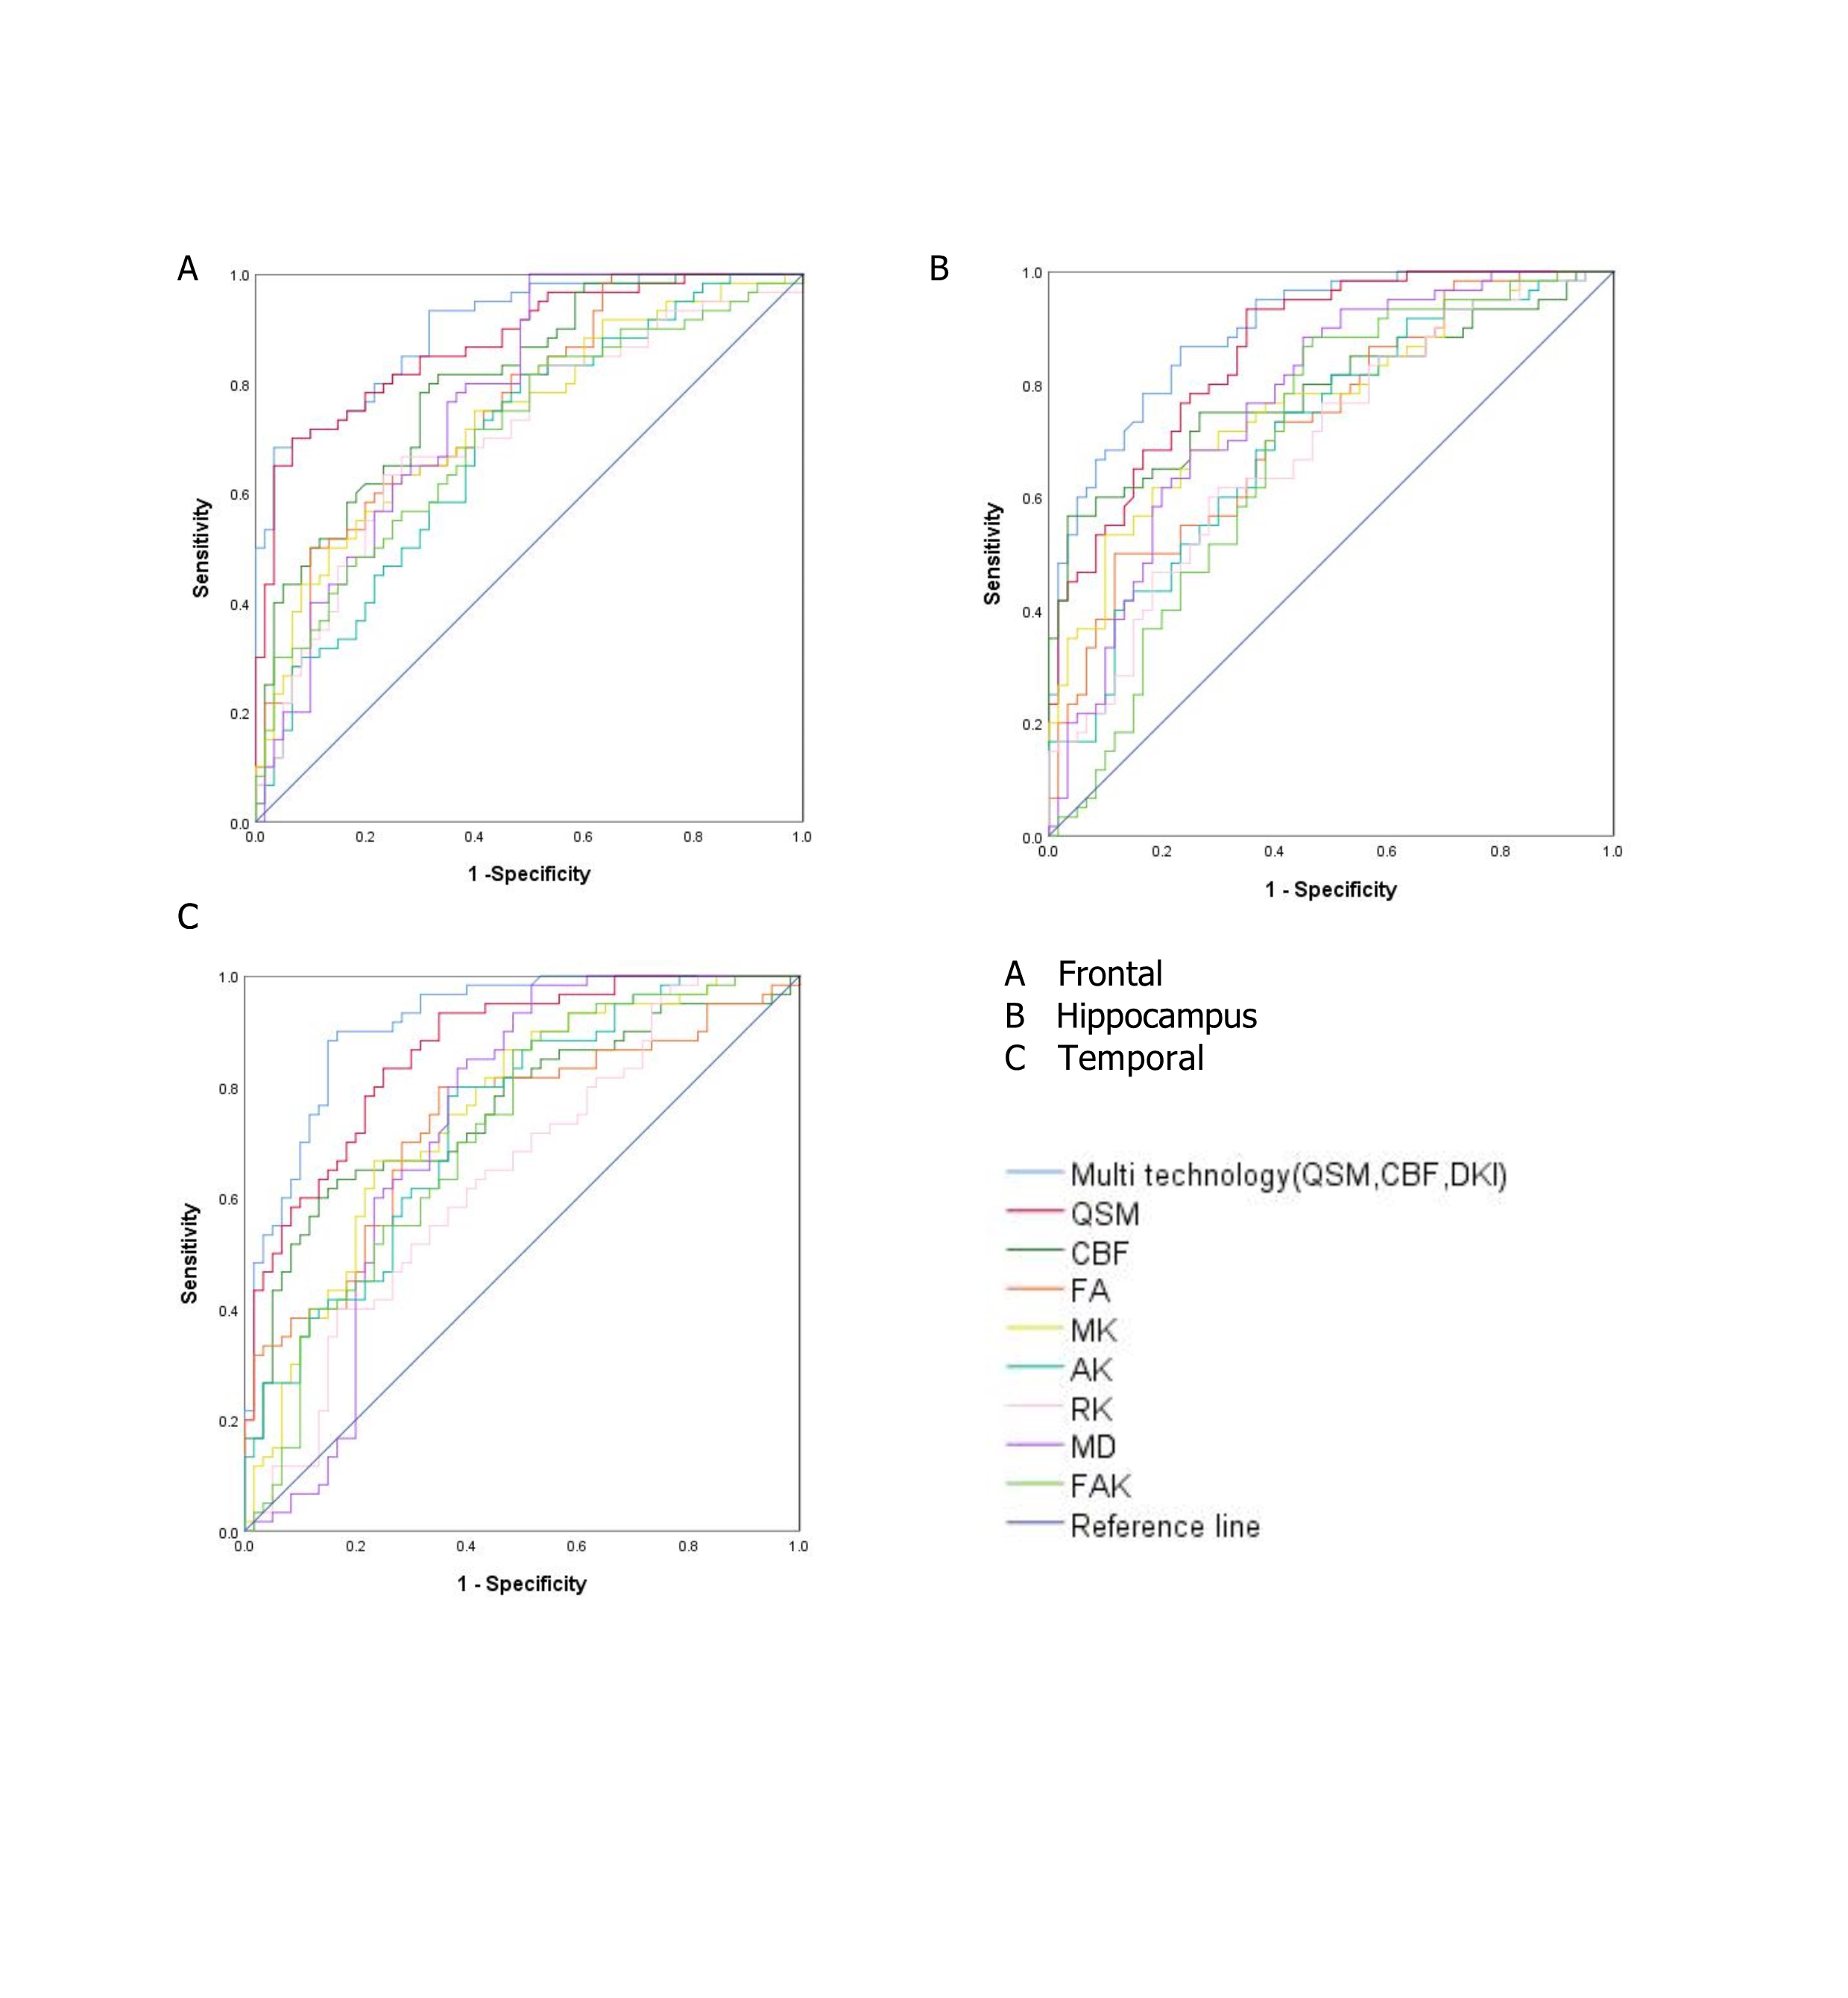
A. ROC curve analysis results of QSM, CBF , DKI and multimodal technology (QSM, CBF, DKI) values in frontal lobe
B. ROC curve analysis results of QSM, CBF , DKI and multimodal technology (QSM, CBF, DKI) values in hippocampus
C. ROC curve analysis results of QSM, CBF , DKI and multimodal technology (QSM, CBF, DKI) values in temporal lobe