2998
Machine Learning based Structural and Diffusion MRI to Identify Suicide Risk in Depressed Patients1Huaxi MR Research Center (HMRRC), Department of Radiology, West China Hospital of Sichuan Universit, Chengdu, China, 2Department of Psychiatry, West China Hospital of Sichuan University, Chengdu, China
Synopsis
In this study, we used 5 machine learning algorithms with structural and diffusion MRI to classify suicidal risk in depressed patients and the best performance was acquired by support vector machine. In addition, the most important 10 features were most located in fronto-temporal–parietal regions. This study found a classification model using MRI data can help diagnosis and assess suicidal risk in depressed patients.
Background
Suicide has caused great losses to public health all over the world and patients with major depressive disorder (MDD) have a considerably increased risk of suicide [1, 2]. It is urgent to develop more accurate and objective methods to predict the suicidal risk in depressed patients. Machine learning can identify suicidal risk at the individual level and prevent suicidal behavior in depressed patients.Methods
A total of 141 depressed patients (77 patients without suicidality, DS- and 64 patients with suicidality, DS+) were included. The structural MRI data were processed with the recon-all processing pipeline in FreeSurfer software suite version 6.0.0 (http://surfer.nmr.mgh.harvard.edu) to calculate measures included cortical surface area (CSA), cortical thickness (CT) and cortical volume (CV) according to Desikan-Killiany atlas [3] . In addition, the diffusion MRI data were analyzed using the FSL (FMRIB Software Library) to acquire the fractional anisotropy (FA), mean diffusivity (MD), radial diffusivity (RD) and axial diffusivity (AD) of each fiber track according to the track probability maps [4].A total of 284 features including 204 cortical features of CSA, CT and CV for 68 gray matter regions and 80 diffusion features of FA, MD, AD and RD for 20 white matter fiber tracts were used as an input for machine learning algorithms. All classification modeling was performed with the Python language toolbox scikit-learn (http://scikit-learn.org/stable/index.html) using Python 3 language code. First, we randomly separated data into a group for training/validating the model and a group for model testing at a 7:3 ratio. Then we selected 50 features using the ANOVA f-test, which has been demonstrated to be a practical feature selection method [5]. We probed model performance with 5 modelling algorithms, including logistic regression (LR), SVM, naïve Bayes, extremely randomized trees and random forest (RF). To alleviate the influence of bias data distribution, we used a nested cross-validation approach for model training, in which the training/validating set split was performed 10 times. Each time, the data were separated into a training set (80% of the data) and a validation set (20% of the data). For each model, we tuned the hyperparameters using a 5-fold cross-validated grid search on the training set and then evaluated the model using the selected hyperparameters on the test set.
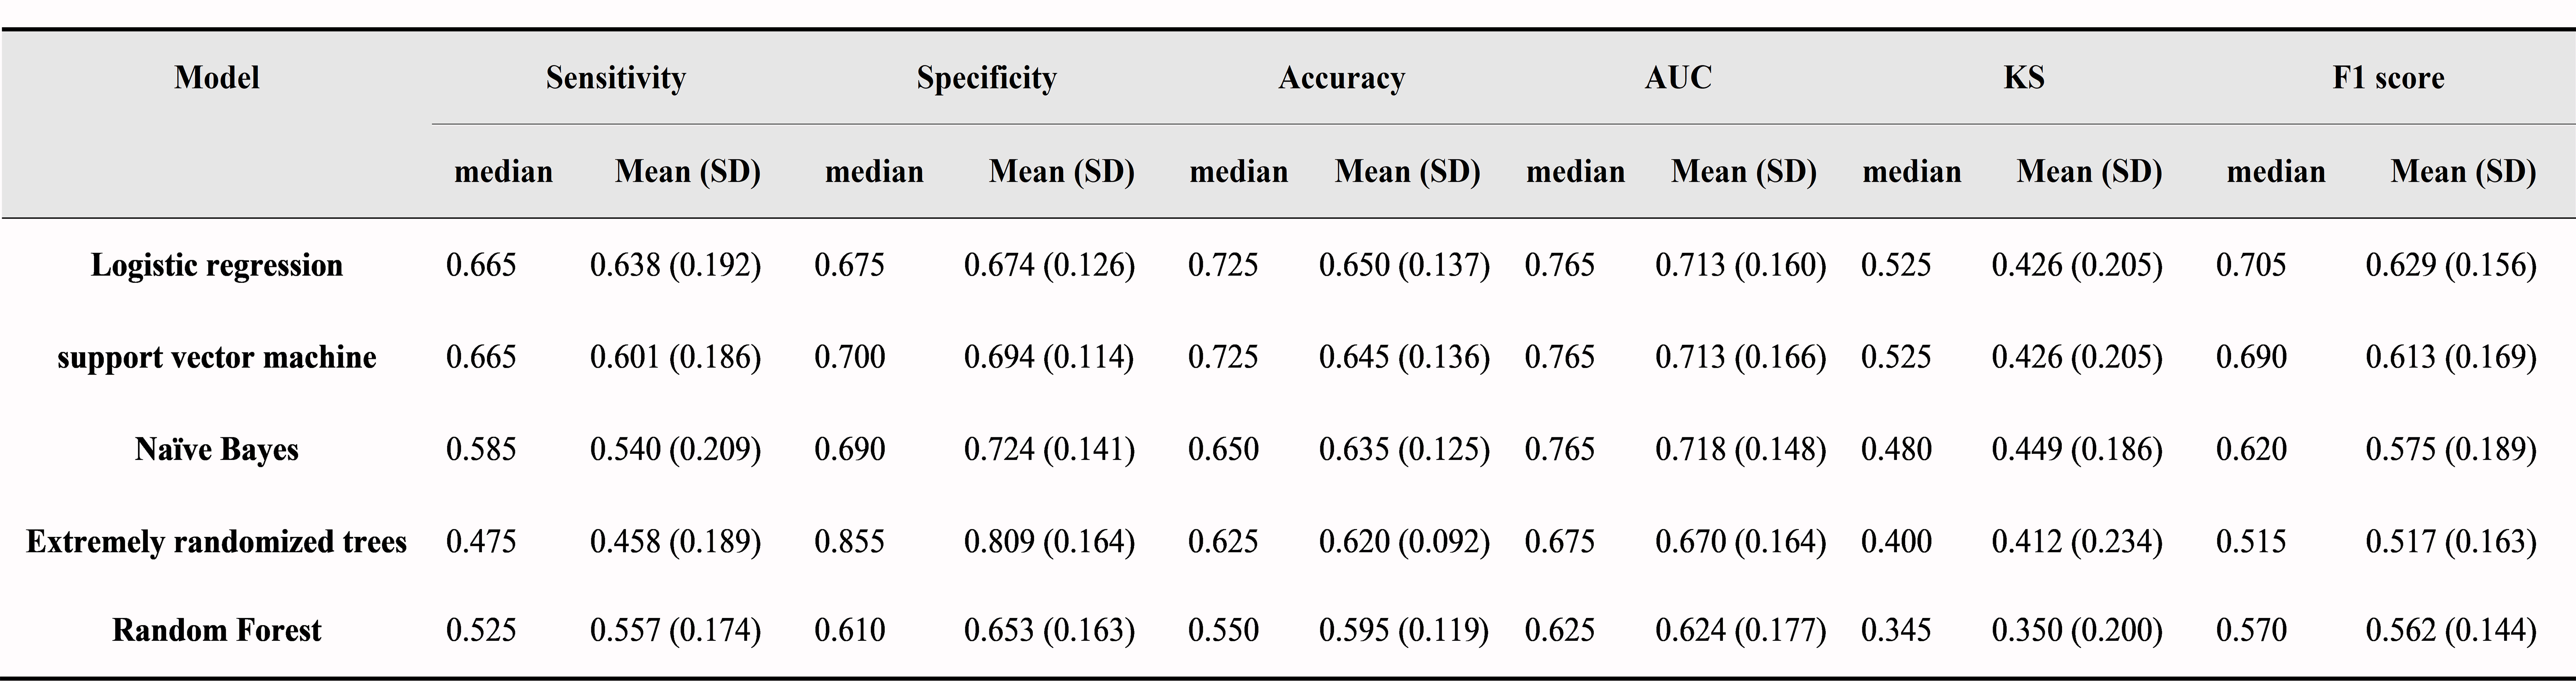
The metrics chosen for the final evaluation were sensitivity, specificity, accuracy, the area under the curve (AUC), Kolmogorov-Smirnov score and F1 score. We selected the algorithm which has the maximum median accuracy score as the best algorithm for suicide risk prediction. To test the selected algorithm, we used the independent data set assigned randomly at the first step, which contained 42 samples (17 DS+). We tested the trained model on the independent data set and generated the prediction result, the receiver operating characteristic (ROC) curve and the precision-recall curve for analysis. To analyze the contribution of each feature for the suicide risk prediction, we used the sum of the importance scores of the features from the 10 iterations for the final importance evaluation.
Results
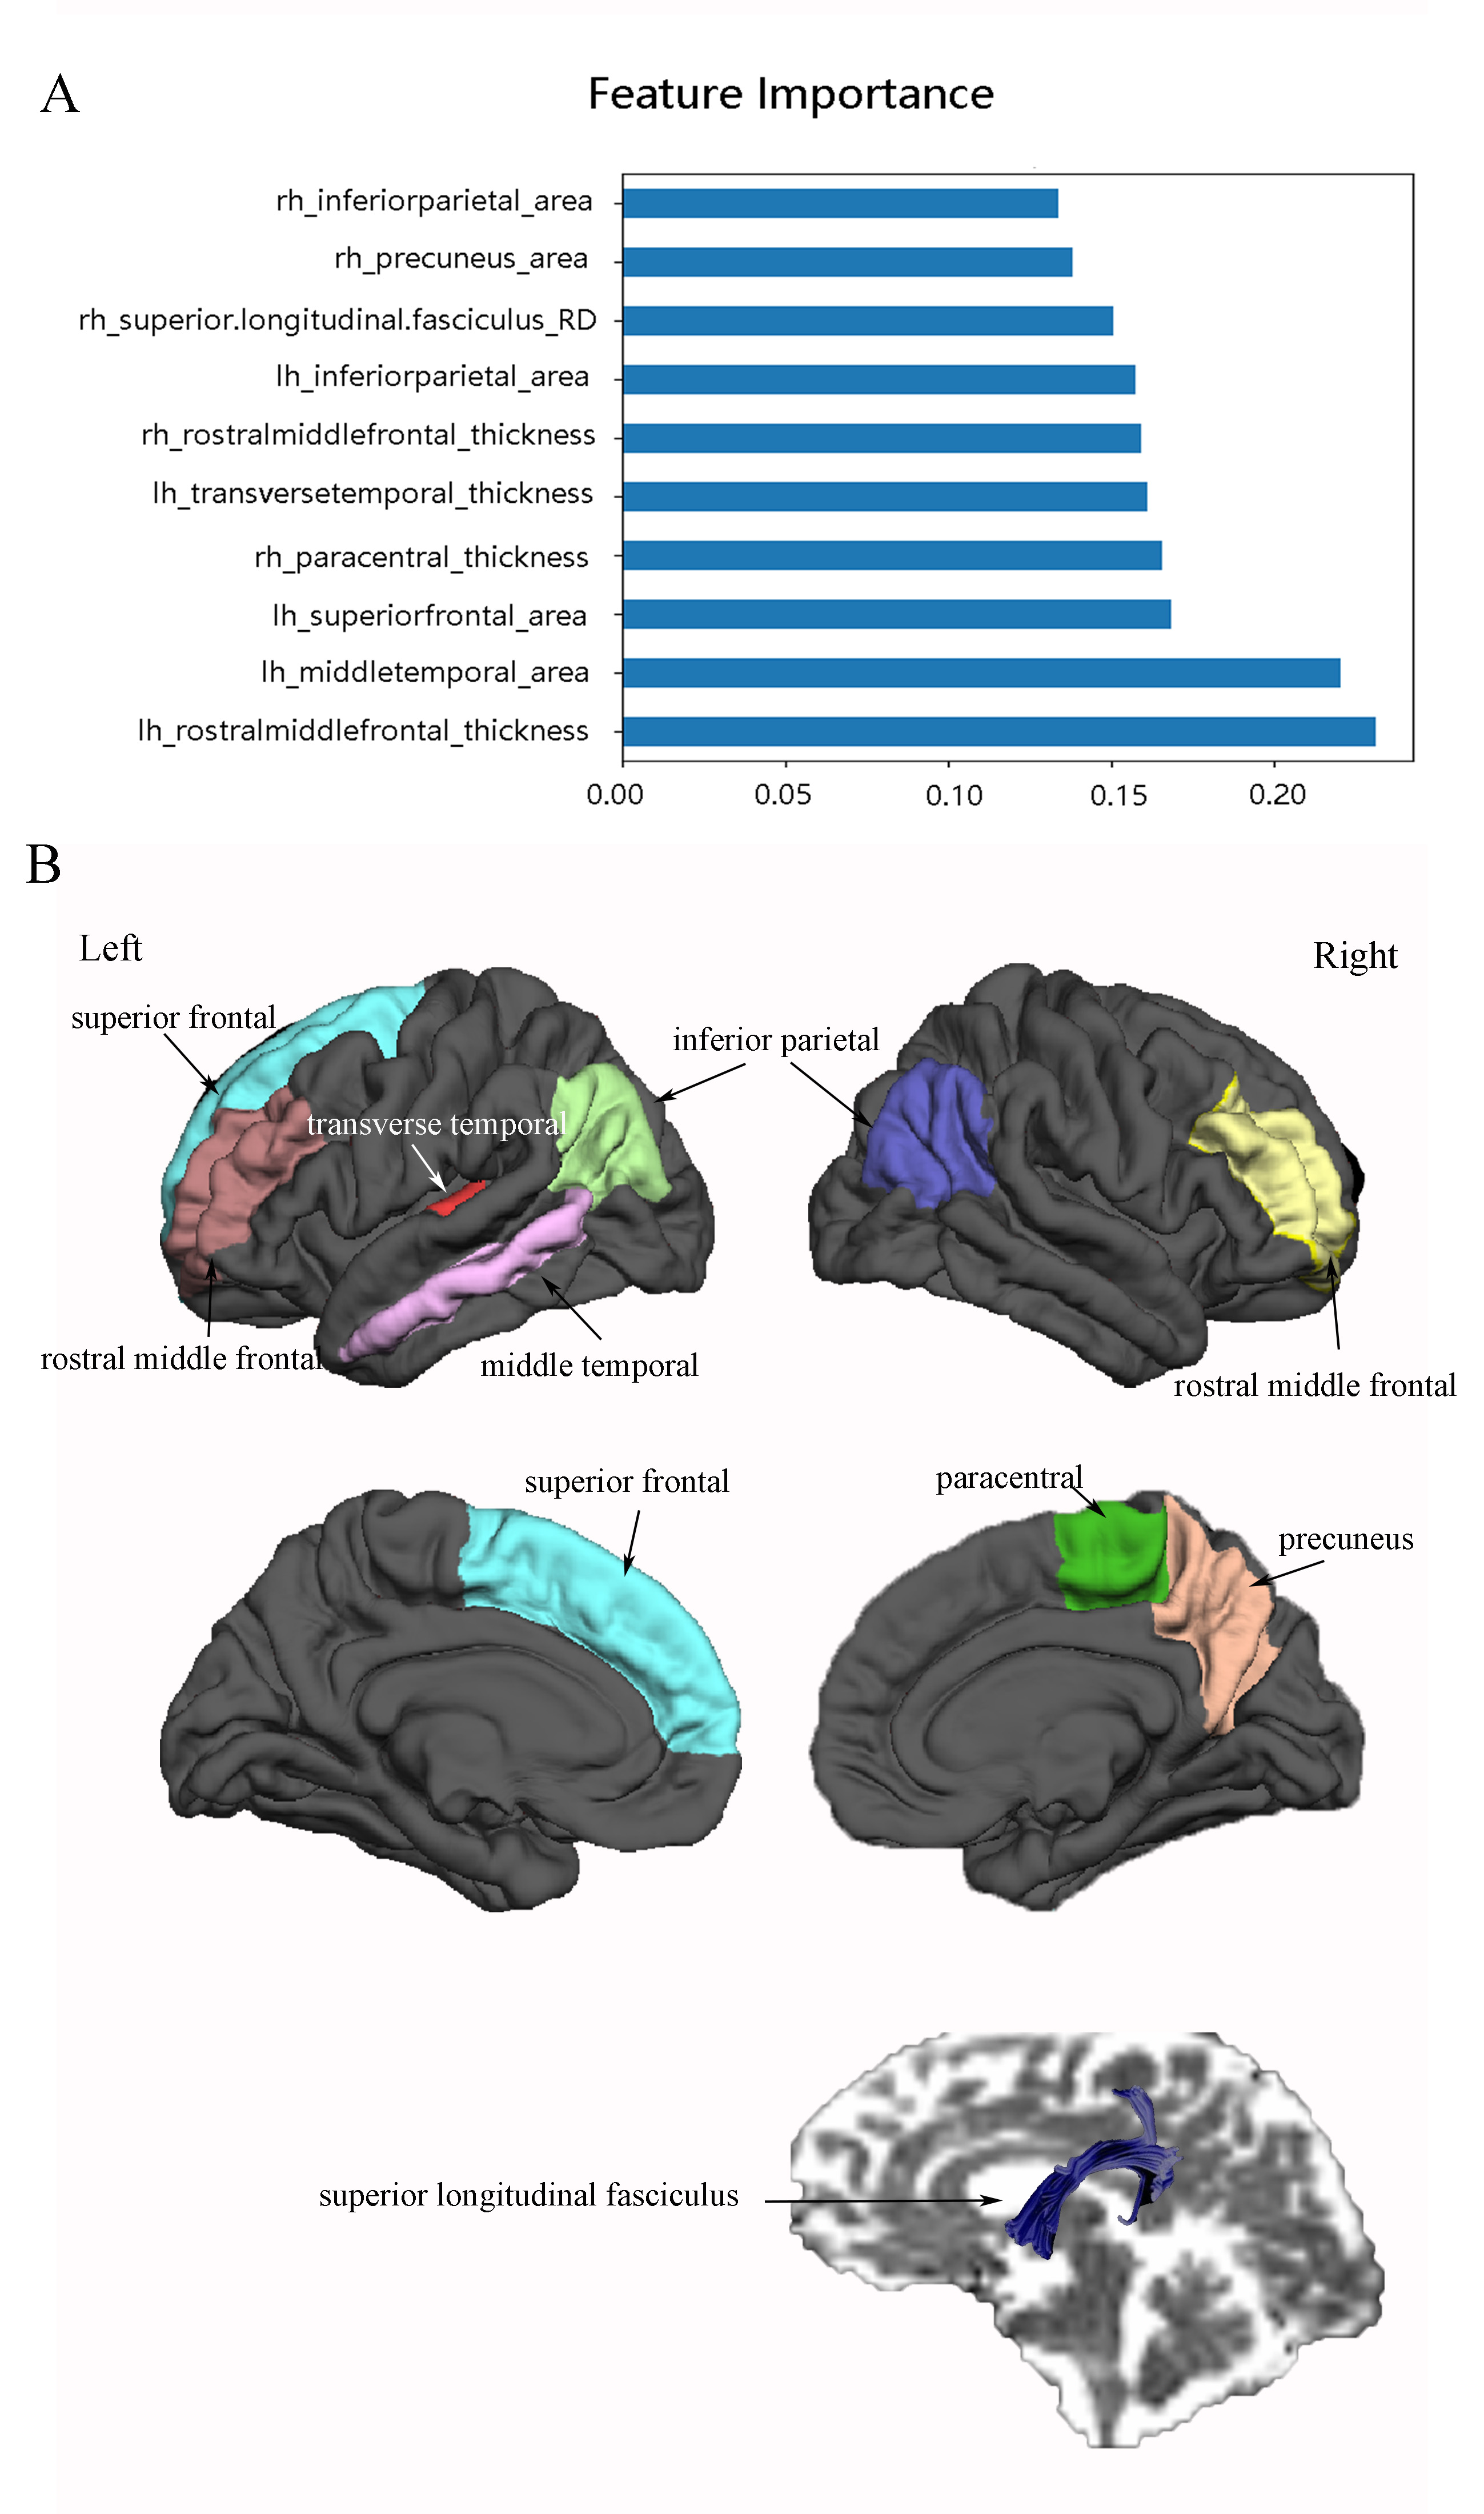
The results of the modelling algorithms are shown in Figure 2 and Table 1. According to the model comparison, both SVM and LR exhibited the best performance with the highest median accuracy score of 0.725 among the 5 modelling algorithms. With the independent test data, the validation metrics of the best models (SVM and LR) were as follows: LR: sensitivity=0.83; specificity=0.58; accuracy=0.69; AUC=0.85; KS=0.50; F1 Score=0.70; SVM: sensitivity=0.83; specificity=0.71; accuracy=0.76; AUC=0.86; KS=0.60; F1 Score=0.75. The ROC curves and precision-recall curves for SVM and LR are shown in Figure 3. Therefore, SVM was chosen as the best model in our current study. The most important 10 features were shown in Figure 4, which included the thickness of the bilateral middle frontal gyrus, right paracentral lobule and left transverse temporal gyrus, the area of the bilateral inferior parietal gyrus, the left middle temporal gyrus, left superior frontal gyrus and right precuneus, and the RD of the right superior longitudinal fasciculus.Conclusion
Our finding suggested it is possible to use machine learning algorithm with structural and diffusion MRI to reliably classify suicidal risk in depressed patients and the most important features were located in fronto-temporal-parietal regions. We can develop a classification model using MRI data to help diagnosis and assess suicidal risk in depressed patients.Acknowledgements
We thank the patients and volunteers for participating in this study. This study was supported by the National Natural Science Foundation (Grant Nos. 81971595, 81771812, 81621003 and 81820108018), the 1·3·5 Project for Disciplines of Excellence–Clinical Research Incubation Project, West China Hospital, Sichuan University (Grant No. 2020HXFH005) and the Department of Science and Technology of Sichuan Province (No. 2020YFS0118).References
1. Bostwick, J.M. and V.S. Pankratz, Affective disorders and suicide risk: a reexamination. Am J Psychiatry, 2000. 157(12): p. 1925-32.
2. Coryell, W. and E.A. Young, Clinical predictors of suicide in primary major depressive disorder. J Clin Psychiatry, 2005. 66(4): p. 412-7.
3. Desikan, R.S., et al., An automated labeling system for subdividing the human cerebral cortex on MRI scans into gyral based regions of interest. NeuroImage, 2006. 31(3): p. 968-980.
4. Hua, K., et al., Tract probability maps in stereotaxic spaces: analyses of white matter anatomy and tract-specific quantification. Neuroimage, 2008. 39(1): p. 336-47.
5. Zhuang Han, Liu X, Wang Hui, et al.(2021) Diagnosis of early stage Parkinson's disase on quantitative susceptibility mapping using complex network with one-way ANOVA F-test feature selection. J Mech Med Biol.21:2140026.
Figures
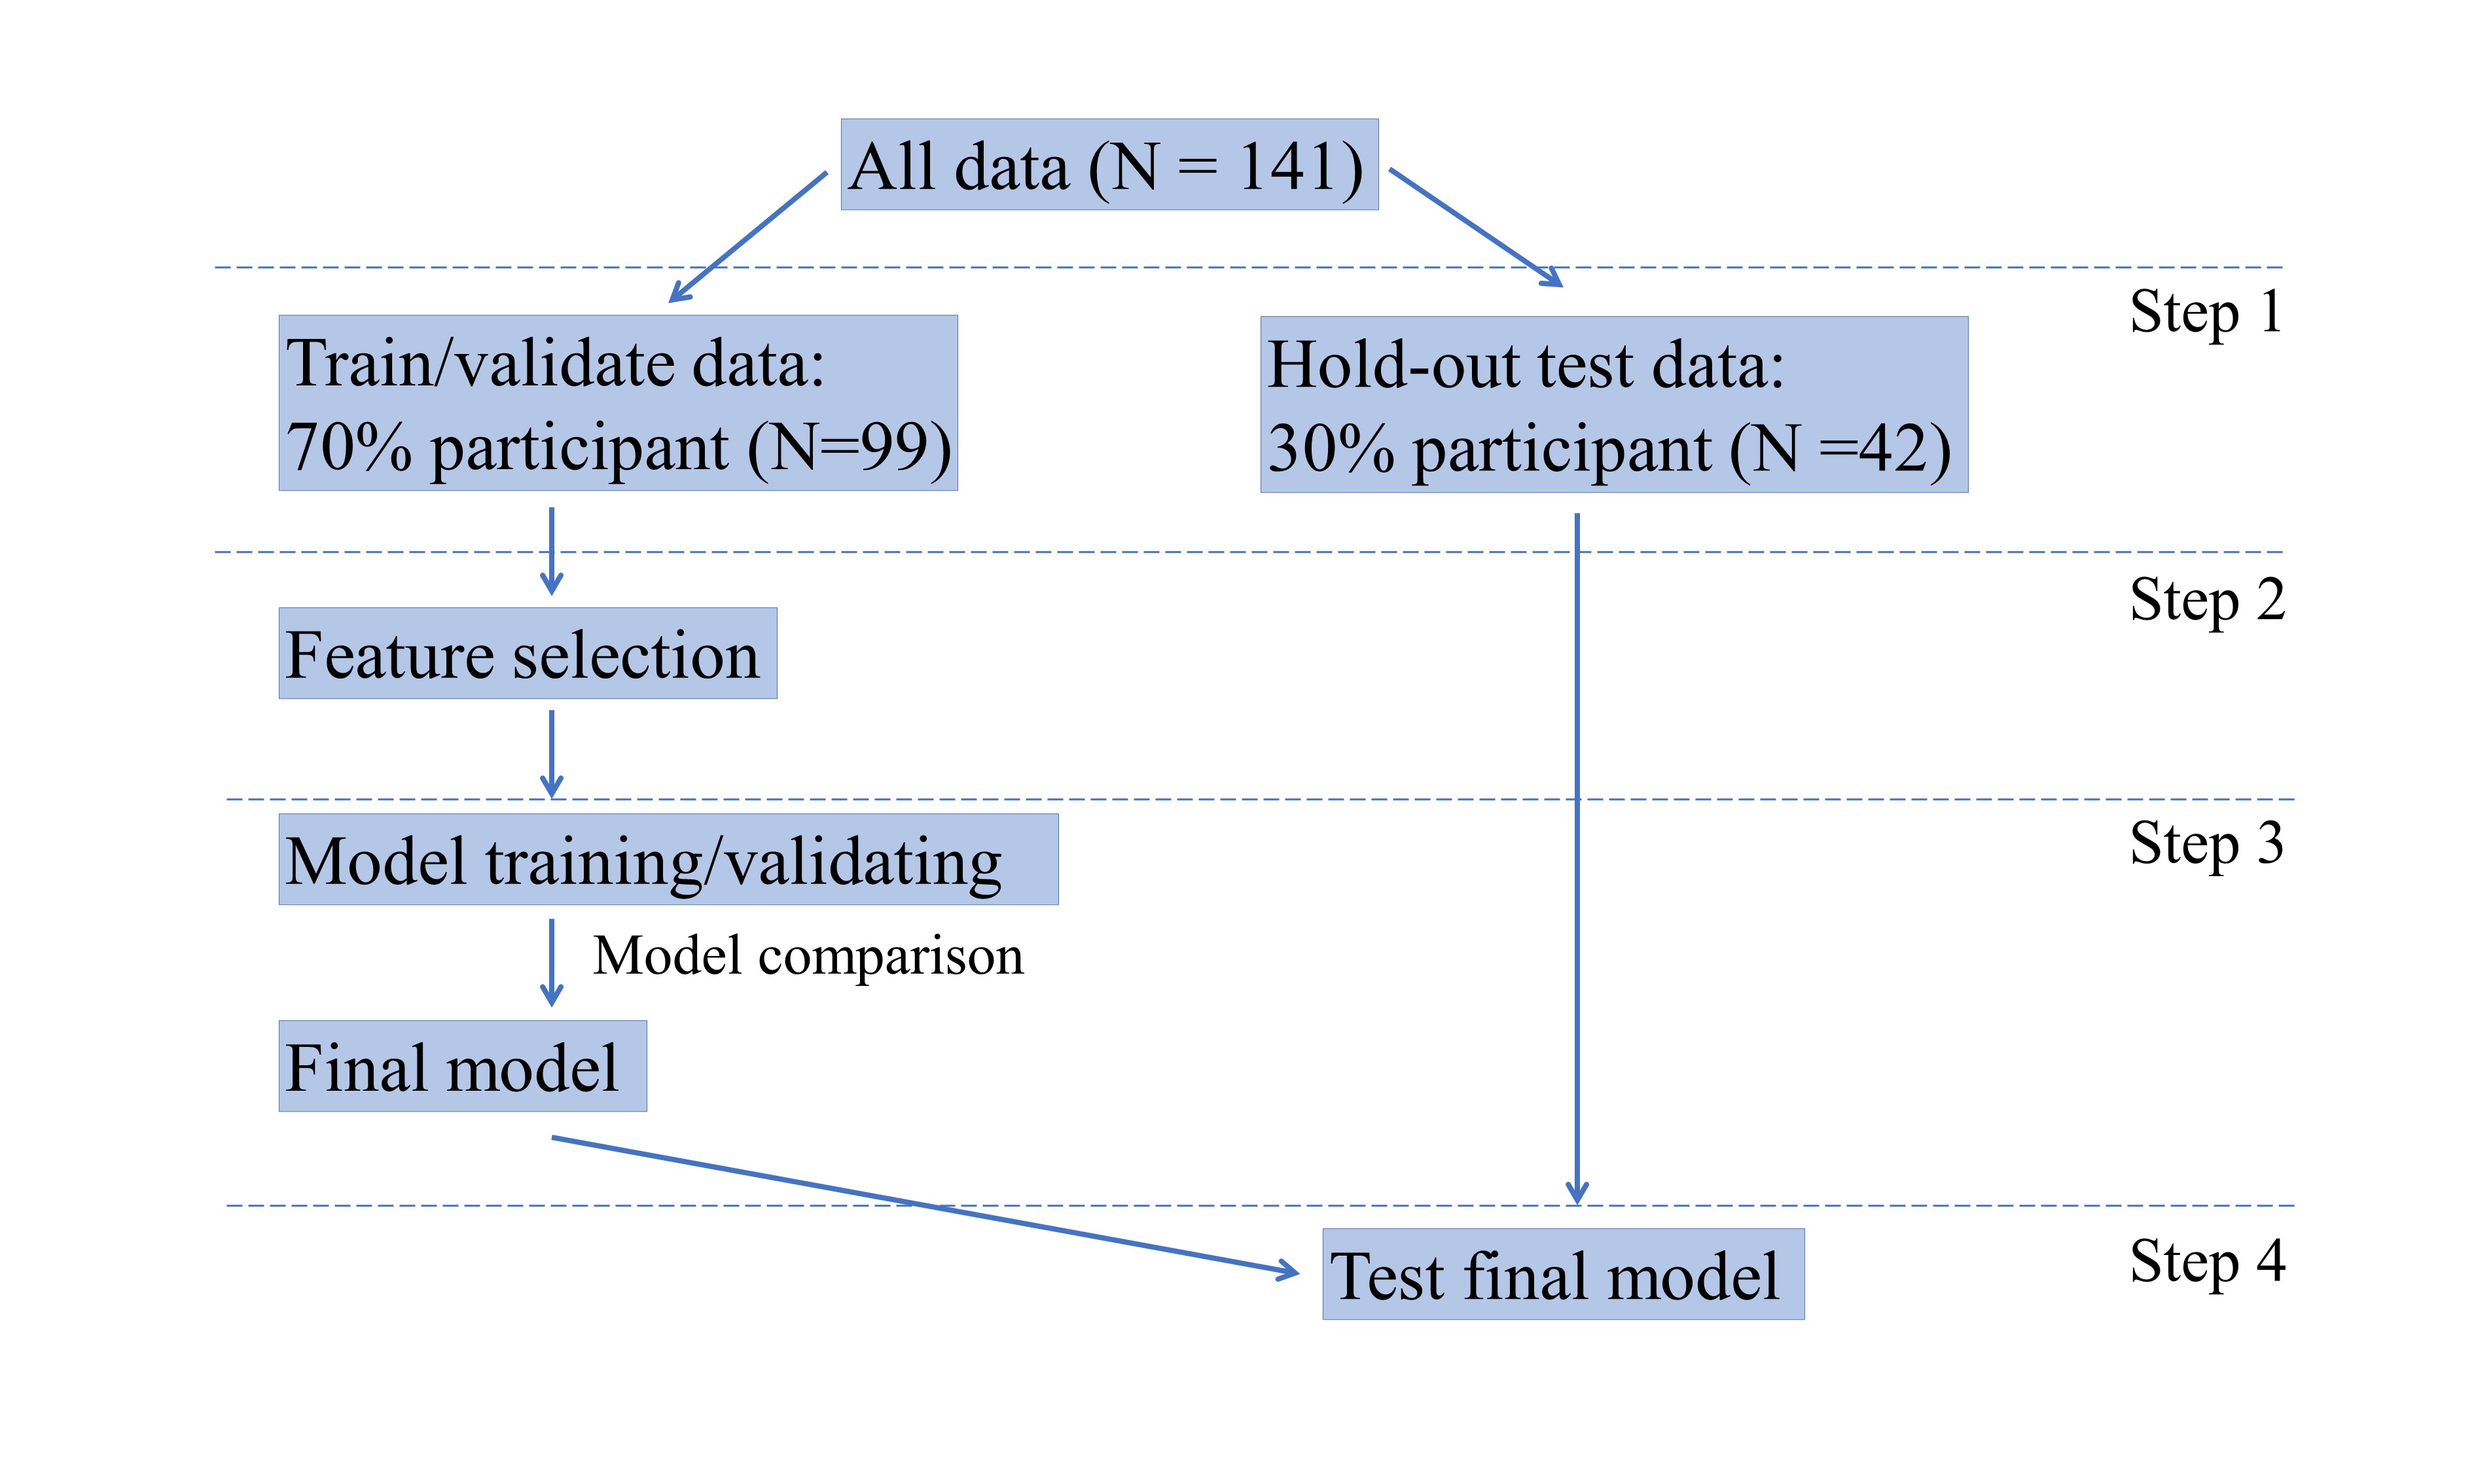
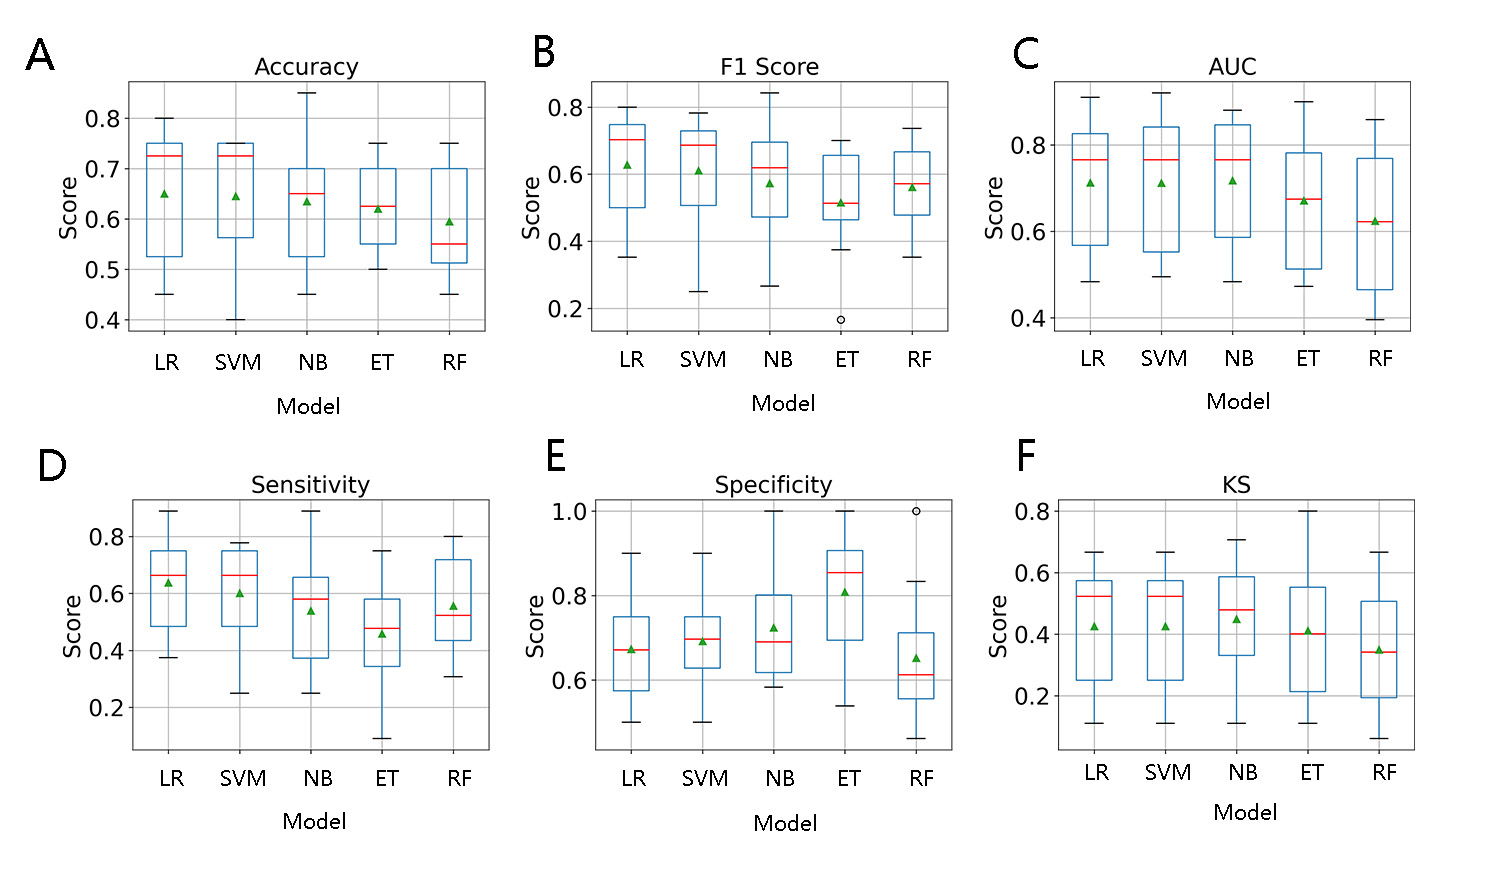
Figure 2. Comparison box plots of 5 modelling algorithms.
The red line represents the median and the green triangle represents the mean value.
Abbreviations: LR: logistic regression; SVM: support vector machine; NB: naïve Bayes; ET: extremely randomized trees; RF: random forest.
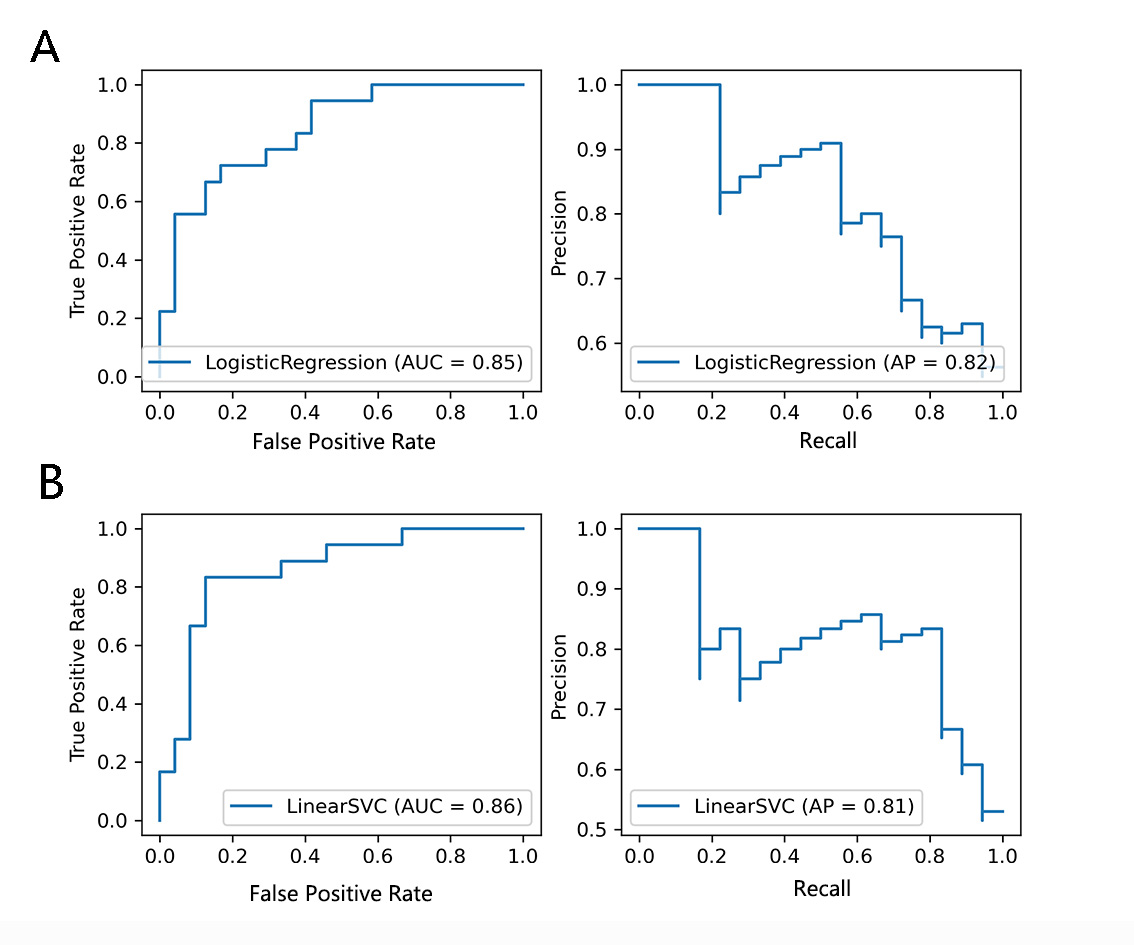
Figure 3. The ROC curve and Precision-Recall curve of SVM and LR in independent test data set.
Abbreviations: LR: logistic regression; LinearSVC: support vector machine.