2997
Correlation between hippocampal subfields volume and white matter hyperintensity in patients with type 2 diabetes mellitus
Yangyingqiu Liu1, Weiwei Wang1, Yuhan Jiang1, Ailian Liu1, and Yanwei Miao1
1Department of Radiology, First Affiliated Hospital of Dalian Medical University, Dalian, China
1Department of Radiology, First Affiliated Hospital of Dalian Medical University, Dalian, China
Synopsis
Volume of hippocampal subfields in patients with type 2 diabetes mellitus(T2DM) was quantitatively assessed, and its’correlation to white matter hyperintensity (WMH) grade was also analyzed. The results show that the severity of WMH in T2DM patients may affect the atrophy of hippocampal subfields.
Purpose
To analyze the correlation between hippocampal subfields volume and white matter hyperintensity (WMH) in patients with type 2 diabetes mellitus(T2DM).Materials and methods
Participants were recruited from the First Affiliated Hospital of Dalian Medical University. Thirty-seven patients with clinically confirmed T2DM (T2DM group) and 26 healthy control subjects (HC group) were recruited. The diagnosis of T2DM was made according to the 2019 American Diabetes Association standards. The routine MRI sequence, 3D-T1WI, T2WI, T2 FLAIR, and SWI sequence were performed using the Philips Ingenia CX 3.0T MRI scanner with 32-channel head coil. According to the WMH scale proposed by Fazekas, the periventricular hyperintensity (PVH) and deep white matter hyperintensity (DWMH) of all subjects were graded from 0 to 3 respectively.FreeSurfer 6.0 was used to process subfield hippocampal volumes, 12 subfields was automatically segmented of hippocampus, included hippocampal tail, subiculum, CA1, hippocampal fissure, presubiculum, parasubiculum, molecular layer of hippocampus; granule cell and molecular layer of the DG (GC-ML-DG), CA3, CA4, fimbria, hippocampus amygdala transition area (HATA). And the whole volume of the bilateral hippocampi also obtained. The estimated total intracranial volume (eTIV) was used to calculate the standardized subfield hippocampal volumes, in order to reduce the influence of individual variation.
Data analyses were performed using R version 4.0.0. Independent-samples t-test (for normally distributed data) or Mann-Whitney U test (for non-normally distributed data) was used to compare the subfield hippocampal volume between T2DM group and HC group. Spearman correlation analysis was performed on the hippocampal subfields volume and the PVH grade and DWMH grade. p < 0.05 was considered statistically significant.
Results
The volume of hippocampal subfields had a reduction trend in T2DM group. The volumes of left CA1 was decreased significantly in the T2DM group (604.65±70.56 mm3) compared to HC group(645.45±75.07 mm3) (p=0.033). The correlation analysis results between the volume of hippocampal subfields and PVH grade and DWMH grade were represented by heat maps (Figure 1). The volume of bilateral subiculum(rL = -0.350, p = 0.001; rR = -0.370, p < 0.001 ), bilateral CA1(rL = -0.312, p = 0.004; rR = -0.321, p = 0.003 ), bilateral molecular layer HP(rL = -0.416, p < 0.001; rR = -0.405, p < 0.001 ), bilateral GC-ML-DG(rL = -0.385, p < 0.001; rR = -0.407, p < 0.001 ), bilateral CA3(rL = -0.318, p = 0.003; rR = -0.322, p = 0.003 ), bilateral CA4(rL = -0.362, p = 0.001; rR = -0.378, p < 0.001 ), bilateral whole hippocampus(rL = -0.393, p < 0.001; rR = -0.378, p < 0.001 ), left presubiculum(r = -0.340, p = 0.001 ) were all negatively correlated with the PVH grade.The volume of bilateral subiculum(rL = -0.364, p = 0.001; rR = -0.320, p = 0.003), bilateral GC-ML-DG (rL = -0.316, p = 0.003; rR = -0.368, p = 0.001), bilateral whole hippocampus(rL = -0.315, p = 0.003; rR = -0.342, p = 0.001), left presubiculum(r = -0.318, p = 0.003), right molecular layer HP(r = -0.359, p = 0.001), right CA4(r = -0.341, p = 0.001) were all negatively correlated with the DWMH grade.Discussion and Conclusion
WMH is an imaging biomarker of CSVD. And CSVD is often accompanied by the loss of neurons in hippocampal, resulting in hippocampal atrophy. In this study, it was found that the volume of left CA1 was decreased in the patients with T2DM. There was a negative correlation between the volume of hippocampal subfields and WMH grade, in other words, the more serious the white matter lesions, the higher the atrophy degree of hippocampal subfields in patients with T2DM. It is indicated that more serious the WMH, the more severe hippocampal subfields atrophy in T2DM patients.To conclude, atrophy of hippocampal subfields may be associated with WMH in T2DM patients.
Acknowledgements
No acknowledgement found.References
No reference found.Figures
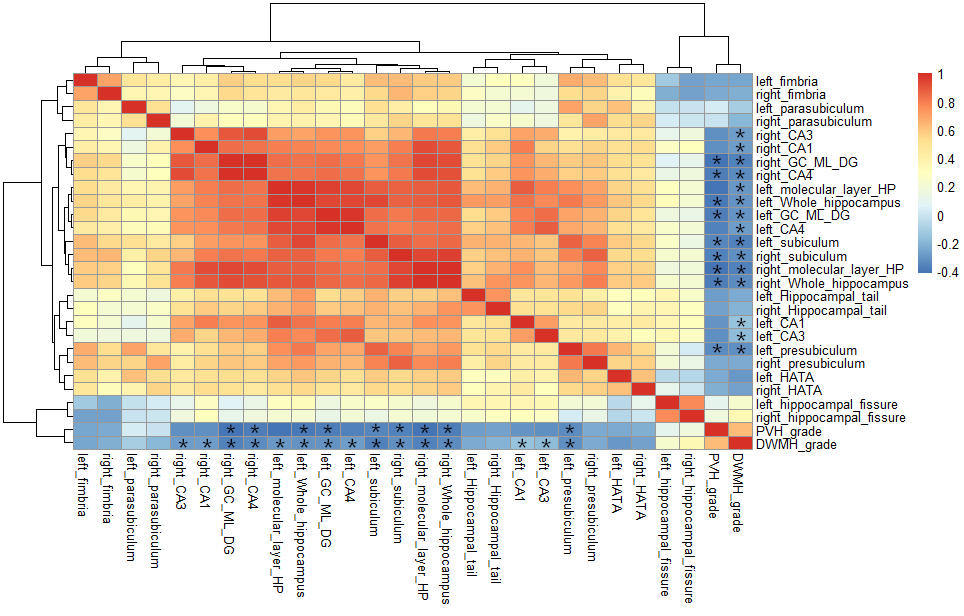
Heat map showing the correlation analysis between volume
of hippocampal subfields and PVH and DWMH grade in patients with T2DM. PVH= periventricular
hyperintensity, DWMH= deep white matter hyperintensity, T2DM = type 2 diabetes
mellitus. *Significant correlation.
DOI: https://doi.org/10.58530/2022/2997