2996
Lesion assessment in multiple sclerosis using a two-compartment spherical mean technique1Department of Neurology, Medical University of Graz, Graz, Austria
Synopsis
Various diffusion-based approaches were suggested for the characterization of lesional tissue in MS-patients. The multi-compartment spherical mean technique (SMT) has been proposed as a way to investigate microscopic diffusion properties in multiple water compartments. However, the potential of SMT for lesion characterization remains unclear. We investigated diffusion-based SMT properties in active and chronic lesions in 58 MS patients and related them to conventional diffusion tensor imaging (DTI). We found that SMT allows a more specific characterization of MS-lesions than DTI and provide evidence that SMT can be considered as a sensitive and robust measure for myelin content in MS patients.
Introduction
Several approaches have been suggested to characterize the microstructure of MS lesions and to get more detailed insights into lesion pathology, including relaxation time mapping, myelin water imaging and quantitative magnetization transfer, however, their specificity and applicability remain limited.1, 2Diffusion tensor imaging (DTI) is a well-established approach to assess microstructural tissue changes, but the conventional tensor model cannot properly consider the compartmentalization of tissue water.3, 4 Recently, the multi-compartment diffusion-based spherical mean technique (SMT) was proposed to study orientation independent diffusion characteristics and to assess intra and extra-axonal water mobility.5 More recent studies suggest that SMT is more sensitive to pathological changes in the brain of patients with multiple sclerosis (MS), compared to DTI. 6–8 However, the potential of SMT to explore different types of MS lesions haven’t been fully explored.
In this study, we investigate diffusion-based SMT properties in different types of MS lesions, including active and chronic lesions and related them to conventional DTI metrics.
Methods
In this retrospective study, we included 58 patients with MS, 29 of them (mean age 36.7 years; male/female: 5/24; MS/RIS/PPMS/RRMS: 5/1/1/22; mean EDSS 0.983 (0-3.5)) had one or more active lesions, and 29 had no active lesions and were matched by EDSS score to the first group (mean age 38.7 years; male/female: 13/16; MS/RIS/PPMS/RRMS: 6/2/1/20; mean EDSS 0.983 (0-3.5)).MRI was performed on a 3T system (Prisma, Siemens Healthineers) with a 20-channel head coil for signal reception. A diffusion weighted EPI sequence with 1.5 mm isotropic resolution was acquired with reversed phase-encode blips and 97 diffusion directions distributed over 3 shells. MRI further included a T2w fluid-attenuated inversion recovery sequence and a T1w magnetization-prepared rapid gradient-echo following the administered Gadolinium.
Susceptibility induced off-resonance fields and distortions were corrected with FSL TOPUP (FSL, version 6; https://fsl.fmrib.ox.ac.uk). Eddy current artefacts were corrected with FSL eddy_cuda.
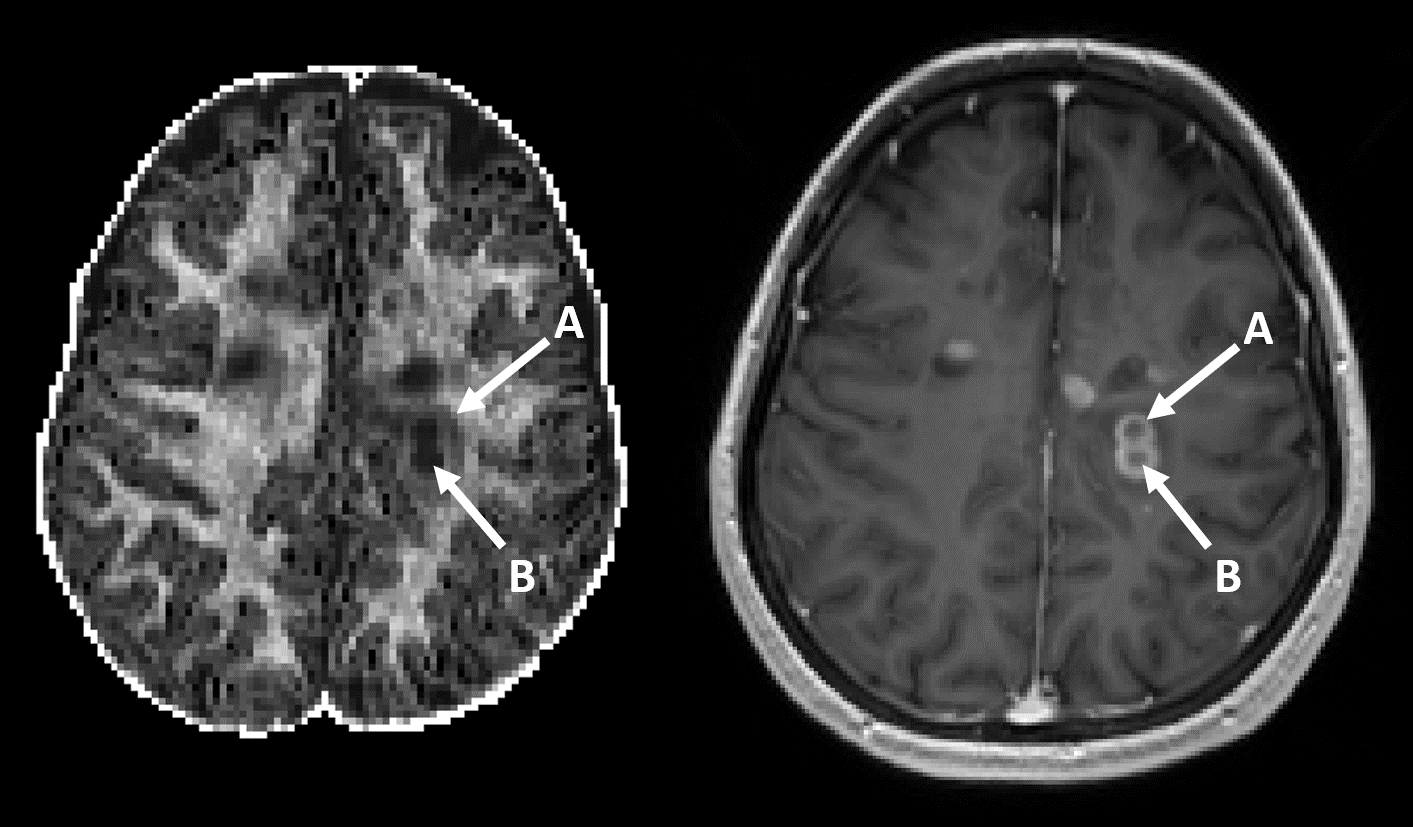
T2 lesion masks were generated with the Lesion Segmentation Toolbox (version 2.0.15; http://www.applied-statistics.de/lst.html) 9, from synthetic T1w and FLAIR images. White matter was segmented with FreeSurfer (version 7.1.1; freely available online https://surfer.nmr.mgh.harvard.edu) and normal appearing white matter (NAWM) masks were derived after subtracting T2 lesion masks. Active lesions were defined as T1 positive lesions on the T1w MPRAGE images and were categorized into dense enhancing and ring enhancing (chronic active).
Microscopic diffusion parameters in lesions and NAWM were obtained with freely available SMT fitting routines (https://github.com/ekaden/smt) 3. We focused on the intra-neurite volume fraction ($$$v_{in}$$$), which reflects the ratio of intra- to extra-axonal space and which is considered as a measure of myelin content. Additionally, Fractional Anisotropy (FA) and Mean Diffusivities (MD) in lesions and NAWM were assessed with FSL dtifit. Differences between diffusion properties in different lesion types were tested with a student t test.
Results
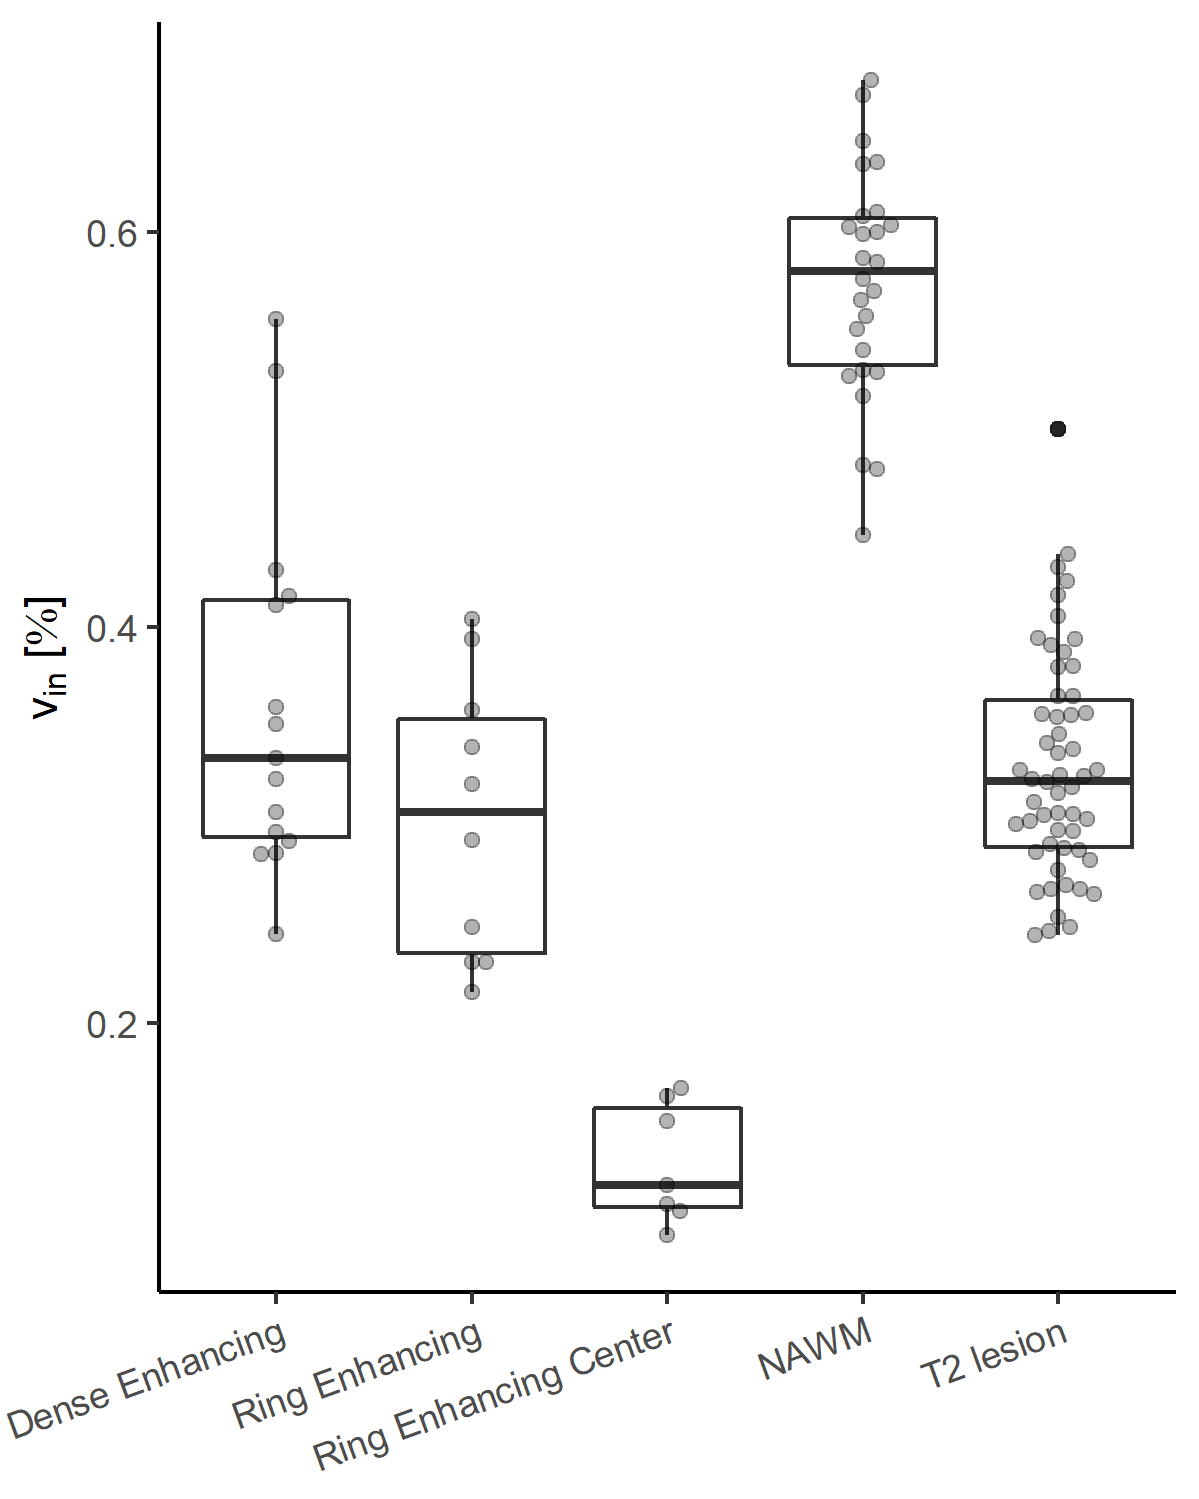
The results of this study are summarized in Figure 1. Overall, we have analyzed dense enhancing, ring enhancing and the center of ring enhancing lesions and related them to NAWM and chronic T2 lesions. NAWM provided the highest $$$v_{in}$$$. Compared to NAWM, the lowest $$$v_{in}$$$ was found in the center of ring-enhancing lesions, followed by the edge of ring enhancing, and dense lesions. Chronic T2 lesions showed a reduced $$$v_{in}$$$ compared to dense enhancing lesions. In contrast, FA and MD derived from conventional DTI allowed no separation between T2 lesions and dense or ring enhancing lesions.Discussion
When considering $$$v_{in}$$$ as a measure of the degree of myelination in brain tissue, significant demyelination can be observed in all types of lesions with the core of chronic active lesions showing the most severe tissue destruction. Acute lesions show a similar level of demyelination as chronic lesions suggesting that blood-brain barrier break down and acute inflammation may cause a similar level of myelin degradation. Interestingly, the active ring of ring enhancing lesions showed even more severe degradation which could hint at a more aggressive disease activity in chronic active lesions. Further insights are expected from following up these lesions in a longitudinal setting.Conclusion
In contrast to conventional DTI based metrics, SMT allows for a more specific characterization of MS lesions, which is also in agreement with previous histopathological findings. While further studies are warranted, our results provide further evidence that $$$v_{in}$$$ can be considered as a sensitive and robust measure for myelin content in MS patients.Acknowledgements
References
1. Laule, C., Leung, E., Lis, D. K. B., Traboulsee, A. L., Paty, D. W., MacKay, A. L., and Moore, G. R. W., “Myelin water imaging in multiple sclerosis: quantitative correlations with histopathology,” Multiple sclerosis (Houndmills, Basingstoke, England), V. 12, No. 6, 2006, pp. 747–753.
2. Schmierer, K., Tozer, D. J., Scaravilli, F., Altmann, D. R., Barker, G. J., Tofts, P. S., and Miller, D. H., “Quantitative magnetization transfer imaging in postmortem multiple sclerosis brain,” Journal of magnetic resonance imaging : JMRI, V. 26, No. 1, 2007, pp. 41–51.
3. Kaden, E., Kelm, N. D., Carson, R. P., Does, M. D., and Alexander, D. C., “Multi-compartment microscopic diffusion imaging,” NeuroImage, V. 139, 2016, pp. 346–359.
4. Johnson, D., Ricciardi, A., Brownlee, W., Kanber, B., Prados, F., Collorone, S., Kaden, E., Toosy, A., Alexander, D. C., Gandini Wheeler-Kingshott, C. A. M., Ciccarelli, O., and Grussu, F., “Comparison of Neurite Orientation Dispersion and Density Imaging and Two-Compartment Spherical Mean Technique Parameter Maps in Multiple Sclerosis,” Frontiers in neurology, V. 12, 2021, p. 662855.
5. Kaden, E., Kruggel, F., and Alexander, D. C., “Quantitative mapping of the per-axon diffusion coefficients in brain white matter,” Magnetic resonance in medicine, V. 75, No. 4, 2016, pp. 1752–1763.
6. Lakhani, D. A., Schilling, K. G., Xu, J., and Bagnato, F., “Advanced Multicompartment Diffusion MRI Models and Their Application in Multiple Sclerosis,” AJNR. American journal of neuroradiology, V. 41, No. 5, 2020, pp. 751–757.
7. Martínez-Heras, E., Solana, E., Prados, F., Andorrà, M., Solanes, A., López-Soley, E., Montejo, C., Pulido-Valdeolivas, I., Alba-Arbalat, S., Sola-Valls, N., Sepúlveda, M., Blanco, Y., Saiz, A., Radua, J., and Llufriu, S., “Characterization of multiple sclerosis lesions with distinct clinical correlates through quantitative diffusion MRI,” NeuroImage. Clinical, V. 28, 2020, p. 102411.
8. Bagnato, F., Franco, G., Li, H., Kaden, E., Ye, F., Fan, R., Chen, A., Alexander, D. C., Smith, S. A., Dortch, R., and Xu, J., “Probing axons using multi-compartmental diffusion in multiple sclerosis,” Annals of clinical and translational neurology, V. 6, No. 9, 2019, pp. 1595–1605.
9. Schmidt, P., Gaser, C., Arsic, M., Buck, D., Förschler, A., Berthele, A., Hoshi, M., Ilg, R., Schmid, V. J., Zimmer, C., Hemmer, B., and Mühlau, M., “An automated tool for detection of FLAIR-hyperintense white-matter lesions in Multiple Sclerosis,” NeuroImage, V. 59, No. 4, 2012, pp. 3774–3783.
Figures