2991
Auditory functional MRI in the conventional pig at 1.5T1ENT, CHU of Rennes, Rennes, France, 2INSERM, MediCIS, University Rennes 1, Rennes, France, 3INRAE, NuMeCan 1341, University Rennes 1, Rennes, France, 4PRISM, CNRS, INSERM, BIOSIT, Univ Rennes, Rennes, France, 5School of audioprosthesis of Fougères, Université Rennes 1, Fougères, France, 6INSERM, LTSI UMR 1099, University Rennes 1, Rennes, France
Synopsis
This work presents a functional MRI model to study the activation of central auditory pathways in a pig model at 1.5T. The conventional pig is a good model due to its anatomical similarity to humans, and therefore could be relevant to study and understand brain responses to auditory stimulations.
INTRODUCTION
Rehabilitation of severe to profound deafness involves cochlear implants. Some patients with residual hearing can benefit from electro-acoustic implants that preserve natural acoustic function and electrically stimulates the deficient frequencies1. No data is available about the activation of central auditory pathways. This study aims to validate a functional MRI 1.5T protocol in juvenile pig to explore cortical activation with different types of stimulation. The conventional pig is a good model due to its anatomical similarity to humans. The structure of the middle and the inner ear are the same2. The microscopic aspect of the cochlear structure is well known and comparable to humans3. It is also a very good model for brain imaging, especially MRI and functional MRI, already used in gustatory4, olfactory5 and visual6 modalities.METHODS
Five normally hearing conventional pigs were imaged on a 1.5T MRI under isoflurane anesthesia and mechanical ventilation. End-tidal CO2 was monitored and kept between 4% and 4,5%. The audition was previously tested with Auditory Brainstem Response7 (ABR) at 250, 3000 and 8000 Hz. Auditory stimulation was done with inserts bilaterally and calibrated audiometers at the previous 3 frequencies, respecting the pig auditory spectrum8. The stimulation is calibrated by measuring the SPL at the eardrum. Three paradigms were used. Paradigm 1 with single pure tone stimulation, included one of the 3 frequencies alternating with silent. Paradigm 2 with multiple pure tone stimulation, included each frequency and silent. Paradigm 3 with vocal sound stimulation, included noise of pig and silent. Anatomical image and Blood Oxygen Level-Dependent signal acquisition have been achieved. The BOLD acquisitions were performed with an echo planar imaging sequence with TR/TE: 2500/40ms, FA: 90°, voxel size: 2.5x2.5x2.5 mm3, FOV = 192x192 mm2, matrix = 64x64. Data analysis was performed with SPM12 and used voxel-based and SVC-based statistics. Anatomical regions of interest from pig brain atlas were used9.RESULTS
The validation of the experimental setup, the acquisition and the statistical analysis pipeline was carried out using all of the sound stimulus whatever the paradigm and frequency and determined with the on-off contrast in voxel-based statistic. All three level of the auditory pathways were activated in cerebral map activation with a significant BOLD signal: the inferior colliculi in the brainstem, the geniculate nucleus in the thalamus and the auditory cortex. In SVC-based analysis there was a statistically significant activation of the inferior colliculi (puncorr = 0.0013 at 250Hz, puncorr = 0.0032 at 3000Hz and puncorr = 0.0004 at 8000Hz), the geniculate nuclei (puncorr = 0.0001 at 250Hz, puncorr = 0.00001 at 8000Hz) and the auditory cortex (puncorr = 0.0013 at 250Hz, puncorr = 0.00029 at. 3000Hz) with multiple pure tone stimulation. The vocal sound stimulation also statistically significant activated the inferior colliculi (puncorr = 0.00023), the geniculate nuclei (puncorr = 0.00034) and the auditory cortex (puncorr = 0.00004).DISCUSSION
The activation of the central auditory pathways has been well demonstrated in humans10 with 1.5T fMRI auditory stimulation. Functional MRI is not usable in cochlear implanted patients because of the shadow cone created by the magnet’s device, which is why we developed this animal model. In animals, some authors have demonstrated activation of the inferior colliculi, geniculate nuclei and auditory cortex11 in dogs with 3T MRI. In cats, activation of the temporal cortex after auditory stimulation has been demonstrated on 7T MRI12. However, these animals were not good model for cochlear implant surgery. The disadvantage of performing fMRI with acoustic stimulation is the high background noise generated by the MRI itself. Sound attenuation systems, preferably earphones, can reduce the noise by 30dB13 to 50dB14. Our acoustic stimulation system allowed a maximum attenuation of 40-45dB. Anesthesia under isoflurane can increase auditory thresholds on average by 27dB in animal models15. The latency waves of the ABR can be increased and the amplitude decreased16. These prelimnary results are encouraging in the perpective of otological and surgical animal model studies.CONCLUSION
To date, this is the first description of functional MRI with acoustic stimulation in juvenile pigs. It is possible to observe brain responses to pure tone and vocal sound stimulation at the level of the entire auditory pathways, which open the way for exploring central auditory pathways under EAS cochlear implantation.Acknowledgements
This research is supported by Fondation Pour l’Audition [FPA RD 2020-5].We thank the staff from the animal facility UE3P of INRA for their technical support: Julien Georges and Alain Chauvin. We acknowledge the PRISM core facility for its technical support, and especially Stéphane Quellec.References
1. Gantz BJ, Turner C, Gfeller KE, Lowder MW. Preservation of Hearing in Cochlear Implant Surgery: Advantages of Combined Electrical and Acoustical Speech Processing: The Laryngoscope. mai 2005;115(5):796‑802.
2. Hoffstetter M, Lugauer F, Kundu S, Wacker S, Perea-Saveedra H, Lenarz T, et al. Middle ear of human and pig: a comparison of structures and mechanics. Biomed Tech Eng. 1 janv 2011;56(3):159‑65.
3. Lovell JM, Harper GM. The morphology of the inner ear from the domestic pig (Sus scrofa). J Microsc. déc 2007;228(3):345‑57.
4. Coquery N, Meurice P, Janvier R, Bobillier E, Quellec S, Fu M, et al. fMRI-Based Brain Responses to Quinine and Sucrose Gustatory Stimulation for Nutrition Research in the Minipig Model: A Proof-of-Concept Study. Front Behav Neurosci. 24 juill 2018;12:151.
5. Coquery N, Menneson S, Meurice P, Janvier R, Etienne P, Noirot V, et al. fMRI‐Based Brain Responses to Olfactory Stimulation with Two Putatively Orexigenic Functional Food Ingredients at Two Different Concentrations in the Pig Model. J Food Sci. sept 2019;84(9):2666‑73.
6. Fang M, Li J, Rudd JA, Wai SM, Yew JCC, Yew DT. fMRI Mapping of cortical centers following visual stimulation in postnatal pigs of different ages. Life Sci. févr 2006;78(11):1197‑201.
7. Guo W, Yi H, Ren L, Chen L, Zhao L, Sun W, et al. The Morphology and Electrophysiology of the Cochlea of the Miniature Pig: Morphology and Electrophysiology of the Cochlea. Anat Rec. mars 2015;298(3):494‑500.
8. Heffner RS, Heffner HE. Hearing in domestic pigs (Sus scrofa) and goats (capra hircus). Hear Res 48:231-240
9. Saikali S, Meurice P, Sauleau P, Eliat P-A, Bellaud P, Randuineau G, et al. A three-dimensional digital segmented and deformable brain atlas of the domestic pig. J Neurosci Methods. sept 2010;192(1):102‑9.
10. Belin P, Zatorre RJ, Hoge R, Evans AC, Pike B. Event-Related fMRI of the Auditory Cortex. Neuroimage. 10,417-429.
11. Bach J-P, Lüpke M, Dziallas P, Wefstaedt P, Uppenkamp S, Seifert H, et al. Auditory functional magnetic resonance imaging in dogs – normalization and group analysis and the processing of pitch in the canine auditory pathways. BMC Vet Res. déc 2016;12(1):32.
12. Brown TA, Gati JS, Hughes SM, Nixon PL, Menon RS, Lomber SG. Functional Imaging of Auditory Cortex in Adult Cats using High-field fMRI. J Vis Exp. 19 févr 2014;(84):50872.
13. Seifritz E, Di Salle F, Esposito F, Herdener M, Neuhoff JG, Scheffler K. Enhancing BOLD response in the auditory system by neurophysiologically tuned fMRI sequence. NeuroImage. févr 2006;29(3):1013‑22.
14. Scheich H, Baumgart F, Gaschler‐Markefski B, Tegeler C, Tempelmann C, Heinze HJ, et al. Functional magnetic resonance imaging of a human auditory cortex area involved in foreground–background decomposition. Eur J Neurosci. févr 1998;10(2):803‑9.
15. Ruebhausen MR, Brozoski TJ, Bauer CA. A comparison of the effects of isoflurane and ketamine anesthesia on auditory brainstem response (ABR) thresholds in rats. Hear Res. mai 2012;287(1‑2):25‑9.
16. Stronks HC, Aarts MCJ, Klis SFL. Effects of isoflurane on auditory evoked potentials in the cochlea and brainstem of guinea pigs. Hear Res. févr 2010;260(1‑2):20‑9.
17. Rojas MJ, Navas JA, Greene SA, Rector DM. Discrimination of Auditory Stimuli during Isoflurane Anesthesia. 2008. Comp Med. 58(5):4554-457.
Figures
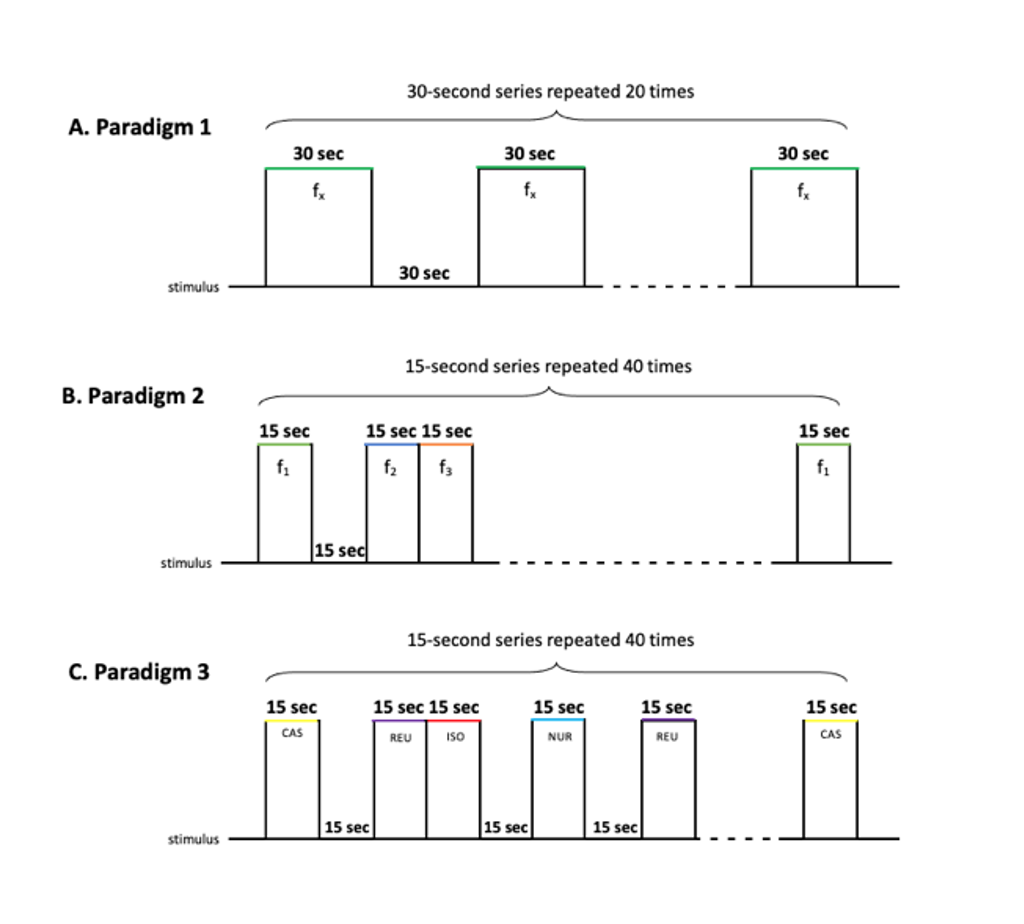
Fig 1. Block design stimulus presentation. (A) Paradigm 1 [single pure tone stimuli]: one each of the 3 frequencies 250, 3000 et 8000Hzwas presented during 30sec alternating with 30sec of silent, repeated 20 times. (B) Paradigm 2 [multiple pure tone stimuli]: all the 3 frequencies and silent were randomly presented during 15 sec, repeated 40 times. (C) Paradigm 3 [vocal sound stimulation]: all the 4 pig sounds and silent were randomly presented during 15 sec, repeated 40 times.
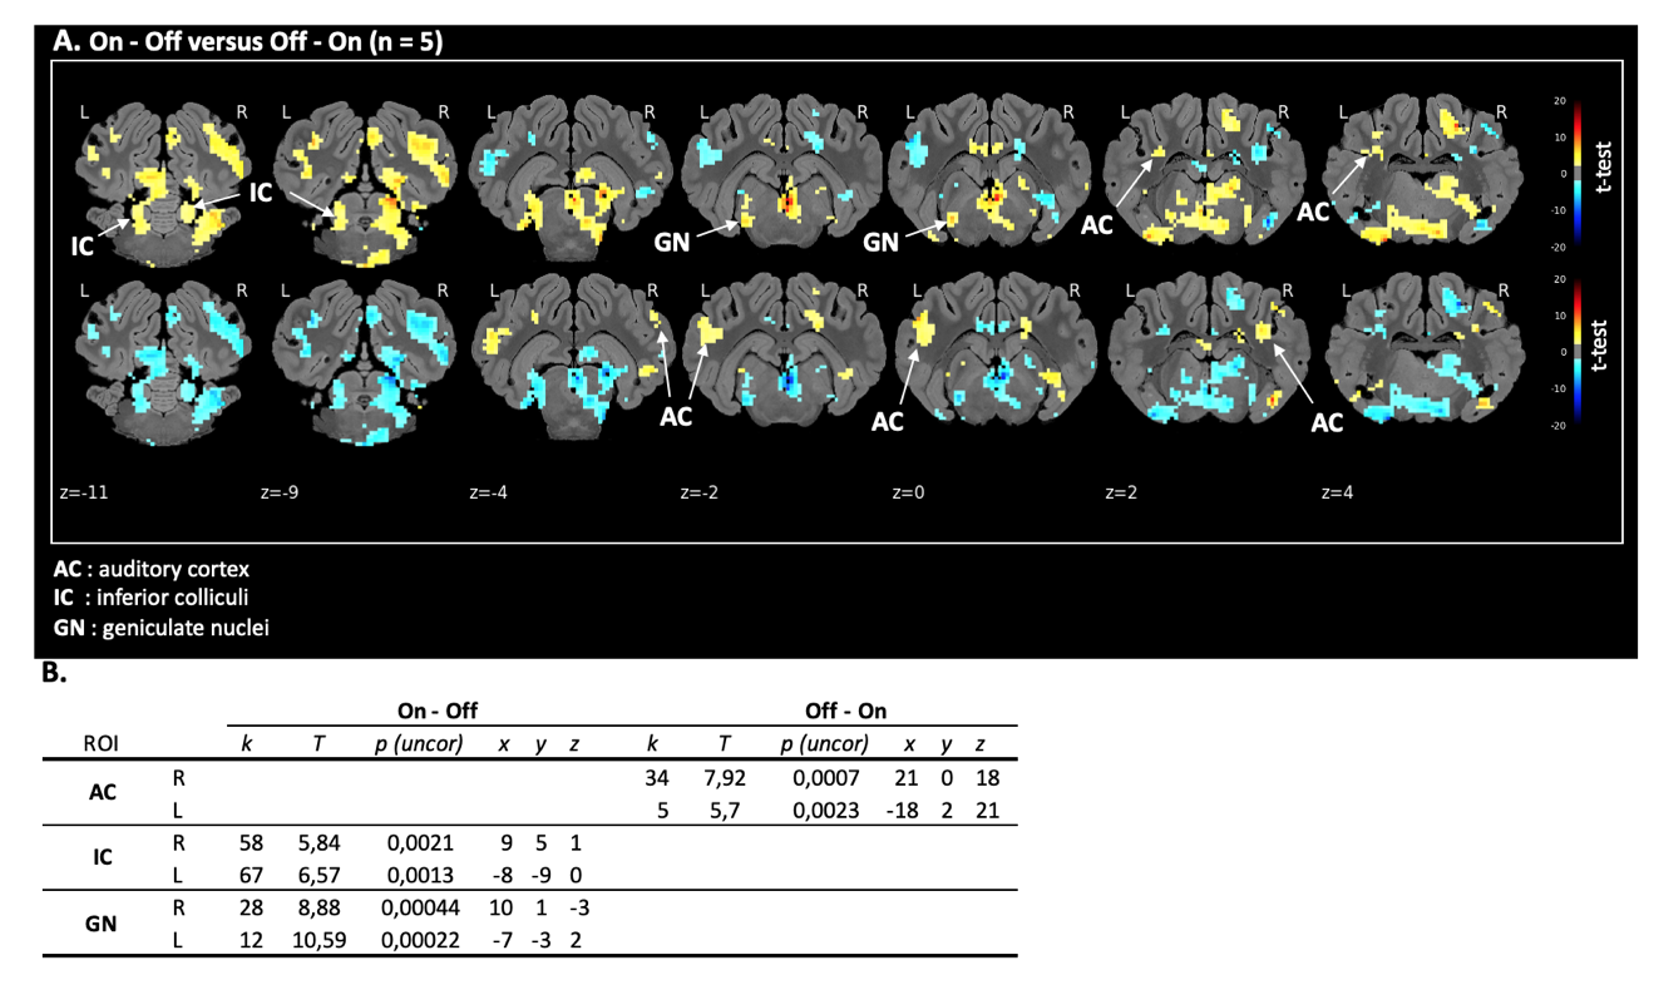
Fig 2. Proof-of-concept: auditory pathways activation. (A) Maps of brain BOLD responses to acoustic stimulation (all frequencies / all pure tone paradigm): p-value threshold = 0.05, k > 108. (B) SVC-based statistics: Related regions of interest (ROIs) with uncorrected p-value that reached the criteria of p < 0,0035 after Bonferroni correction.
Z: coronal slice in mm. L: left side / R: right side. k: cluster size (number of voxels). T: statistical value of the peak. x,y,z: peak’s coordinates.
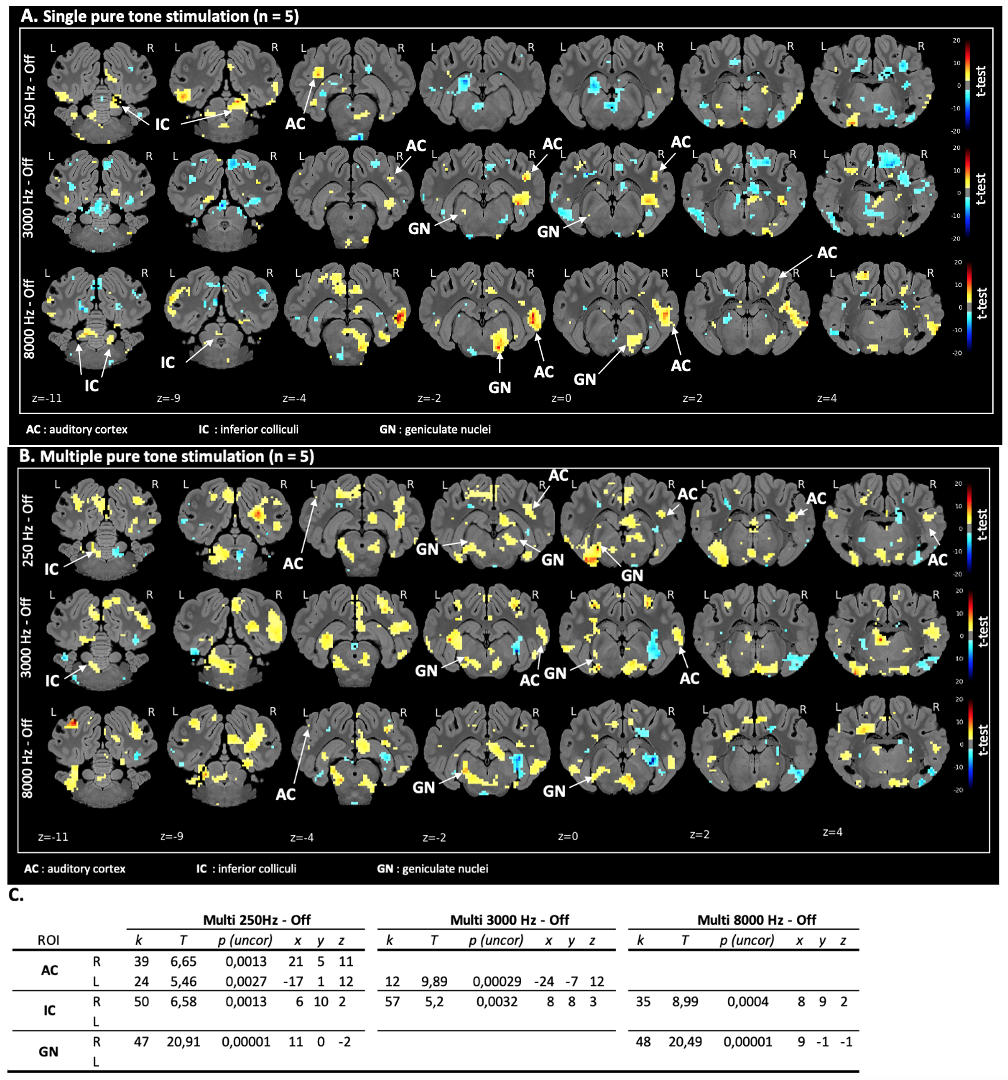
Fig 3. Pure tone stimulation. (A) Maps of brain BOLD responses to single acoustic stimulation at 250 Hz, 3000 Hz and 8000 Hz [paradigm 1]: p-value threshold = 0.05, k > 108. (B) Maps of brain BOLD responses to multiple acoustic stimulation at 250 Hz, 3000 Hz and 8000 Hz [paradigm 2]: p-value threshold = 0.05, k > 108. (C) SVC-based statistics: ROIs with uncorrected p-value that reached the criteria of p < 0,0035 after Bonferroni correction.
Z: coronal slice in mm. L: left side / R: right side. k: cluster size (number of voxels). T: statistical value of the peak. x,y,z: peak’s coordinates.
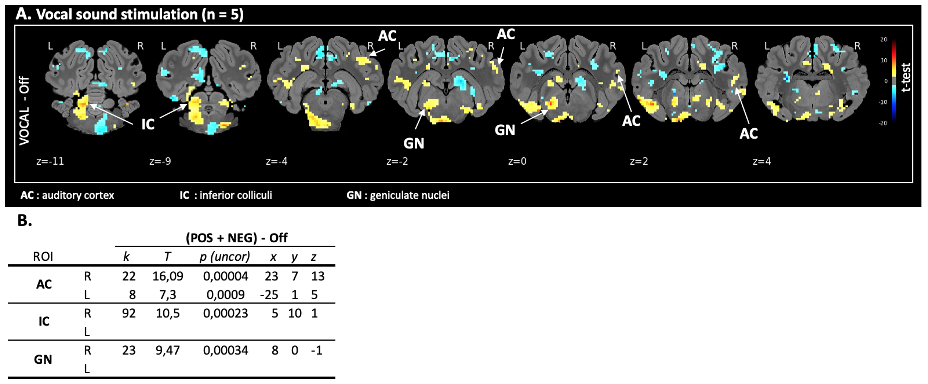
Fig 4. Vocal sound stimulation (A) Maps of brain BOLD responses to vocal sound stimulation [paradigm 3]: p-value threshold = 0.05, k > 108. (B) SVC-based statistics: ROIs with uncorrected p-value that reached the criteria of p < 0,0035 after Bonferroni correction.
Z: coronal slice in mm. L: left side / R: right side. k: cluster size (number of voxels). T: statistical value of the peak. x,y,z: peak’s coordinates.