2988
Multiplex network analysis reveals disrupted brain processing speed in children with prenatal alcohol exposure1Victorian Infant Brain Study (VIBeS), Murdoch Children's Research Institute, Melbourne, Australia, 2Florey Department of Neuroscience and Mental Health, University of Melbourne, Heidelberg, Australia, 3Institute for Radiological Research, Chang Gung University and Chang Gung Memorial Hospital, Taoyuan, Taiwan, 4Department of Psychiatry, Chang Gung Memorial Hospital, Taoyuan, Taiwan, 5Turner Institute for Brain and Mental Health, Monash University, Clayton, Australia
Synopsis
In this study, we applied a method that integrates dynamic functional connectivity using the multiplex network approach to enhance the sensitivity to subtle alterations of functional connectivity on participants subject to PAE. Our results demonstrated its capability in characterizing subtle brain network changes in children with low-moderate PAE. The lower values of the PAE T1-T3 group indicates that the information processing speed could have been compromised due to PAE. In line with literature, the distinct findings between male and female groups revealed that PAE may induce gender-dependent brain disruptions and males are more susceptible to PAE.
INTRODUCTION
Chronic and excessive prenatal alcohol exposure (PAE) disrupts fetal development, leading to facial and neurological abnormalities in children1, with cognitive impairments associated with the brain structural and functional alterations. Neuroimaging techniques may be more sensitive to detect the subtle changes induced by low to moderate levels of PAE than neurobehavioral outcome measures2, providing an opportunity to quantitatively characterize the effect of prenatal alcohol consumption on brain development. In this study, we applied a method that integrates dynamic functional connectivity (DFC) using the multiplex network approach to enhance the sensitivity to subtle alterations of functional connectivity on participants subject to PAE.METHODS
Subjects: Ninety subjects were recruited to participate this study, including 24 exposed to no alcohol during pregnancy (nPAE, M/F: 15/9, age: 7.30±0.41), 27 exposed to alcohol during trimester 1 only (PAE T1, M/F: 8/19, age:7.30±0.34), and 39 exposed to alcohol throughout pregnancy (PAE T1-T3, M/F: 22/17, age: 7.27±0.21).Data acquisition: Resting-state functional MRI (rs-fMRI): TR/TE = 1500/33ms, flip angle=85°, voxel size=2.45×2.45×2.5 mm3 , multiband-factor=3, total time points = 206.
Generation of FC: Rs-fMRI data were preprocessed as follows: motion correction, confound regression, brain extract and normalization, band filtering, and volume censoring3. AAL parcellation was employed to extract region-wise time series. Five fMRI data segments (20 time-points each) were consistently obtained from individual subject, yielding 5 DFC networks and one static FC for each subject.
Proposed multiplex DFC network analysis: We aim to model the diffusion speed on multiplex networks and the main procedure to achieve this are as follows: (1) Five DFC networks were concatenated to construct the supra-adjacency matrix at individual-level4; (2) The associated Supra-Laplacian matrix was then computed from the supra-adjacency matrix; (3) Eigenvalue decomposition was applied to the supra-Laplacian matrix to extract the second smallest eigenvalue, λ2. According to literature5, is proportion to the network diffusion speed, and τ=1/λ2 represents diffusion time; (4) A range of diffusion coefficients (Dx=0.1-30) was employed to estimate λ2, as proxies for measuring the diffusion speed associated with Dx; (5) For each subject, the maximum and minimum among the 5 λ2 values computed from the 5 DFC networks were denoted as λ2max and λ2min, respectively; (6) The overall mean of the λ2max and λ2min were then averaged across all the three groups.
Statistical analysis: The comparisons of λ2 between groups were analyzed using ANCOVA by controlling for age and gender, followed by multiple comparisons correction with false discovery rate (FDR). As for the statistical analyses collapsed across the predefined range of Dx values, yielding repeated measures of network diffusion speed. The LME analyses were performed as follows: (1) Group effect only; (2) Group + Gender; (3) Group + Age.
RESULTS
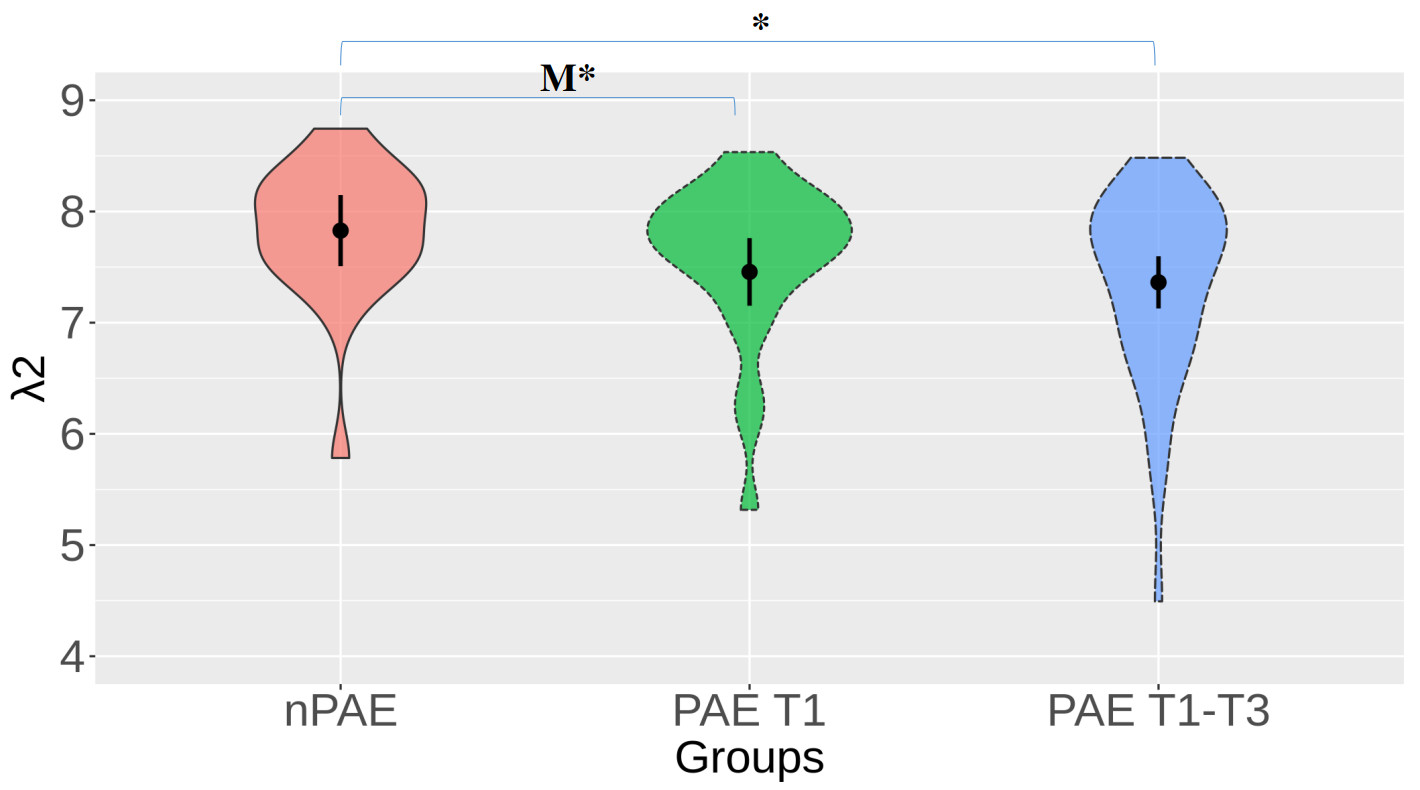
Figure 1 shows that greater λ2 were obtained from the multiplex networks than the overall mean of λ2max calculated from the single network when Dx exceeds 13.According to Figure 1, 18 Dx values (Dx=13-30) were chosen as the predefined range, yielding 18 measures of λ2. When comparing λ2 between groups, lower λ2 values were detected in the PAE T1-T3 group with than the nPAE group after correcting for multiple comparisons (p< .05) (Figure 2). However, no significant differences of λ2 were detected between the PAE T1 and the nPAE groups.
Significantly decreased λ2 was detected in the PAE T1-T3 group compared with the nPAE group across the predefined range of Dx values (Figure 3). Compared to the nPAE group, the reductions of λ2 identified in the PAE T1 group were only marginally significant.
When considering the effect of gender, significantly lower λ2 were detected in the PAE T1-T3 and the PAE T1 groups compared with the nPAE group (Figure 4). In contrast, such significant differences were not observed from the female category.
No significant age effect on λ2 was detected between the PAE groups and the control group at any age category.
DISCUSSION
We used a novel approach, multiplex DFC network analysis, for quantifying brain network changes. Our results demonstrated its capability in characterizing subtle brain network changes in children with low-moderate PAE. The multiplex networks generally had a greater λ2 than the single networks; this implies that network diffusion speed might be underestimated when using single networks alone. The lower λ2 values of the PAE T1-T3 group indicates that the information processing speed could have been compromised due to PAE. Further, the marginally significant effect from PAE T1 likely suggests that brain disruptions might be less severe than PAE T1-T3. In line with literature6, the distinct findings between male and female groups revealed that PAE may induce gender-dependent brain disruptions and males are more susceptible to PAE.Acknowledgements
No acknowledgement found.References
1. Muggli, E., et al., Association Between Prenatal Alcohol Exposure and Craniofacial Shape of Children at 12 Months of Age. JAMA Pediatr, 2017. 171(8): p. 771-780.
2. Levin, E.D., S.L. Schantz, and R.E. Bowman, Use of the lesion model for examining toxicant effects on cognitive behavior. Neurotoxicol Teratol, 1992. 14(2): p. 131-41.
3. Power, J.D., et al., Methods to detect, characterize, and remove motion artifact in resting state fMRI. Neuroimage, 2014. 84: p. 320-41.
4. Cozzo, E., et al., Multilayer networks: metrics and spectral properties. (eds) Interconnected Networks. Understanding Complex Systems. Springer, Cham. https://doi.org/10.1007/978-3-319-23947-7_2. 2016.
5. Gomez, S., et al., Diffusion dynamics on multiplex networks. Phys Rev Lett, 2013. 110(2): p. 028701.
6. Terasaki, L.S., J. Gomez, and J.M. Schwarz, An examination of sex differences in the effects of early-life opiate and alcohol exposure. Philos Trans R Soc Lond B Biol Sci, 2016. 371(1688): p. 20150123.
Figures