2987
Use of Arterial Blood Contrast (ABC) to detect resting state networks at short TE1Radboud University, Donders Institute, Nijmegen, Netherlands
Synopsis
Arterial blood contrast increase the cerebral blood volume contribution to brain activation studies by suppressing grey matter signal using on-resonance magnetisation transfer. An increase in CBV will lead to an increase in signal, which is then complementary to BOLD. We performed multi-echo resting state fMRI in a group of 16 subjects and compared the results at TE=28ms with MT-off (standard BOLD) and TE=6.9 MT-on (ABC). Z-scores were higher for standard BOLD at all TEs but with higher variance in the z-score value. Dual regression results never the less showed high similarity activation maps for standard resting state networks.
Introduction
Arterial Blood Contrast (ABC) has recently been proposed as a novel method to make brain activation studies more sensitive to changes in regional blood volume (CBV), and has previously been demonstrated for a visual stimulus paradigm [1]. ABC uses magnetisation transfer to selectively suppress the signal from tissue, while leaving blood largely unaffected. Increased blood volume upon activation will then lead to an increase in signal that is complementary to the BOLD signal increase, rather than opposing it. Effectively this means that there is a positive signal change upon activation at zero TE, and in comparison to BOLD the maximum signal change is obtained at shorter TE. This opens the possibility of performing brain activation experiments at shorter TE as previously demonstrated for visual stimulation. In this abstract we report the use of ABC in a resting state fMRI study.Methods
The resting-state fMRI datasets of 16 subjects were acquired on a 3T Siemens MAGNETOM Prisma scanner using a multi-echo gradient-echo 2D-EPI with the conditions of MT-on and MT-off, using a protocol based on [1]. Three echoes (TEs: 6.9, 18, and 28 ms) were obtained for each contrast. The imaging parameters were as follows: TR=2s, spatial resolution=3 mm isotropic, slice-number=38, matrix size=80*80.Processing steps: All datasets were firstly preprocessed by fMRIprep pipeline [2] to provide a motion corrected and brain-masked dataset. Afterwards, high-pass filtering with the cutoff frequency of 0.01 Hz, and spatial smoothing with the FWHM of 6 mm were performed using FSL software. Finally, the resultant images were denoised by the nuisance regressors provided by fMRIprep namely 'csf', 'white_matter', 'trans_x', 'trans_x_derivative1', 'trans_y', 'trans_y_derivative1', 'trans_z', 'trans_z_derivative1’. Single-level and group-level analyses including dual regression (stage 1 and stage 2) [3] and randomise [4] were carried out on the 4D cleaned images derived from the previous step. The group spatial maps needed for dual regression were provided by running MELODIC (Multi-session temporal concatenation) [5] on the echo-combined datasets for both contrasts of MT-on and MT-off [6] considering 30 components. In order to assume one set of group spatial maps for both contrasts, the cross correlation between these components and 10 Smith’s resting-state networks [7] was computed to find the components with the highest value of correlation. Since group ICA maps of MT-off echo-combined datasets had the greatest correlation with the Smith’s networks, these maps were chosen as templates. From dual regression, the z-maps of stage 2 were then utilized to calculate the mean z-score for each contrast across subjects within the group ICA resting-state networks. Moreover, the Single Group Average (One-Sample T-Test) analysis was executed by the randomise tool of FSL which produced P-value images (available as 1-P for better visualization).Results
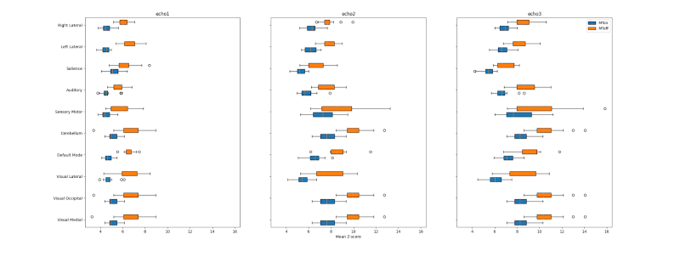
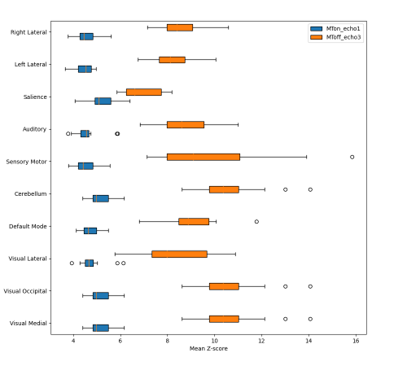
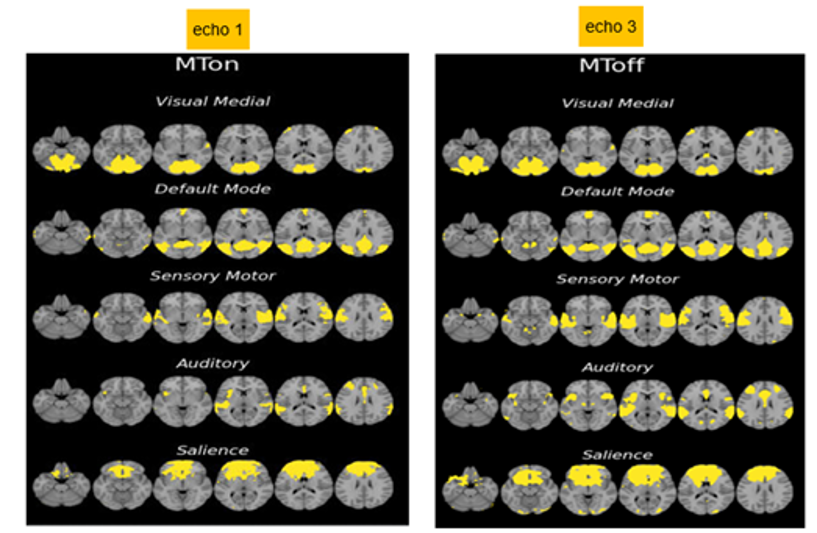
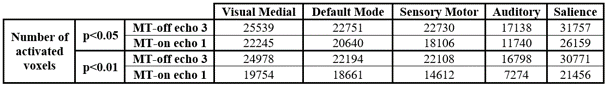
The mean of z-scores were thresholded at z>3.1 and the results were provided for two contrasts of MT-on and MT-off for all 3 echoes in Figure 1. Since we are more interested in two conditions that BOLD signal and Arterial Blood Contrast are more dominant, and to have a better insight into the differences of these two contrasts, the results of MT-on echo 1 and MT-off echo 3 are shown in Figure 2. From these graphs, it can be understood that the mean of z-scores has higher values, but also a greater range for MT-off echo 3 than MT-on echo 1.Additionally, the statistical maps of nonparametric one-sample t-tests are provided in Figure 3 with the significance level of p<0.01. In order to ease the visual comparison for the graph results, the number of activated voxels inside the exemplary group ICA resting-state networks are also presented in Table 1 for p-values <0.05 and <0.01.Discussion
In the previously reported visual stimulation study the MT-on signal showed comparable performance to MT-off when comparing MT-on echo 1 with MT-off echo 3 using a fixed effects analysis, and superior performance for a mixed effects analysis. In the resting state we here find consistently higher z-scores for MT-off than for MT-on. However, the variance in z-scores was generally lower for MT-on. The group-level dual regression analysis, which is the closest analogue to a mixed effects analysis for resting state, shows highly similar activation patterns.Acknowledgements
No acknowledgement found.References
[1] Schulz J, Fazal Z, Metere R, Marques J, Norris D. Arterial blood contrast (ABC) enabled by magnetization transfer (MT): a novel MRI technique for enhancing the measurement of brain activation changes. bioRxiv. 2020 Jan 1.
[2] Esteban O, Markiewicz CJ, Blair RW, Moodie CA, Isik AI, Erramuzpe A, Kent JD, Goncalves M, DuPre E, Snyder M, Oya H. fMRIPrep: a robust preprocessing pipeline for functional MRI. Nature methods. 2019 Jan;16(1):111-6.
[3] https://fsl.fmrib.ox.ac.uk/fsl/fslwiki/DualRegression/UserGuide
[4] https://fsl.fmrib.ox.ac.uk/fsl/fslwiki/Randomise/UserGuide
[5] https://fsl.fmrib.ox.ac.uk/fsl/fslwiki/MELODIC
[6] https://github.com/dangom/fslx/blob/master/fslx
[7] Smith SM, Fox PT, Miller KL, Glahn DC, Fox PM, Mackay CE, Filippini N, Watkins KE, Toro R, Laird AR, Beckmann CF. Correspondence of the brain's functional architecture during activation and rest. Proceedings of the national academy of sciences. 2009 Aug 4;106(31):13040-5.
Figures