2986
Laminar BOLD normalization using breath-hold challenge1Center for Neuroscience Imaging Research, Institute for Basic Science (IBS), Suwon, Korea, Republic of, 2Department of Biomedical Engineering, Sungkyunkwan University, Suwon, Korea, Republic of, 3Department of Biomedical Engineering, Kyung Hee University, Yongin, Korea, Republic of, 4Techna Institute & Koerner Scientist in MR Imaging, University Health Network, Toronto, ON, Canada
Synopsis
Limitations of the several developed laminar fMRI acquisition methods and pial and intra-cortical ascending vein contamination of the gradient-echo (GE) restrict the neural specificity of the depth profiles. Preserving the advantage of high sensitivity of the GE-EPI sequence, we propose a simple and intuitive model to normalize laminar BOLD with breath holding. Our normalization method increased specificity of the BOLD activation map and emphasized laminar BOLD signal changes in gray matter regions by suppressing signal changes from CSF. This approach takes into account the different vascular sensitivity across layers but may not fully account for the draining vein contamination.
Introduction
Due to higher signal-to-noise afforded by high-field (≥7 T) MRI scanners, it has been possible to increase spatiotemporal resolution and resolve cortical depth profile of the fMRI signal1,2. However, limitation of the currently developed acquisition methods (e.g., low sensitivity, long TR, SAR) and pial and intra-cortical ascending vein contamination of the gradient-echo (GE)3 restrict the neural specificity of the depth profiles. The vascular sensitivity is another confounding factor when interpreting BOLD signal across cortical depths. Here, contrasting BOLD signal changes following a task with response to hypercapnic stimuli, we propose a methodologically simple and intuitive method to normalize laminar BOLD signal acquired with GE-EPI sequence.Methods
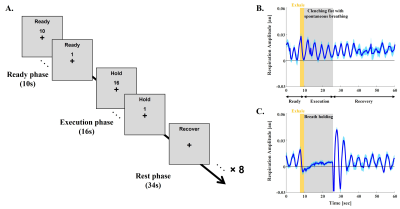
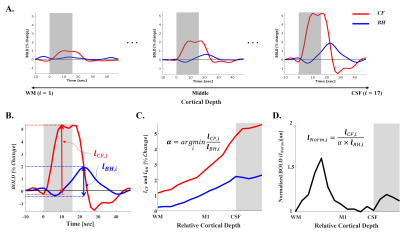
This study was approved by the IRB of Sungkyunkwan University, and the experiment was conducted using a 7T MRI scanner (Magnetom-Terra, Siemens) with a 32-channel head coil (NOVA-Medical). Six healthy volunteers performed 2 kinds of task runs including clenching fist (CF) with their left hands and breath holding (BH) challenge in the scanner. Both tasks shared the same experimental design consisted of 8 trials of Ready, Execution, and Recovery phases (Fig 1A). Also, participants were instructed to exhale at the end of the Ready phase to induce end-expiration tasks, and we simultaneously monitored their respiration pattern to confirm their performance (Fig 1B, 1C). To ensure sufficient sensitivity, CF and BH runs were repeated 3 and 4 times, respectively. BOLD data for both tasks were acquired using conventional GE-EPI sequence (voxel size = 0.8 mm isotropic, GRAPPA = 3, FOV = 136×136 mm2, 30 slices, flip angle = 63°, partial Fourier = 6/8, TE/TR = 21/2,000 ms, echo spacing = 1 ms (1176 Hz/Px)) covering hand-knob regions of the right primary motor (M1) and sensory (S1) cortices. Structural image was acquired using a FLASH sequence with the matched imaging parameters to BOLD data except for 610 Hz/Px, TEs = 3.9, 6.9, 21 ms, and the flip angle = 50°, and was used for generating layer masks and distortion correction for the BOLD data. Layer masks were delineated on 10 slices based on BOLD signal change maps estimated by FSL-FEAT4. Each 12 laminar depths for motor and sensory cortices were grown within the mask in an equal-distant fashion. Trial-averaged laminar time courses for each layer depth were extracted from CF and BH (Fig 2A), and total signal changes by each task were measured (Fig 2B, 2C). Using those two laminar profiles, scaling factor (α) was calculated to match scale of the laminar profile of BH (lBH,i) to that of CH (lCF,i) (Fig 2C). Then, the normalization was performed by simply dividing raw laminar profile (lCF,i) into scaled laminar profile of BH (α × lBH,i) (Fig 2D).Results
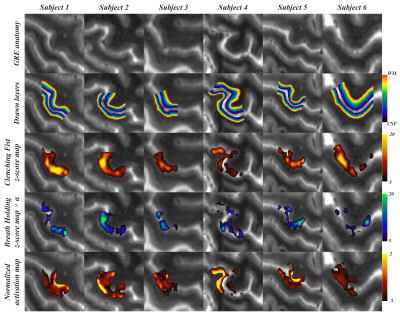
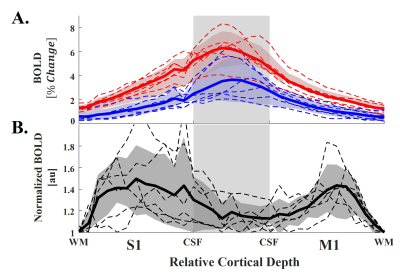
In all participants, the z-score maps of CF and BH showed largest BOLD signal changes in CSF regions (Fig 3, 3rd and 4th rows). For this reason, our method counterbalanced signal increases in CSF regions so that signal changes in the gray matter regions were more emphasized in normalized map (Fig 3, 5th row). Also, by the normalization, the locations of peak signal changes were more specified on the gray matter (Fig 3, 5th row). Group-averaged laminar profile results showed that the laminar profile of the CF were strongly correlated with that of the BH (Pearson’s correlation coefficient, mean ± SD = 0.94 ± 0.1) and significantly higher (Student’s t-test, p < 0.05) regardless of laminar depth (Fig 4A). The normalization significantly suppressed signal changes in CSF regions, that it, it resulted significantly higher BOLD signal changes in deep gray matter (S1: F16 = 1.84, p = 0.039, M1: F16 = 5.01, p < 0.001) (Fig 4B).Discussion and Conclusion
We propose a methodologically and experimentally simple method of hypercapnic BOLD normalization of submillimeter resolution GE-fMRI by using breath holding challenge as a hypercapnic stimuli. Preserving the advantage of high sensitivity of the GE-EPI sequence, our normalization method increased specificity of the BOLD activation map and emphasized laminar BOLD signal changes in gray matter regions by suppressing signal changes from CSF. This approach takes into account the different vascular sensitivity across layers but may not fully account for the draining vein contamination. We are currently investigating using modeling whether the hypercapnic normalization is also suitable to at least partially removing the effect of ascending veins on the GE-BOLD signal.Acknowledgements
This work was supported by the Institute of Basic Science under grant IBS-R015-D1.
References
[1] Huber L, Uludağ K, Mőller HE. Non-BOLD contrast for laminar fMRI in humans: CBF, CBV, and CMRO2. NeuroImage. 2019;197:742–60. doi: 10.1016/j.neuroimage.2017.07.041.
[2] Han SH, Eun S, Cho HJ et al. Improvement of sensitivity and specificity for laminar BOLD fMRI with double spin-echo EPI in humans at 7T. NeuroImage. 2021;241:118435. doi: 10.1016/j.neuroimage.2021.118435.
[3] Zhao F, Wang P, Kim SG. Cortical depth-dependent gradient-echo and spin-echo BOLD fMRI at 9.4T. Magn. Reson. Med. 2004;51:518–24. doi: 10.1002/mrm.10720.
[4] Woolrich MW, Ripley BD, Brady M et al. Temporal autocorrelation in univariate linear modeling of FMRI data. NeuroImage. 2001;14(6):1370–86. doi: 10.1006/nimg.2001.0931.
Figures


Fig 2. Laminar data processing steps. A: Extracted trial-averaged laminar time courses from all cortical depths (i). B: Calculation of total BOLD changes from each layer of both tasks. C: Laminar profile of both tasks (lCF,i and lBH,i) and calculation of scaling factor (α). D: Normalization of the laminar profile of clenching fist task (lNorm,i). Gray boxes in A and B represent task execution period, while they represent CSF regions in C and D.


Fig 4. Group-averaged laminar profile results. A: Laminar profiles of clenching fist and breath holding tasks. B: Normalized laminar profile of clenching fist. All dot lines and solid lines represent individual and group-averaged profiles, respectively.