2985
Improving laminar functional specificity and sensitivity using combined spin- and gradient-echo EPI at 7 T
SoHyun Han1,2, Seulgi Eun1,2, HyungJoon Cho3, Kâmil Uludaǧ1,2, and Seong-Gi Kim1,2
1Center for Neuroscience Imaging Research, Suwon, Korea, Republic of, 2Department of Biomedical Engineering, Sungkyunkwan University, Suwon, Korea, Republic of, 3Department of Biomedical Engineering, Ulsan National Institute of Science and Technology, Ulsan, Korea, Republic of
1Center for Neuroscience Imaging Research, Suwon, Korea, Republic of, 2Department of Biomedical Engineering, Sungkyunkwan University, Suwon, Korea, Republic of, 3Department of Biomedical Engineering, Ulsan National Institute of Science and Technology, Ulsan, Korea, Republic of
Synopsis
Both spatial specificity and sensitivity are important for high spatial resolution fMRI. In this study, we applied a filter designed based on the ΔR2*/ΔR2 ratio to enhance both the sensitivity and specificity of the BOLD signal using SAGE-EPI sequence. fMRI experiments during fist-clenching with touching with 0.8 mm isotropic resolution were performed and we directly compared the layer profile of SAGE-BOLD with that of GE- and SE-BOLD in the primary sensory and motor cortices. Vessel-size tuned SAGE-BOLD fMRI provided enhanced laminar specificity and sensitivity in the gray matter region.
Introduction
High spatial resolution functional MRI(fMRI) allows the investigation of mesoscopic cortical functional units, such as columns and laminae. For this, both signal-to-noise ratio(SNR) and the spatial specificity of the signal are critical. Generally, the gradient-echo(GE)-blood oxygenation level-dependent(BOLD) signal is highest at the surface of the cortex due to the high density of draining veins1-2, which is distal to neuronal activation. On the other hand, the spin-echo(SE)-BOLD signal is expected to be localized within gray matter with higher spatial accuracy3. However, the SE-BOLD signal is less sensitive than the GE-BOLD signal4. In this work, we applied a filter designed based on the ΔR2*/ΔR2-ratio to enhance both the sensitivity and specificity of the BOLD signal using spin- and gradient-echo(SAGE)-Echo planar imaging (EPI) sequence4-5. fMRI experiments during fist-clenching with touching with 0.8mm isotropic resolution were performed and we directly compared the layer profile of SAGE-BOLD with that of GE- and SE-BOLD in the primary sensory and motor cortices. Vessel-size tuned SAGE-BOLD-fMRI provided enhanced laminar specificity and sensitivity in the gray matter region, making it an efficient tool for high spatial resolution fMRI studies to resolve mesoscopic functional units.Methods
Six subjects participated in this study. All procedures followed the guidelines of the IRB of Sungkyunkwan University, South Korea. All measurements were performed on a 7T-scanner (MAGNETOM-Terra, Siemens-Healthineers), equipped with a 32-channel head-coil (NOVA-Medical). The SAGE-BOLD signal was calculated as SGASE=SGEα×SSE, where α is a filter defined as a sigmoid function α=−0.5×tanh(0.3×(ΔR2*/ΔR2−10))+0.5 to enhance micro-vasculature while suppressing macro-vessels. α is close to one for ΔR2*/ΔR2<<10, 0.5 for ΔR2*/ΔR2=10, and close to zero for ΔR2*/ΔR2>>10. The subjects performed fMRI experiments using a 3.8-min unilateral fist-clenching with touching stimulation paradigm (initial 20-s resting and 8-blocks of alternating 6-s clenching and 20-s resting) to demonstrate enhanced sensitivity and specificity in the micro-vascular region of SAGE-BOLD signal at 0.8mm isotropic resolution. The imaging parameters for multi-shot6 SAGE-EPI were as follows: 0.8mm3 isotropic resolution, Rin-plane=9 (for each shot; effective Rin-plane=3 by 3-shots), FOV=120×120 mm2, 24slices, flip-angle-pair=50°-180°, partial-Fourier=6/8, TR=2000 ms, and TEGE/TESE=18/58ms. fMRI experiments were repeated 10-times to ensure sufficient sensitivity. Anatomical images were acquired using a FLASH sequence with the same imaging parameters as the SAGE-EPI except for TEs=3.3,6.3, and 20ms, and the flip-angle was 50°. The boundary between gray matter and CSF was delineated and a B0-field map for distortion correction of the EPI images was obtained.Results
In Fig 1, z-score maps of GE-, SE-, and SAGE-BOLD signals were compared in one representative slice in each subject. Anatomical images obtained from FLASH sequences (the 1st row) with a TE of 3.0 ms clearly delineated CSF, gray matter, and white matter. Layers for M1 and S1 were manually drawn and overlaid onto SE-EPI images (the 2nd row). The anterior and posterior gray matter bank of the central sulcus corresponds to M1 and S1, respectively. For the case of GE-BOLD signal (the 3rd row), the z-score values peaked at or outside the cortical surface near high-intensity CSF areas. However, for the case of SAGE-BOLD signal (the 5th row), without significant activation near the CSF areas, M1 and S1 activation areas were also clearly distinguished and showed higher z-score values than SE-BOLD (the 4th row). Similar differences between GE-BOLD and SAGE-BOLD signal were consistently observed across all participants. In Fig 2A, scatter plot between SE-BOLD and GE-BOLD percent signal changes was plotted for two groups, macro-vessel area (ΔR2*/ΔR2 > 10) and micro-vasculature area (ΔR2*/ΔR2 ≤ 10). Micro-vasculature area (filled blue circles) showed linear relationship between SE-BOLD and GE-BOLD. However, macro-vessel area (red open circles) showed supra-linear relationship, which means GE-BOLD is more sensitive to macro-vessel than SE-BOLD. When α filter was applied (Fig 2B), percent signal changes of SAGE-BOLD were similar to SE BOLD in macro-vasculature (reduced significantly compared to GE BOLD) but were greatly enhanced in micro-vasculature area. Next, Fig 3 shows z-score values which reflect the sensitivity of various BOLD signals. SAGE-BOLD improves CNR only in micro-vasculature areas (ΔR2*/ΔR2 ≤ 10), resulting in the enhanced sensitivity and specificity. Finally, z-score levels of GE-, SE-, and SAGE-BOLD were obtained along the cortical depth profiles by averaging signals from five slices in each subject and plotted in Fig 4. The functional response of GE-BOLD was highest at the cortical surface, where the concentration of draining vessels is high, and decreased monotonically with increasing cortical depth. On the other hand, for the case of SAGE-BOLD, z-score level was reduced at the cortical surface and peaked in the gray matter for both M1 and S1, which is consistent with SE-BOLD behavior with improved sensitivity.Discussion and Conclusion
We proposed and demonstrated the feasibility of SAGE-EPI sequence at 7T to achieve better sensitivity and specificity than SE-BOLD at 0.8-mm in-plane resolution for laminar fMRI. Experimental results confirmed that SAGE-BOLD with micro-vasculature-tuned filter has higher CNR than conventional SE-BOLD. Different filter functions can be applied for obtaining SAGE-BOLD to tune different vessel sizes. SAGE-BOLD may play an important role for investigating mesoscopic cortical-circuits in the human brain with high specificity and sensitivity.Acknowledgements
This work was supported by the Institute of Basic Science under grant IBS-R015-D1.References
[1] Kim SG, Ugurbil K. High-resolution functional magnetic resonance imaging of the animal brain. Methods 2003;30:28–41 doi: 10.1016/S1046-2023(03)00005-7. [2] Zhao F, Wang P, Kim SG. Cortical Depth-Dependent Gradient-Echo and Spin-Echo BOLD fMRI at 9.4T. Magn. Reson. Med. 2004;51:518–524 doi: 10.1002/mrm.10720. [3] Yacoub E, Duong TQ, Van De Moortele PF, et al. Spin-echo fMRI in humans using high spatial resolutions and high magnetic fields. Magn. Reson. Med. 2003;49:655–664 doi: 10.1002/mrm.10433. [4] Donahue KM, Kylen JV, Guven S et al. Simultaneous gradient-echo/spin-echo EPI of graded ischemia in human skeletal muscle. Magn. Reson. Imaging. 1998;8:1106–1113 doi: 10.1002/jmri.1880080516. [5] Schmiedeskamp H, Straka M, Newbould RD et al. Combined spin- and gradient-echo perfusion-weighted imaging. Magn. Reson. Med. 2012;68:30–40 doi: 10.1002/mrm.23195. [6] Han SH, Cho JH, Jung HS et al. Robust MR assessment of cerebral blood volume and mean vessel size using SPION-enhanced ultrashort echo acquisition. Neuroimage. 2015;112:382–389 doi: 10.1016/j.neuroimage.2015.03.042.Figures
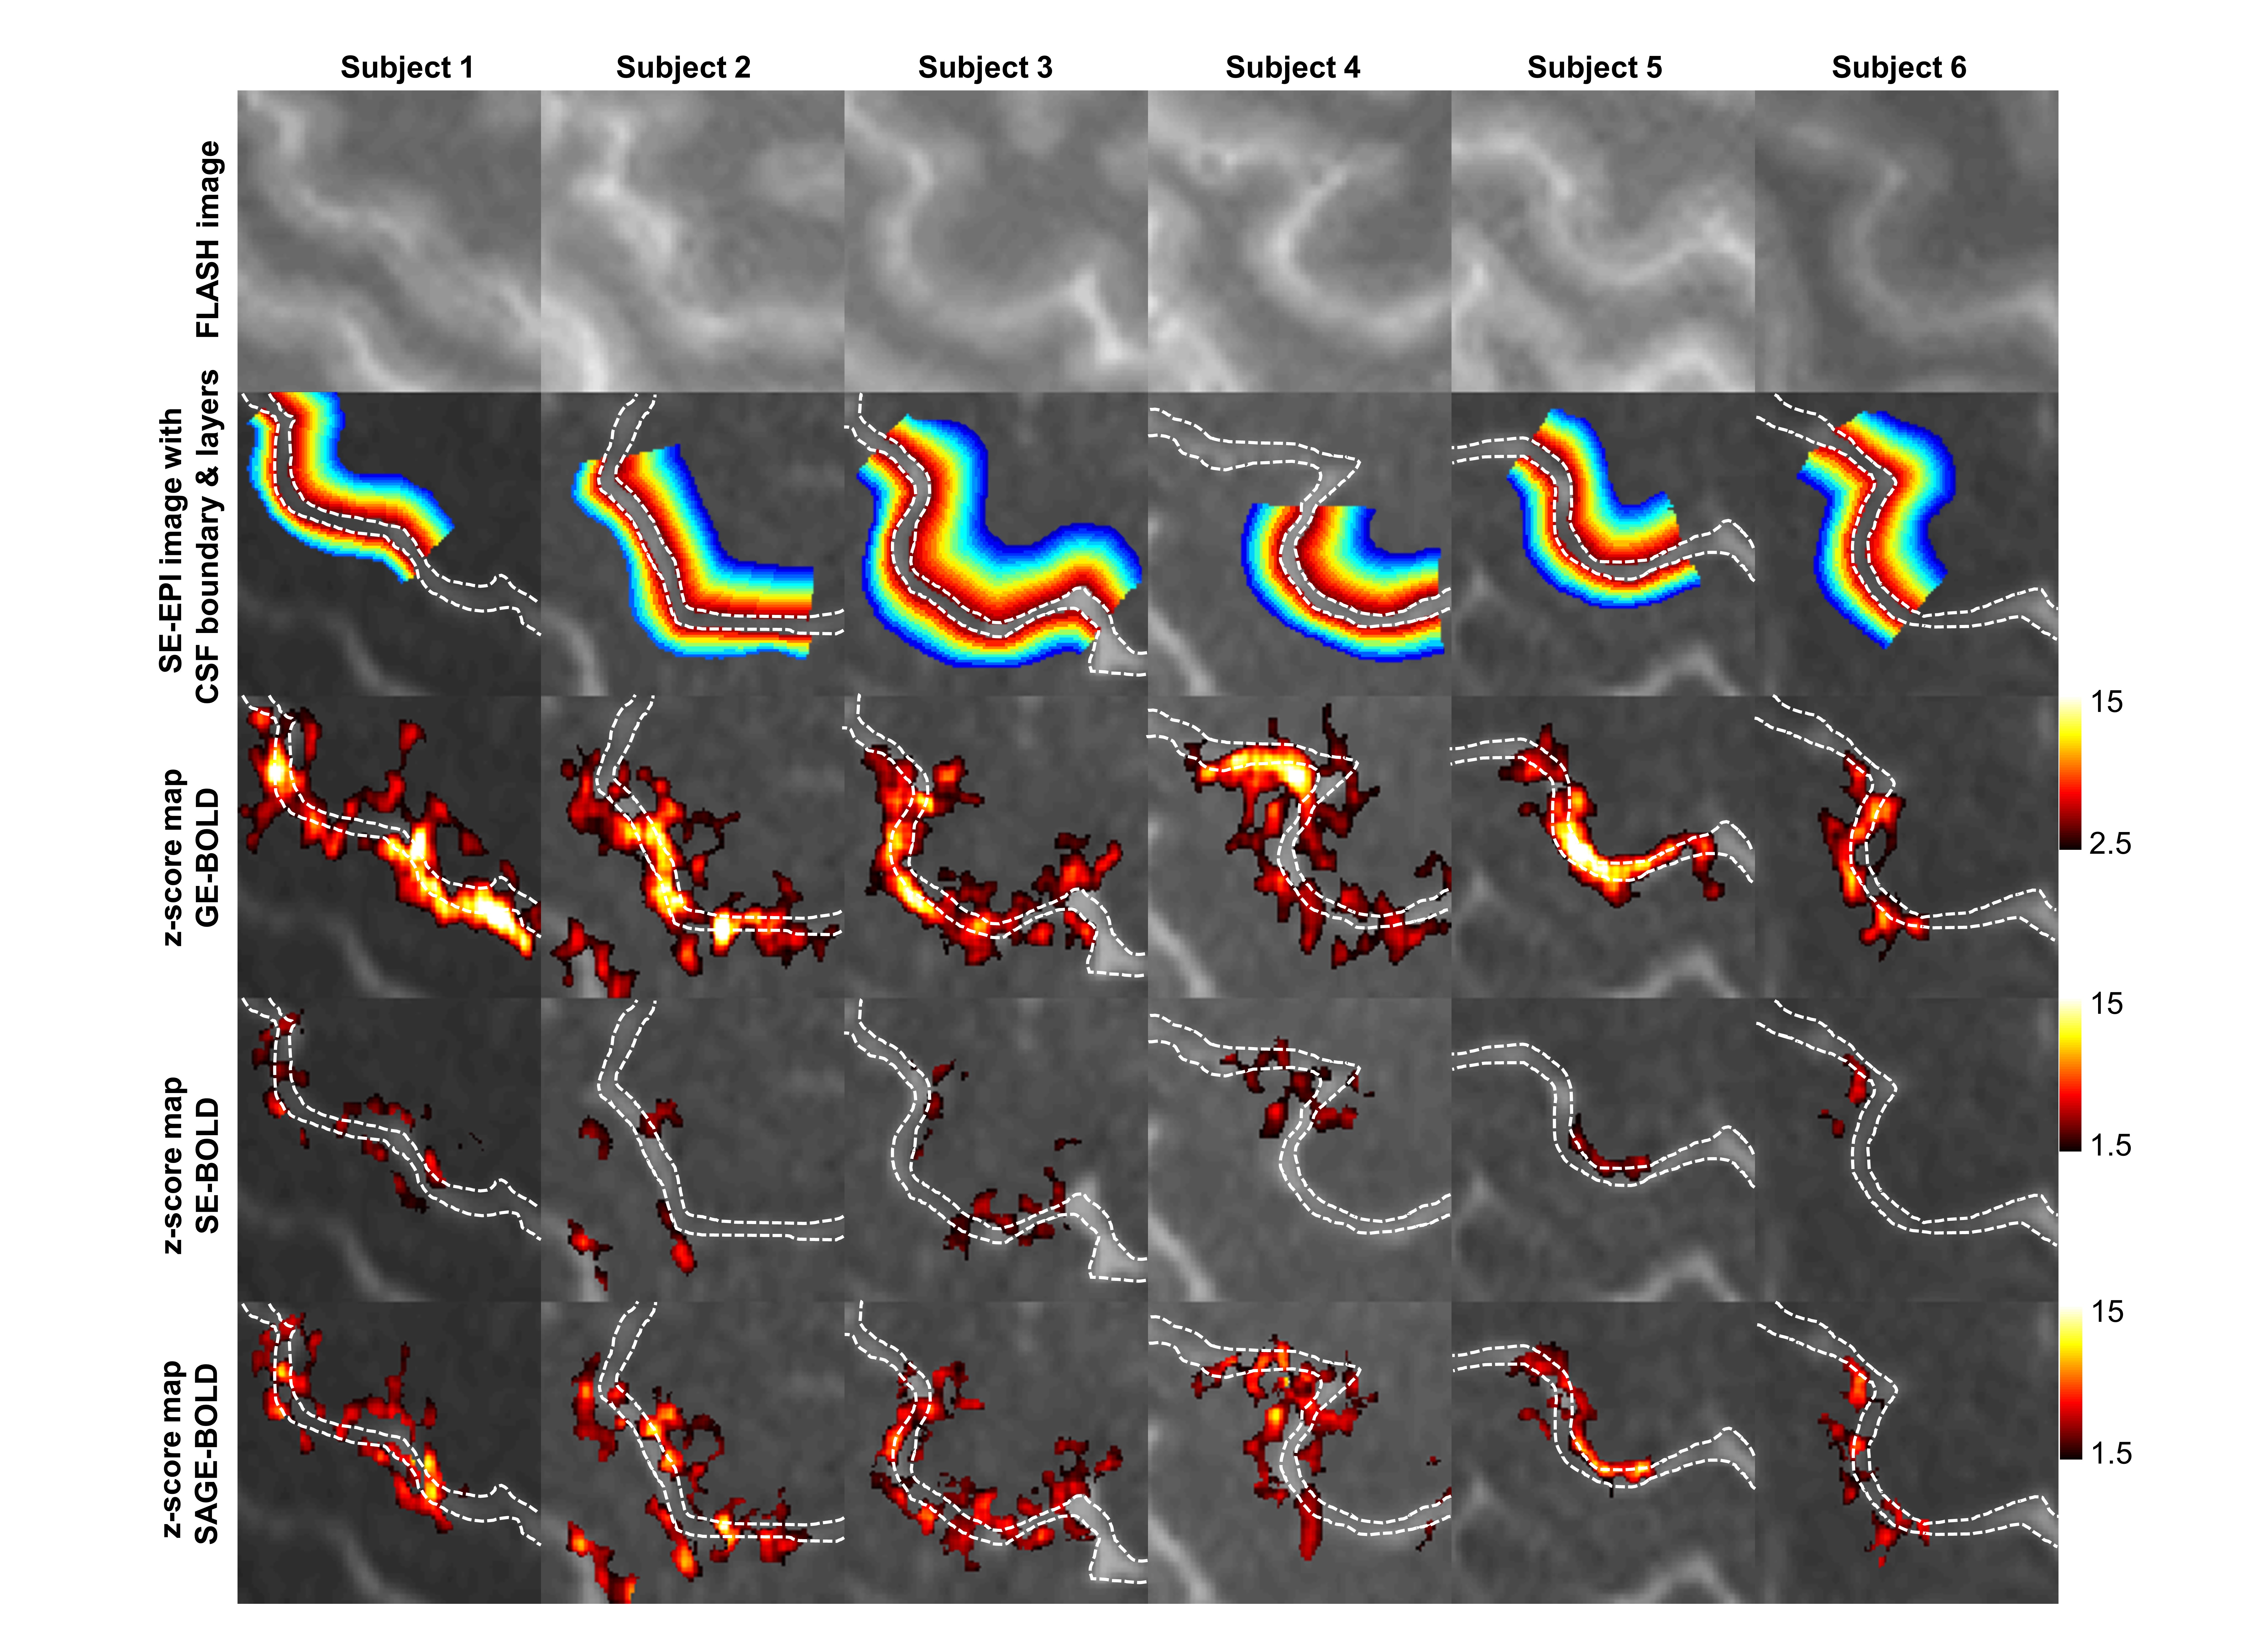
Fig 1. For illustration, one slice was selected for each subject (0.8
× 0.8 × 1.6 mm3). Based on
the anatomical images from FLASH (first row), cortical depth ROIs (colored
contours), as well as the boundary of CSF area (two white lines in the second
row), were drawn. Z-score thresholds of 2.5 and 1.5 were used for GE- (third
row) and SE-, SAGE-BOLD maps (fourth to fifth rows), respectively.
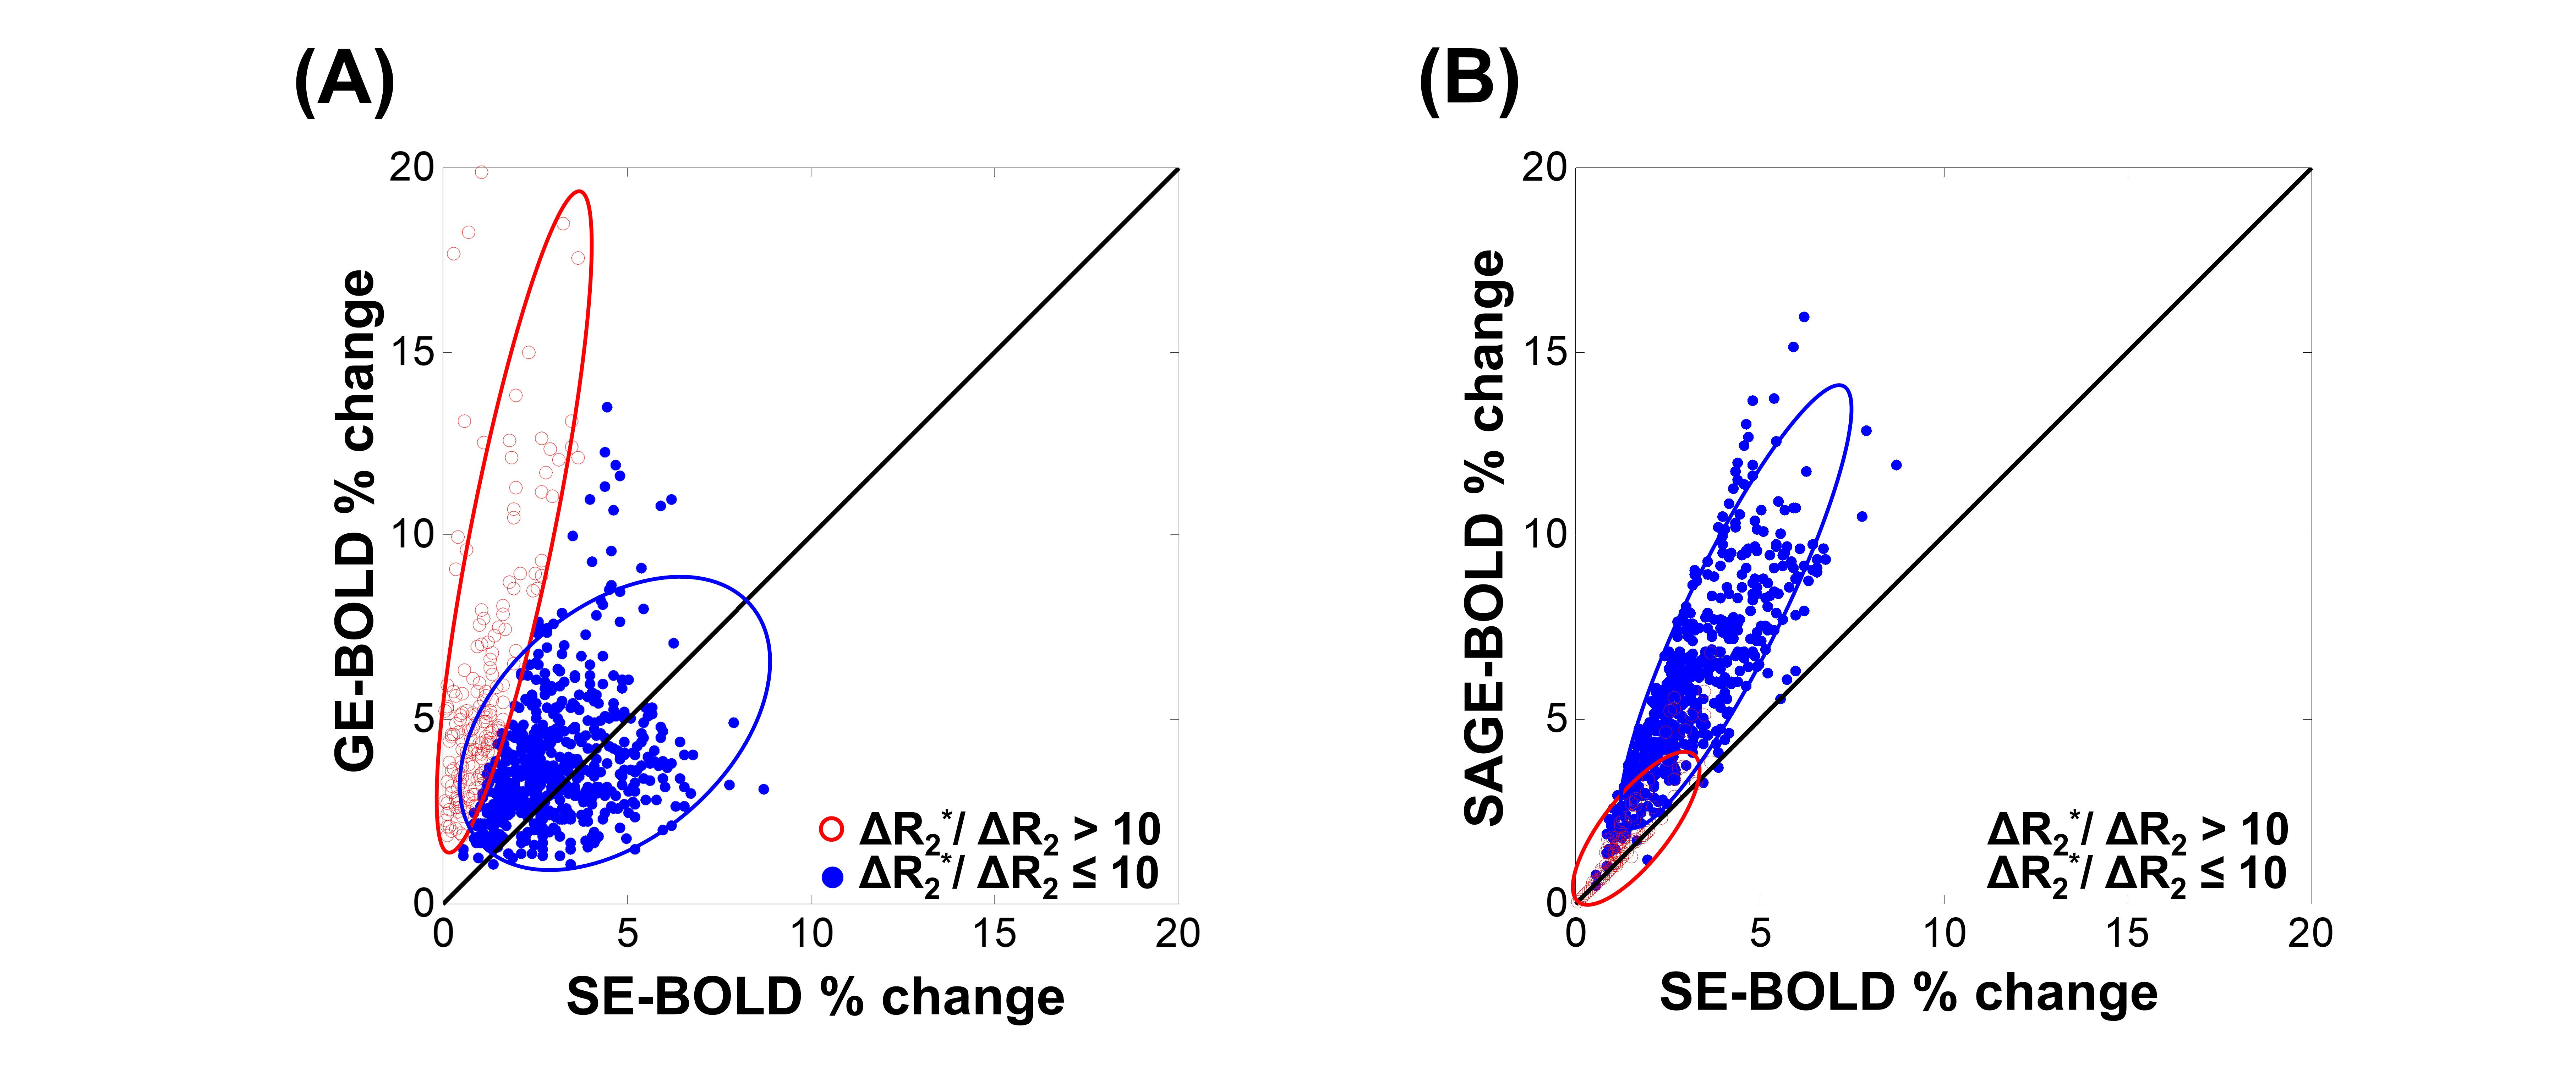
Fig 2. (A)
Scatter plot between SE-BOLD and GE-BOLD percent signal changes. (B) Scatter plot between SE-BOLD and SAGE-BOLD percent
signal changes. Two groups are: macro-vessel area (ΔR2*/ΔR2 >
10) and micro-vasculature area (ΔR2*/ΔR2 ≤
10) in red open circles and filled blue circles, respectively.
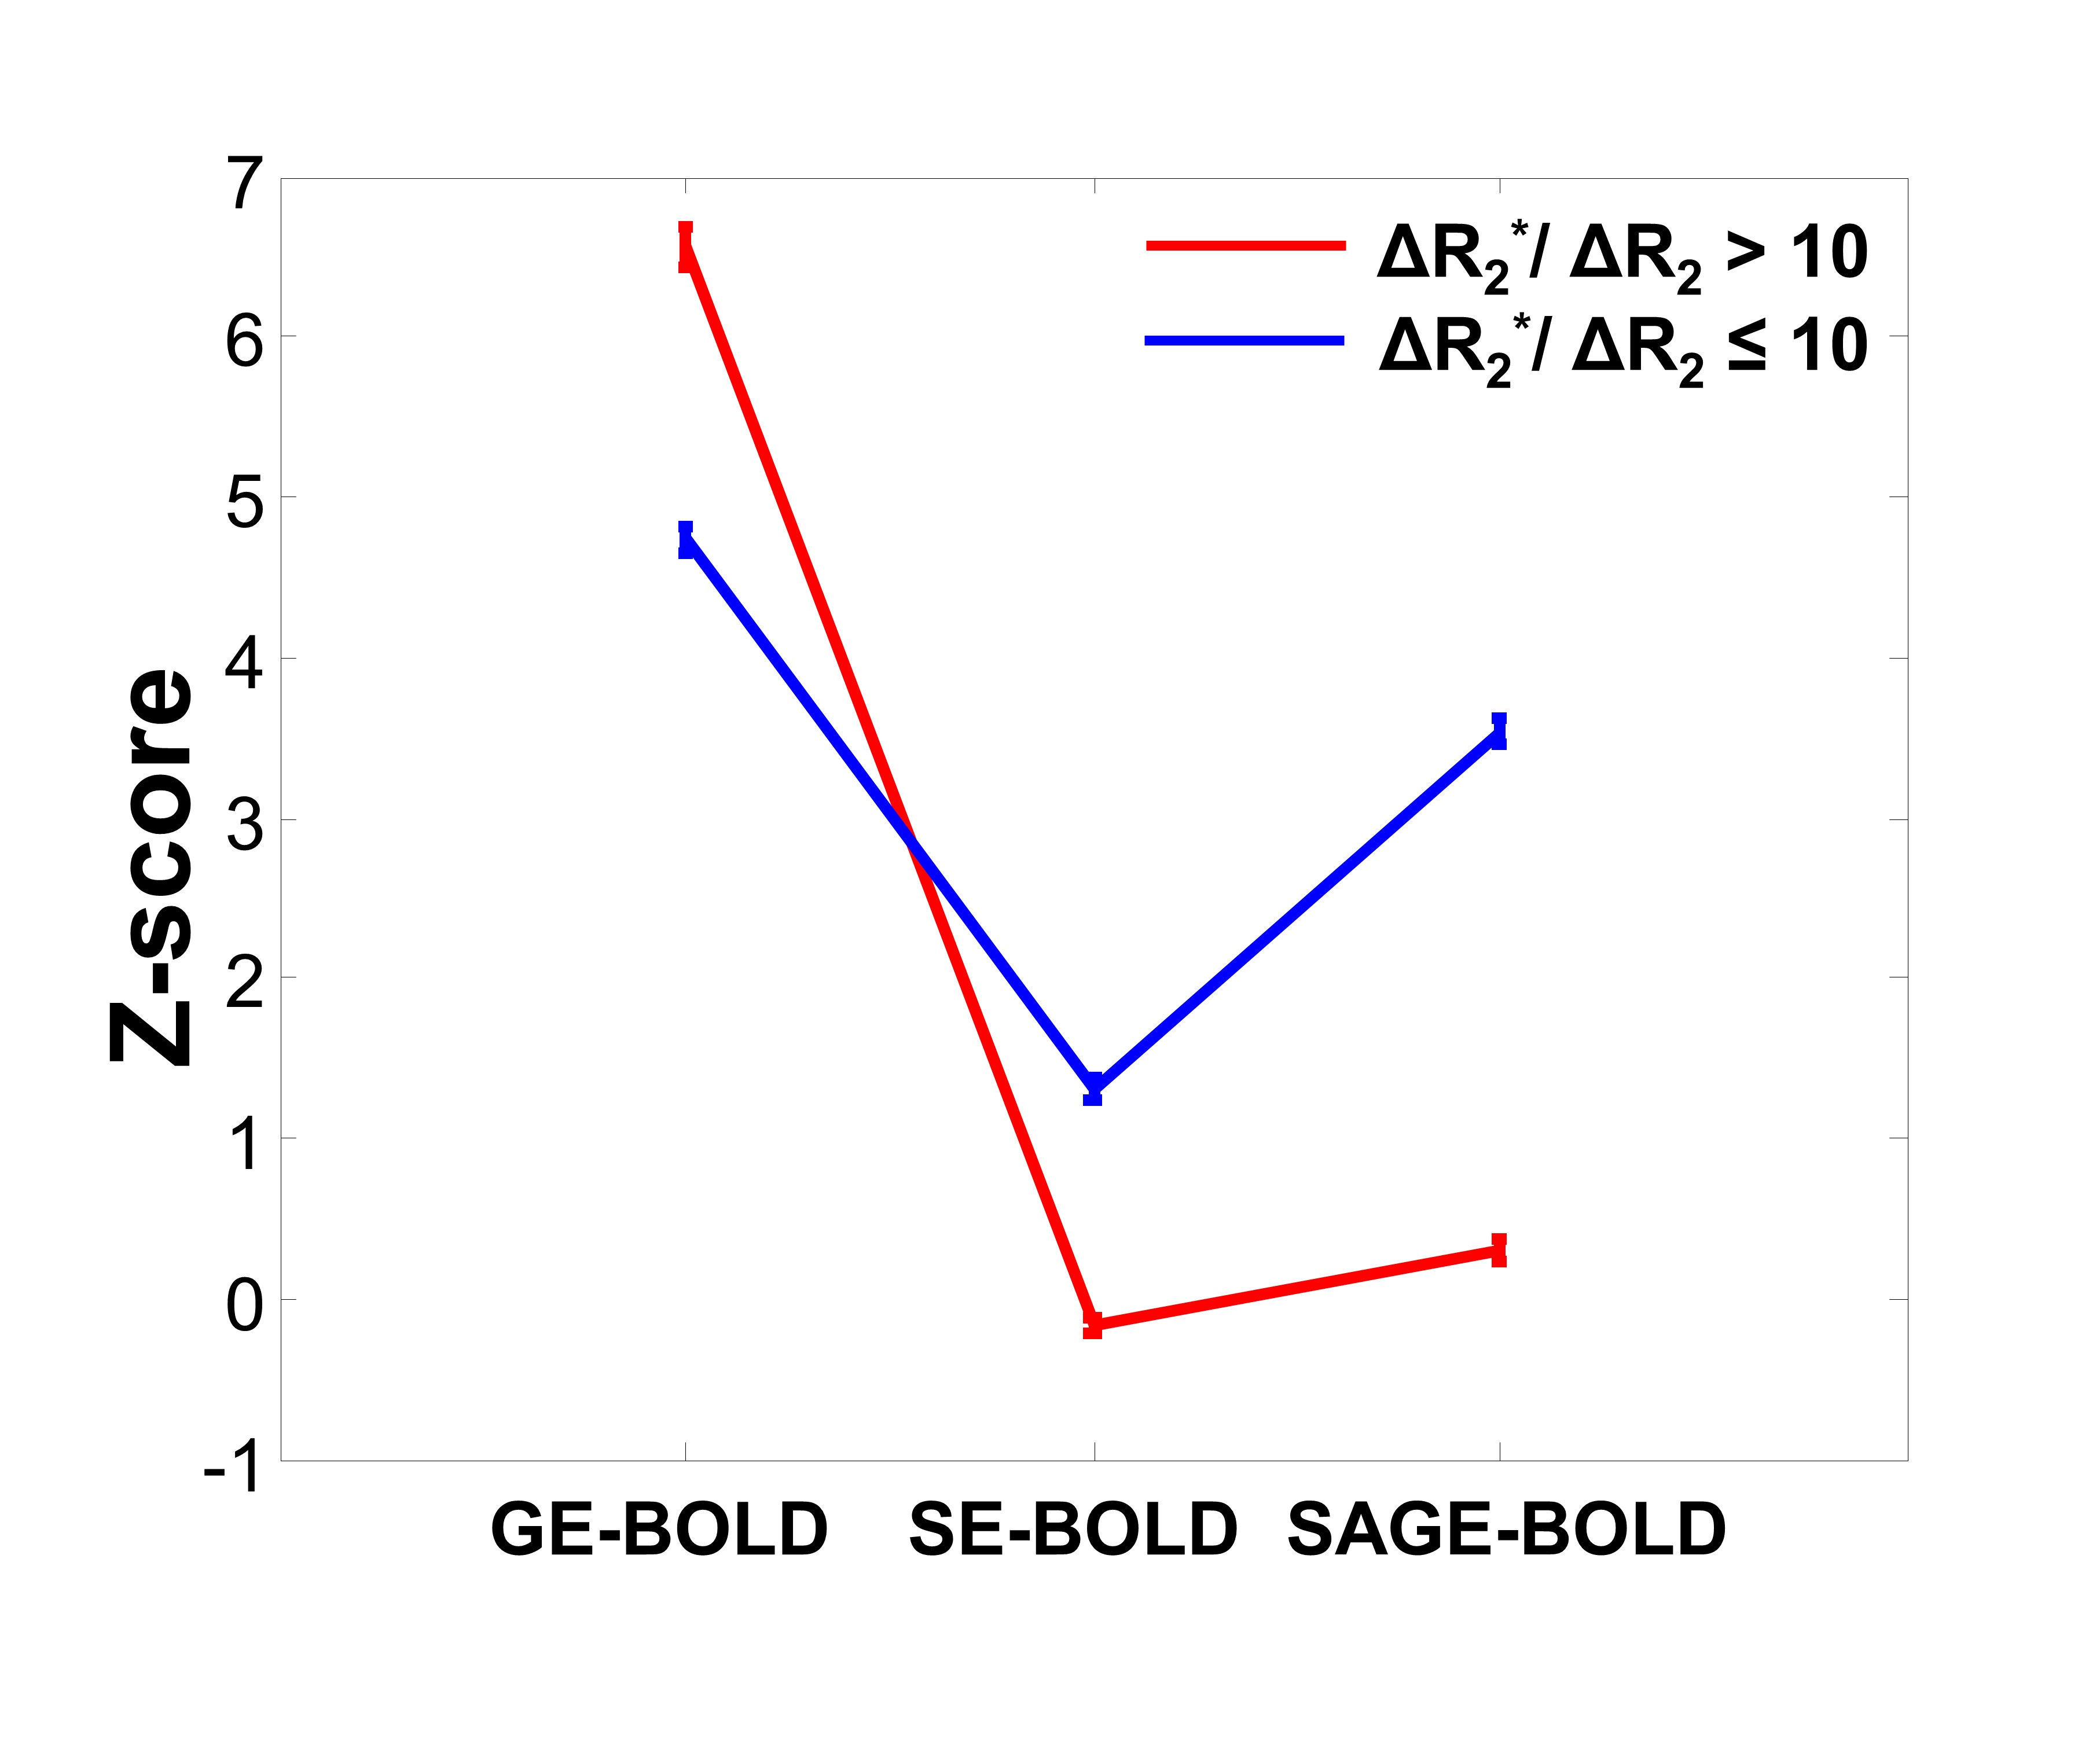
Fig 3. Z-score values across six subjects. Error
bars on graphs: standard errors of mean (SEM). Two groups are: macro-vessel area (ΔR2*/ΔR2 >
10) and micro-vasculature area (ΔR2*/ΔR2 ≤
10) in red and blue colored lines, respectively.
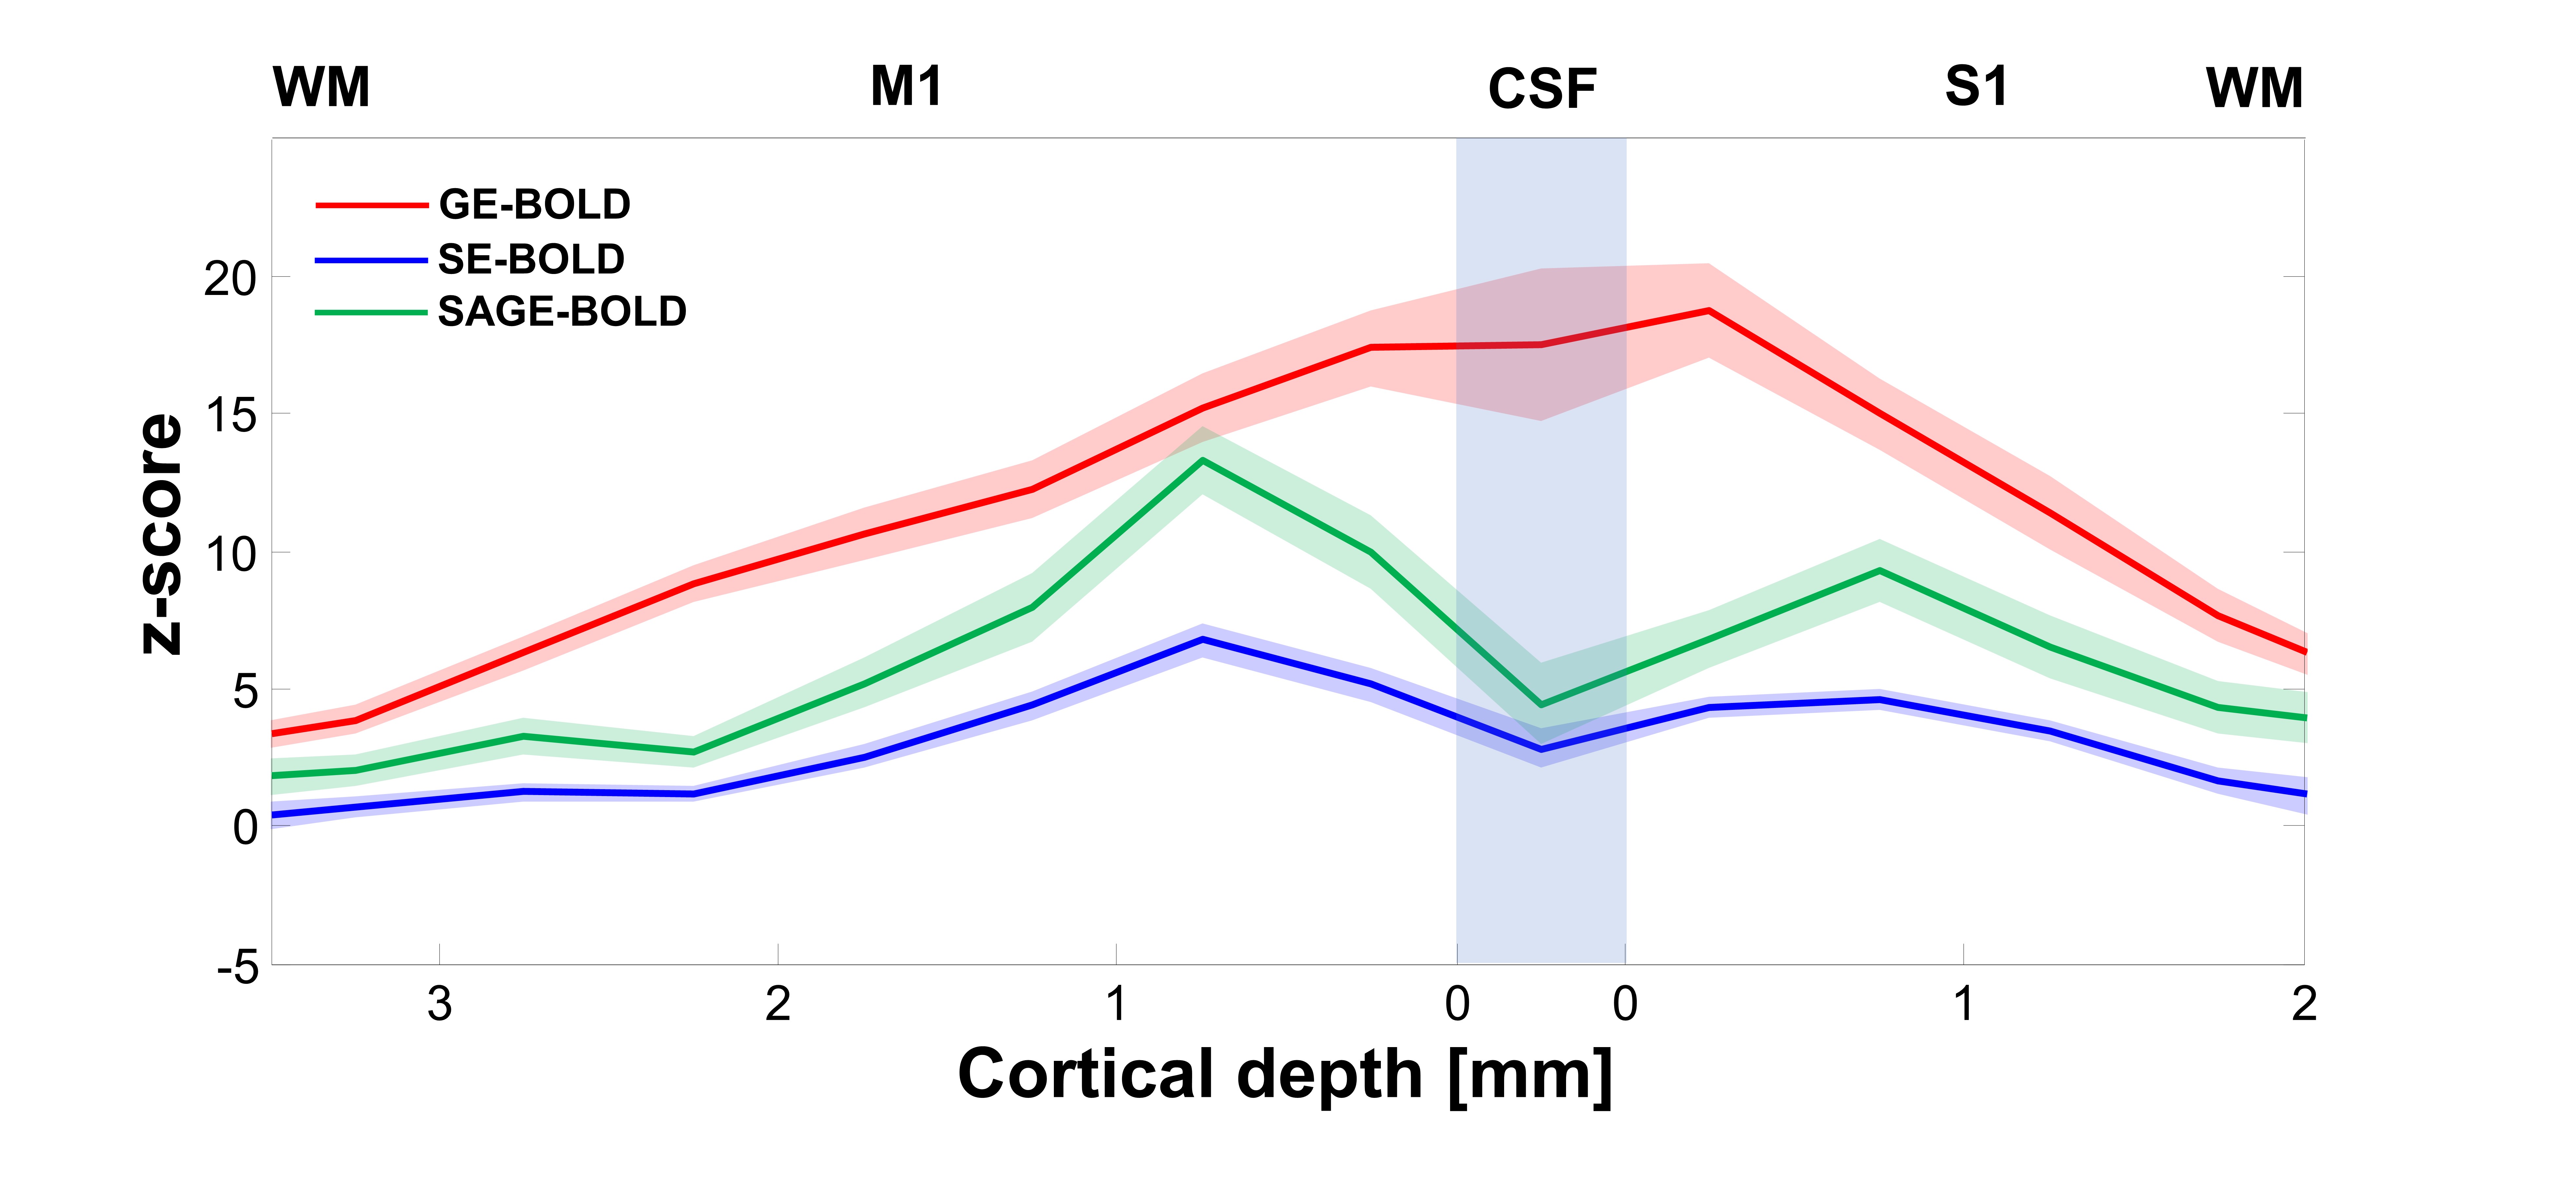
Fig 4. Z-score cortical
profiles in M1 and S1 were obtained from individual subjects. Averaged
cortical profiles were plotted with solid lines and shaded lines representing
SEM. The GE-BOLD signal peaks in the vicinity of the cortical surface and
decreases with cortical depth, whereas the SAGE-BOLD responses have its peak at
~ 0.8 mm depth within both M1 and S1 gray matter.
DOI: https://doi.org/10.58530/2022/2985