2984
7 T CBV fMRI reveal cortical microcircuits of bottom-up saliency in the human brain1Second Xiangya Hospital,Central South University, Changsha, China, 2Institute of Biophysics, Chinese Academy of Sciences, Beijing, China, 3University of T ̈ubingen, Max Planck Institute for Biological Cybernetics, T ̈ubingen, Germany
Synopsis
Using a slab-selective VASO sequence at 7 T, we investigate cortical depth-dependent CBV fMRI activity to orientation-defined saliency stimuli in early visual and parietal cortices of the human brain. Results show that the fMRI response of salient foreground bars is strongest in the superficial depth of V1, and peaks in the middle cortical depth of V2/V3 and IPS. These findings support the hypothesis that bottom-up saliency is initially created by iso-feature suppressions through lateral connections in V1 superficial layers, and then feedforward to parietal cortex to generate the attention priority map.
Purpose
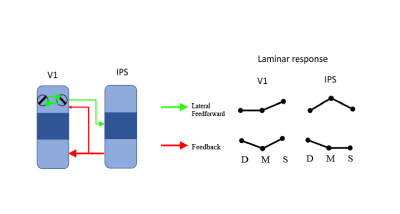
A visual item in sharp contrast with its neighbors in a simple feature, such as color or orientation, automatically captures attention. It has been proposed that the center-surround mechanisms in the primary visual cortex (V1) create a map of bottom-up saliency signals from raw visual inputs, which are then received by higher order areas such as intrapatietal sulcus (IPS) or the superior colliculus to guide attention and gaze to the salient object1(Fig1). An alternative account suggests that the saliency map initially emerges in the frontoparietal areas, and then modulates early visual activity through feedback connections2. To distinguish these two hypotheses and to reveal the cortical microcircuits for bottom-up saliency in the human brain, we investigated cortical layer-dependent CBV (cerebral blood volume) fMRI activity to orientation-defined saliency stimuli in early visual and parietal cortices using a slab-selective VASO (vascular space occupancy) sequence at 7 T.Methods
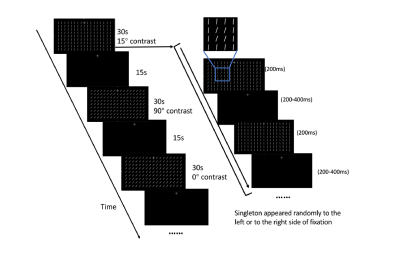
Fourteen subjects participated in the fMRI experiment. Before fMRI experiment, subjects performed a behavioral experiment with staircase procedure to measure the subjects’ contrast detection performance. Figure 2 shows the stimuli and procedure for the orientation saliency fMRI experiment. The orientation contrast between the four foreground bars and the uniformly oriented background bars was presented at 0, 15, or 90 degrees. Stimuli of three orientation contrast conditions were presented in separate 30-second blocks (6 blocks for each run), interleaved with 8 15-second fixation periods. Subjects were instructed to keep fixating on a fixation cross, and count the random luminance change of the cross during an entire run. One stimulus block consisted of 60 bar displays, each lasting 200ms followed by 200/300/400 ms of fixation. In each block, the foreground bars were randomly presented to the left or the right of the fixation cross. The region of interests (ROIs) in early visual areas and IPS for the foreground bar locations were localized by presenting colored natural Images at 4Hz at these locations. Each subject participated in nine runs of the orientation saliency stimuli and 2 runs of the localizer stimuli. MRI data were collected on a 7 T scanner (SIEMENS MAGNETOM) with a 32-channel receive 1-channel transmit head coil (NOVA medical). Subjects used bite-bars to restrict head motion. Functional data of CBV/BOLD were acquired with a SS-SI-VASO sequence (0.82mm isotropic voxels, TE=25ms, 26 slices, pair-TR=5s, PF=6/8 with POCS #8, FLASH-GAPPA=3, 3D-EPI readout). T1 weighted anatomical volumes were acquired using MP2RAGE sequence(0.7 mm isotropic voxels, FOV=224×224 mm, 256 sagittal slices, TE=3.05 ms, TR=4000 ms, TI1=750 ms, 4° flip angle, TI2=2500 ms, 5° flip angle, bandwidth=240 Hz/pix, 7/8 phase partial Fourier, 7/8 slice partial Fourier, GRAPPA=3). MRI data were analyzed using AFNI/SUMA, FreeSurfer and LAYNII3. Cortical gray matter was sub-divided into three equi-volume layers for the depth-dependent analysis. Standard GLM was used to extract the stimulus-evoked signal changes in the ROIs.Results
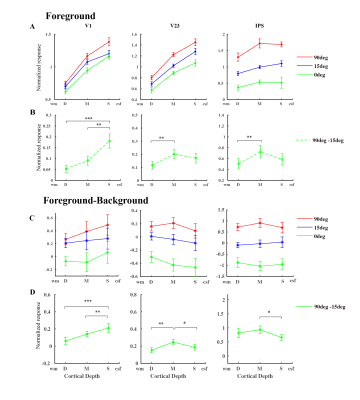
Figure.3A shows the normalized CBV responses in the foreground ROIs to the three orientation contrast conditions. For each ROI of a subject, CBV responses were normalized by the mean response across all cortical depth and orientation contrast conditisons. The CBV response of early visual areas is biased to the superficial depth, while IPS shows a relatively flat response profile across cortical depth. In all cortical areas, higher orientation contrast shows stronger fMRI response. To minimize the influence of top-down priority signals, we calculated the saliency response as the difference between the response to the 90 degree and that to the 15 orientation contrast conditions. In figure.3B, the saliency signal in V1 was significantly stronger in the superficial depth than the middle and deep cortical depths. While in V2/V3 and IPS, saliency signals peaked in the middle cortical depth. Figure.3C and 3D shows the difference between the responses to the foreground bars and those to the background bars. Again, across different depths, these differences were strongest in the superficial depth in V1 but in the middle cortical depth in V2/V3 and IPS.Discussion and Conclusion
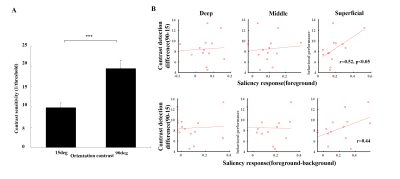
Orientation-saliency response was strongest in the superficial depth of V1, and peaked the middle cortical depth of V2/V3 and IPS. Orientation-saliency response in superficial depth of V1 was correlated with contrast detection performance. This finding supports the hypothesis that bottom-up saliency map was initially created by iso-feature suppressions through lateral inhibitions in V1 superficial layers, and then projecting to higher order parietal areas IPS through the feedforward pathway to generate the attention priority map.Acknowledgements
No acknowledgement found.References
1. Zhang, X., Zhaoping, L., Zhou, T., & Fang, F. (2012). Neural activities in V1 create a bottom-up saliency map. Neuron, 73(1), 183-192.
2. Bisley, J. W., & Goldberg, M. E. (2010). Attention, intention, and priority in the parietal lobe. Annual review of neuroscience, 33, 1-21.
3. Huber, L. R., Poser, B. A., Bandettini, P. A., Arora, K., Wagstyl, K., Cho, S., ... & Gulban, O. F. (2021). LAYNII: a software suite for layer-fMRI. NeuroImage, 237, 118091.
Figures


Figure2.Schematic diagram and procedure of fMRI experiment

