2981
Analysis of Dynamic Function Connectivity in a Normal Rat Model After Focused Ultrasound-Neuromodulation in VPM/VPL
Yu-Chieh Hung1, Yi-Cheng Wang1, Hao-Li Liu2, and Hsu-Hsia Peng1
1Department of Biomedical Engineering and Environmental Sciences, National Tsing Hua University, Hsinchu, Taiwan, 2Department of Electrical Engineering, National Taiwan University, Taipei, Taiwan
1Department of Biomedical Engineering and Environmental Sciences, National Tsing Hua University, Hsinchu, Taiwan, 2Department of Electrical Engineering, National Taiwan University, Taipei, Taiwan
Synopsis
Focused ultrasound (FUS) has been considered as a noninvasive neuromodulation method. In addition to evaluate the functional connectivity (FC) by an average of BOLD signals across the whole scan, a dynamic FC (dFC) can help to comprehend the instant alternation of FC. We aimed to investigate the alterations of dFC after FUS-neuromodulation at VPM/VPL in a normal rat model.
We used k-means and dynamic network analyses to evaluate changes of dFC at Pre-FUS, Sham, 35-min, 3-hr, and 3-day for rats with FUS sonication at VPM/VPL. We found an instant effect of FUS-neuromodulation (35-min) and a recovering trend in 3-day.
Introduction
Focused ultrasound (FUS) has been considered as a noninvasive neuromodulation method because of the advantages of penetration depth and high spatial precision1. Low-intensity FUS-stimulation was proposed to alternate neural activity by stretching membrane and opening ion channel2,3. Ventral posteromedial and ventral posterolateral thalamic nuclei (VPM/VPL) were thalamus regions. A previous study reported that FUS sonication at thalamus leads to increase level of extracellular dopamine, implying the potential of ameliorating symptoms of Parkinson's disease4.Resting state fMRI (rs-fMRI) is a non-invasive approach of measuring neural activity. Most of studies calculated the correlation of BOLD signals averaged across the whole scan as functional connectivity (FC) between different brain regions. However, a previous study indicated that FC is a dynamic process during a period of examinations5. Accordingly, dynamic functional connectivity (dFC) is suggested as an effective approach to comprehend short-term FC changes.
In this study, we aimed to investigate the alterations of dFC after FUS-neuromodulation at VPM/VPL in a normal rat model.
Methods
Thirty-four adult male Sprague-Dawley rats (8-12 weeks, 300-420 g) divided into five groups: 7 rats without FUS stimulation (Pre-FUS), 7 rats with FUS stimulation at nose (Sham) for evaluation of FUS effect on auditory system, rats with acquisition of rs-fMRI after 35-min (7 rats), 3-hr (7 rats), and 3-day (6 rats) of FUS stimulation at VPM/VPL in left thalamus (35-min, 3-hr, 3-day group).A single-element transducer (RK300, FUS instrument) delivered FUS pulses in a burst mode. The FUS protocol, which can induce neuromodulation6, was with pulse repetition frequency=100 Hz, peak negative pressure amplitude=0.25 MI, duty cycle=30%, stimulation paradigm: 30-sec on and 90-sec off for 5 cycles, totally 600 seconds. All MRI images were acquired in a 7-Tesla MR scanner (ClinScan, Bruker). The scanning parameters of GE-EPI were: TE/TR=20ms/1000ms, FOV=30×30mm2, matrix size=64×64, slice thickness=1mm, number of slices=15, and 300 volumes.
Figure 1 illustrates the flowchart of generating dFC maps. The 36 ROIs in rat brain were selected as in previous study7. The preprocessing steps for BOLD signals included realignment, coregistration, slice-timing correction, smoothing, detrend, and band-pass filtering with range of 0.01-0.08 Hz. The dFC analysis was performed with sliding window approach (window width=33 s, 1 s per step) and Pearson’s correlation coefficients of BOLD signals were computed among 36 ROIs.
Figure 2 demonstrates K-means clustering analysis and graph theoretical network. K-means clustering (cluster number=4 (elbow method8), L1 distance, repeated 500 times) was used to classify all dFC maps of 34 rats. An index of probability% indicates occurrence percentages of a specific state. The mean dwell time denotes average numbers of consecutive windows assigned to a specific state. The standard deviation (SD) of global efficiency (Eg) and local efficiency (Eloc) evaluated the variability in functional network based on graph-theory (edge density thresholds=20% to 50% with a 5% interval)9.
Kruskal-Wallis test and post-hoc test were used when appropriate. A p<0.05 was considered as statistically significant.
Results
Figure 3a displays four representative states clustering from dFC maps of Pre-FUS, Sham, 35-min, 3-hr, and 3-day groups. In Figure 3b, the probability% of State 1 has an increased trend from Pre-FUS (1%) to 35-min (13%) and decreasingly recover to almost 0% in 3-day group. By contrast, the 35-min group exhibited significantly decreased probability% of State 3 in comparison to Pre-FUS (12% vs. 42%, p<0.05) and maintained as a decreased probability% till 3-day. In Figure 3c, the changes of mean dwell time in State 1 and State 3 exhibited similar trends as in probability%. Of note, 35-min group presented significantly decreased mean dwell time of State 3 in comparison to Pre-FUS (37.9±32.2(windows) vs. 7.9±7.4(windows), p<0.05).In Figure 4, 35-min group possessed increased trends of SD of Eg and Eloc in comparison with Pre-FUS and this trend diminished with time, particular in SD of Eg (35-min vs. 3-day: 0.14±0.07 vs. 0.06±0.02). There are no significant changes of probability%, dwell time, and SD of Eg and Eloc in Sham group.
Discussion and Conclusions
In this study, we used k-means and dynamic network analyses to evaluate changes of dFC at Pre-FUS, Sham, 35-min, 3-hr, and 3-day for normal rats with FUS sonication at VPM/VPL. We found an instant effect of FUS-neuromodulation (35-min) and a recovering trend in 3-day.After FUS stimulation at VPM/VPL, dFC map of State 3 exhibited decreased probability% and mean dwell time. State 3 presented relatively strong positive FC among somatosensory system, visual system, DMN and negative FC between DMN and partial somatosensory regions. A previous study reported that patients with Parkinson’s disease possessed increased probability% and mean dwell time in a state with similar feature in comparison with healthy controls10. Therefore, the response of dynamic FC after FUS sonication at VPM/VPL might reveal the potential of using FUS stimulation to modulate FC of brain in patients with Parkinson’s disease.
Eg and Eloc were considered as measures of integration and segregation11. We observed high variability of Eg and Eloc in 35-min, suggesting more efficient and adaptive communication12 between different brain regions after FUS sonication.
In conclusion, the obvious and temporary changes of dFC suggested the potential of FUS for neuromodulation at VPM/VPL.
Acknowledgements
No acknowledgement found.References
- Lee, Stephen A., et al. "Displacement imaging for focused ultrasound peripheral nerve neuromodulation." IEEE transactions on medical imaging 39.11 (2020): 3391-3402.
- Kubanek, Jan, et al. "Ultrasound elicits behavioral responses through mechanical effects on neurons and ion channels in a simple nervous system." Journal of Neuroscience 38.12 (2018): 3081-3091.
- Kubanek, Jan, et al. "Ultrasound modulates ion channel currents." Scientific reports 6.1 (2016): 1-14.
- Min, Byoung‐Kyong, et al. "Focused ultrasound modulates the level of cortical neurotransmitters: potential as a new functional brain mapping technique." International Journal of Imaging Systems and Technology 21.2 (2011): 232-240.
- Filippi, Massimo, et al. "Resting state dynamic functional connectivity in neurodegenerative conditions: a review of magnetic resonance imaging findings." Frontiers in neuroscience 13 (2019): 657.
- Chen, Sin-Guang, et al. "Transcranial focused ultrasound pulsation suppresses pentylenetetrazol induced epilepsy in vivo." Brain stimulation 13.1 (2020): 35-46.
- Todd, Nick, et al. "Focused ultrasound induced opening of the blood-brain barrier disrupts inter-hemispheric resting state functional connectivity in the rat brain." Neuroimage 178 (2018): 414-422.
- Allen, Elena A., et al. "Tracking whole-brain connectivity dynamics in the resting state." Cerebral cortex 24.3 (2014): 663-676.
- Christiaen, Emma, et al. "Dynamic functional connectivity and graph theory metrics in a rat model of temporal lobe epilepsy reveal a preference for brain states with a lower functional connectivity, segregation and integration." Neurobiology of disease 139 (2020): 104808.
- Kim, Jinhee, et al. "Abnormal intrinsic brain functional network dynamics in Parkinson’s disease." Brain 140.11 (2017): 2955-2967.
- Rubinov, Mikail, and Olaf Sporns. "Complex network measures of brain connectivity: uses and interpretations." Neuroimage 52.3 (2010): 1059-1069.
- Schumacher, Julia, et al. "Dynamic functional connectivity changes in dementia with Lewy bodies and Alzheimer's disease." NeuroImage: Clinical 22 (2019): 101812.
Figures

Figure
1. The flowchart of computing correlation
coefficients of functional connectivity (FC) maps. (a) The determined 36 ROIs
of rat brain. (b) Extracting
BOLD signal from each ROI. (c) To evaluate
dynamic FC maps, a sliding window
was performed to calculate Pearson’s
correlation coefficients among 36 ROIs.
(d) 36 ROIs were divided into 9 groups on FC map
according to their function.
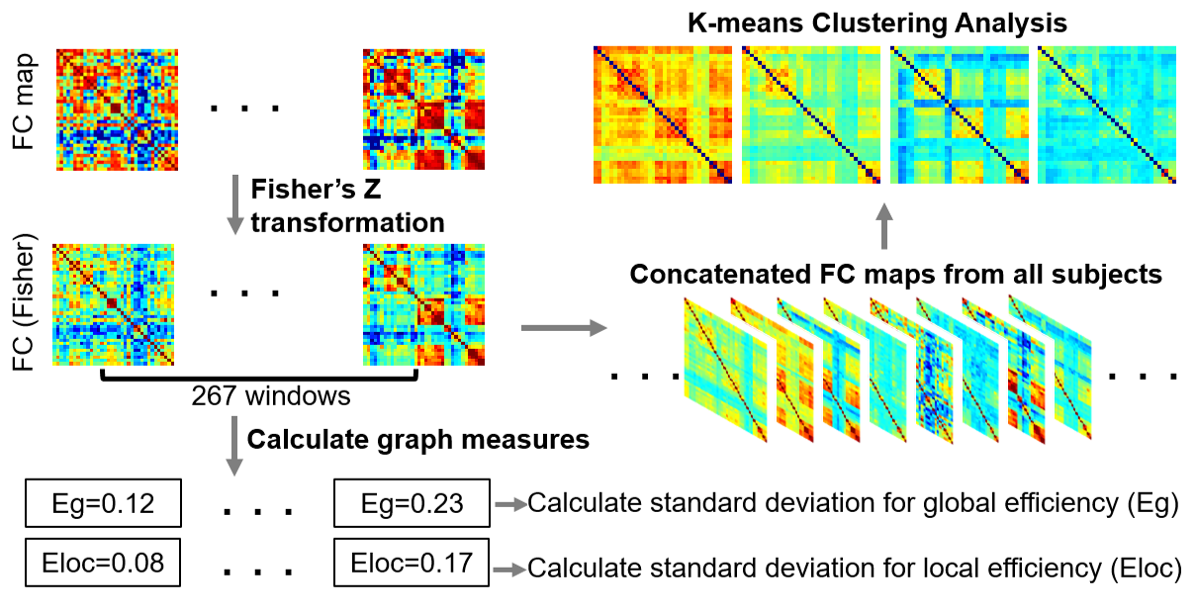
Figure
2. The flowchart of analysis steps. Each
FC map was transformed to z-value by Fisher’s Z transformation. K-means
clustering was used to classify all dynamic FC maps of 34 rats. Global
efficiency (Eg)
and local efficiency (Eloc) were separately computed for each
time window, and standard deviation of the measures over the 267 windows were calculated.

Figure
3. Results
from K-means clustering analysis. (a) Four representative states clustering
from dFC maps
of Pre-FUS, Sham, 35-min, 3-hr, and 3-day groups. (b, c) The probability% and
the mean dwell time in 4 states of each group. *p<0.05 (from post-hoc
tests).
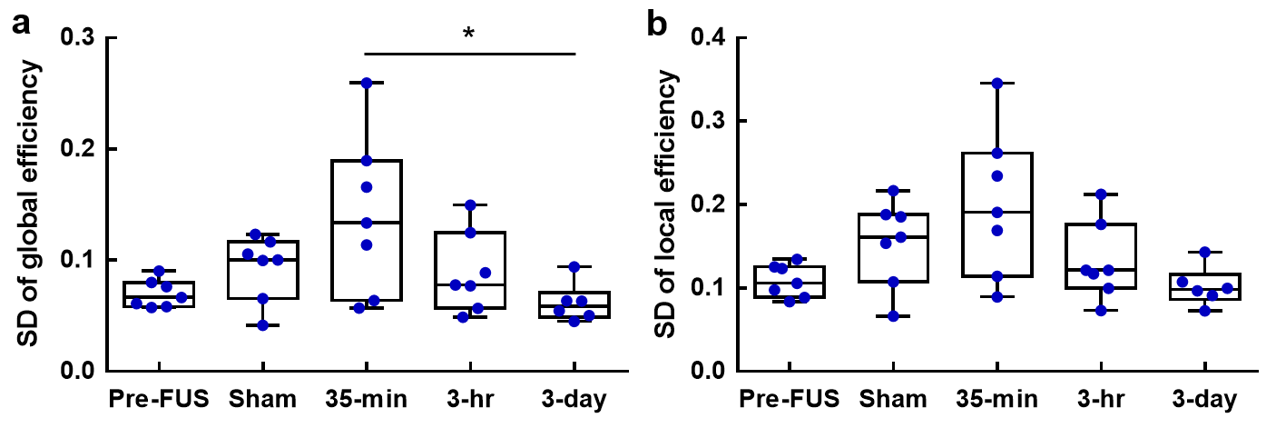
Figure
4. Results
from the dynamic network analysis. The standard deviation of global efficiency
(a) and local efficiency (b) of
Pre-FUS, Sham, 35-min, 3-hr, and 3-day groups. *p<0.05 (from post-hoc tests).
DOI: https://doi.org/10.58530/2022/2981