2980
Focused ultrasound-modulated left dorsolateral prefrontal cortex of the non-human primate assessed by functional MRI1Interdisciplinary Institute of Neuroscience and Technology, School of Medicine, Zhejiang University, Hangzhou, China, 2College of Biomedical Engineering & Instrument Science, Zhejiang University. Interdisciplinary Institute of Neuroscience and Technology, Zhejiang University, Hangzhou, China, 3Department of Biomedical Engineering, National Yang Ming University, No. 155, Section 2, Linong Street, Taipei, 112, Taiwan, ROC. Department of Biomedical Engineering, National Yang Ming Chiao Tung University, No. 1001 Ta-Hsueh Rd., Hsinchu, 300, Taiwan, ROC, Taiwan, China, 4College of Biomedical Engineering & Instrument Science, Zhejiang University. Department of Neurology of the Second Affiliated Hospital, Interdisciplinary Institute of Neuroscience and Technology, School of Medicine, Zhejiang University. Department of Neurology of Sir Run Run Shaw Hospital, School of Medicine, Zhejiang University, Hangzhou, China
Synopsis
Focused ultrasound (FUS) has shown its unique advantages in the field of non-invasive neuromodulation. The dorsolateral prefrontal cortex (DLPFC) is a key node in brain networks involved in cognitive, emotional and sensory processing. Here we evaluated the immediate and latency effects of DLPFC-FUS by functional magnetic resonance imaging (fMRI). The results showed that DLPFC-FUS induced a 3% increase in positive BOLD signal, and decreased FCs in bilateral primary and secondary visual cortices, supported by visual stimuli-evoked BOLD change. Moreover, FCs significantly decreased in left thalamus at 5-min post-FUS and in bilateral anterior cingulate cortex (ACC) at 30-min post-FUS. These results may help to elucidate the effect of FUS neuromodulation.
Introduction
In the recent years, focused ultrasound (FUS) has attracted extensive attention for non-invasive neuromodulation. FUS has advantages of high penetration1 and high spatial resolution2 compared to transcranial magnetic stimulation (TMS)3 and transcranial direct current stimulation (TDCS)4 for non-invasive neuromodulation. In primates, the dorsolateral prefrontal cortex (DLPFC) is interconnected with almost all sensory systems (visual, auditory, somatosensory, etc.)5, cortical and subcortical motor systems, as well as limbic and midbrain structures related to emotion, memory and reward6, plays a central role in executive control function. In addition, DLPFC is a possible target for treatment of major depressive disorder7 and dyskinesias in Parkinson ’s disease8. However, the mechanisms in a whole brain functional connectivity induced by DLPFC-FUS are unclear. In this study, we used a lab-designed 7T MRI-compatible FUS transducer to stimulate DLPFC in non-human primate (NHP) and evaluated the immediate and latency effects by the evoked-blood oxygenation level dependent (BOLD) and resting-state functional magnetic resonance imaging (fMRI), respectively, using 7T MRI.Methods
Each macaque (n=3) was initially anesthetized with ketamine (10 mg/kg), and then maintained with isoflurane (0.1-0.3%), ketamine (0.1 mg/kg*h) and vecuronium (0.1 mg/kg*h) during the MRI scan. The ventilation volume and rate were adjusted to maintain EtCO2 and SPO2 above 96%, and a circulated warm water pad was used to maintain rectal temperature at 37±0.5°C during the experiment. A lab-designed MRI-compatible FUS transducer with center frequency of 300 kHz (Figure 1A) was placed on the left DLPFC (+40 mm rostral to EBZ, -20 mm lateral to midline) of the macaque (Figure 1B). FUS stimulation parameter was mechanical index of 1.0, 200-ms burst duration, pulse-repetition frequency of 500 Hz, and 50% burst duty cycle for a block-design with 40-s initial rest, 20-s stimulation, followed by 40-s rest. The visual stimulus with 36-s initial rest, 36-s stimulation, followed by 36-s rest were performed pre-FUS and 15-min post-FUS to evaluate the enhancement of visual function. MRI images were acquired with a 7T Magnatom research system (Siemens Healthcare, Germany) with prototype sequences, including a T2-weighted turbo spin echo (TSE) sequence (TR = 6000 ms, TE = 18 ms, BW = 100 Hz, voxel size: 0.5×0.5×1.5 mm3) and a multiband echo-planar imaging (EPI) sequence (TR = 2000 ms, TE = 24.2 ms, BW = 1710 Hz, voxel size: 1.5×1.5×1.5 mm3). The fMRI data was processed in Analysis of Functional NeuroImages (AFNI: 21.0.02)9. For BOLD fMRI, correlation coefficient (CC) map was performed by correlating BOLD time courses to the stimulus paradigm, with a significance level at p < 0.001 (Bonferroni corrected). For resting-state fMRI, functional connectivity (FC) was calculated with seed-based method in the left DLPFC and other brain regions. Pattern comparison of FC was computed by Pearson CC and converted to z-score using Fisher's transformation. Statistical analysis employed Student’s t-test by SPSS software (version 18.0, SPSSInc., USA), with p < 0.05 indicating statistical significance. All data were expressed as mean ± square error mean.Results and Discussion
BOLD response in left DLPFC was positive (red color) and produced up to 3% BOLD signal change by FUS stimulation (Figure 2). Seed-based resting-state fMRI FC matrices between left DLPFC and other brain regions for pre-FUS, 5-min post-FUS and 30-min post-FUS (Figure 3A). Figure 3B showed significantly decreased FCs in bilateral primary and secondary visual cortices after FUS stimulation. The latency effect in left visual cortices was longer than that in right visual cortices. Furthermore, FCs significantly decreased in left thalamus at 5-min post-FUS and in bilateral anterior cingulate cortex (ACC) at 30-min post-FUS (Figure 3C). Visual stimuli-evoked BOLD fMRI further exposed FUS-modulated DLPFC could alter neural activity in bilateral visual cortices (Figure 4). Previous studies supposed the FUS stimulation might induce potential auditory or somatosensory effects within ten minutes10,11, however, we didn’t find FC changes in somatosensory and auditory cortices. Although there was no significant FC change in ACC at 5-min post-FUS, FC significantly decreased in bilateral ACC at 30-min post-FUS. Consistent with a previous study, FUS stimulation at ACC decreased FCs between ACC and DLPFC at 30-min post-FUS12. DLPFC-thalamus circuit is involved in visual working memory13 that may explain visual functions alteration induced by DLPFC-FUS. These results indicated latency effects may be distinct for different brain functional circuits. Therefore, continuous follow-up may find out relationships between DLPFC and the rest of brain, and clarify the mechanism and neuroplasticity caused by FUS, contributing to treatment of neurological and psychiatric disorders.Conclusion
This study proved for the first time demonstrated the immediate and latency effects of FUS stimulation at DLPFC in non-human primates by using 7T fMRI. In addition, evoked BOLD fMRI confirmed that DLPFC-FUS stimulation could enhance the visual cortices response. This study suggested that FUS as a non-invasive neuromodulation technique has great potential for clinical application.Acknowledgements
We acknowledge Zhejiang University 7 T Brain Imaging Research Center for all the help and support. The study was financially supported by National Key R&D Program of China (2018YFA0701400)References
1 Piper, R. J., Hughes, M. A., Moran, C. M. & Kandasamy, J. Focused ultrasound as a non-invasive intervention for neurological disease: a review. British journal of neurosurgery 30, 286-293, doi:10.3109/02688697.2016.1173189 (2016).
2 Darrow, D. P. Focused Ultrasound for Neuromodulation. Neurotherapeutics : the journal of the American Society for Experimental NeuroTherapeutics 16, 88-99, doi:10.1007/s13311-018-00691-3 (2019).
3 Bolognini, N. & Ro, T. Transcranial magnetic stimulation: disrupting neural activity to alter and assess brain function. The Journal of neuroscience : the official journal of the Society for Neuroscience 30, 9647-9650, doi:10.1523/jneurosci.1990-10.2010 (2010).
4 Bhattacharya, A. et al. An Overview of Noninvasive Brain Stimulation: Basic Principles and Clinical Applications. The Canadian journal of neurological sciences. Le journal canadien des sciences neurologiques, 1-14, doi:10.1017/cjn.2021.158 (2021).
5 Barbas, H., Zikopoulos, B. & Timbie, C. Sensory pathways and emotional context for action in primate prefrontal cortex. Biological psychiatry 69, 1133-1139, doi:10.1016/j.biopsych.2010.08.008 (2011).
6 Miller, E. K. & Cohen, J. D. An integrative theory of prefrontal cortex function. Annual review of neuroscience 24, 167-202, doi:10.1146/annurev.neuro.24.1.167 (2001).
7 Barredo, J. et al. Multimodal Elements of Suicidality Reduction After Transcranial Magnetic Stimulation. Neuromodulation : journal of the International Neuromodulation Society 24, 930-937, doi:10.1111/ner.13376 (2021).
8 Rektorova, I., Sedlackova, S., Telecka, S., Hlubocky, A. & Rektor, I. Dorsolateral prefrontal cortex: a possible target for modulating dyskinesias in Parkinson's disease by repetitive transcranial magnetic stimulation. International journal of biomedical imaging 2008, 372125, doi:10.1155/2008/372125 (2008).
9 Cox, R. W. AFNI: software for analysis and visualization of functional magnetic resonance neuroimages. Computers and biomedical research, an international journal 29, 162-173, doi:10.1006/cbmr.1996.0014 (1996).
10 Sato, T., Shapiro, M. G. & Tsao, D. Y. Ultrasonic Neuromodulation Causes Widespread Cortical Activation via an Indirect Auditory Mechanism. Neuron 98, 1031-1041.e1035, doi:10.1016/j.neuron.2018.05.009 (2018).
11 Guo, H. et al. Ultrasound Produces Extensive Brain Activation via a Cochlear Pathway. Neuron 99, 866, doi:10.1016/j.neuron.2018.07.049 (2018).
12 Folloni, D. et al. Manipulation of Subcortical and Deep Cortical Activity in the Primate Brain Using Transcranial Focused Ultrasound Stimulation. Neuron 101, 1109-1116.e1105, doi:10.1016/j.neuron.2019.01.019 (2019).
13 Oyama, K. et al. Chemogenetic dissection of the primate prefronto-subcortical pathways for working memory and decision-making. Science advances 7, doi:10.1126/sciadv.abg4246 (2021).
Figures
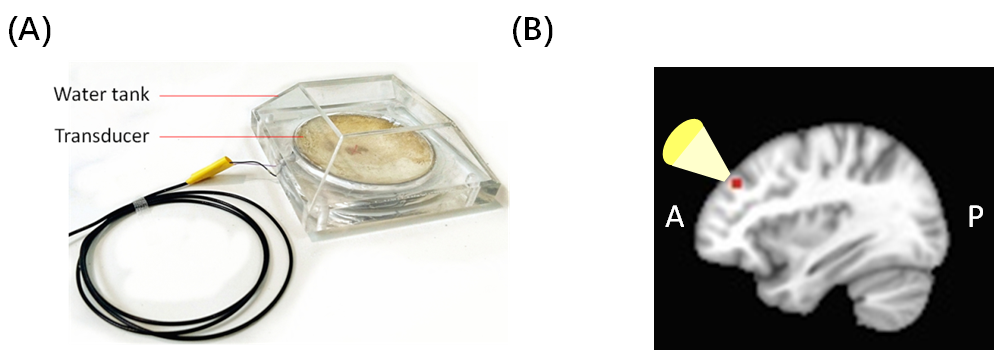
Figure 1 (A) A Lab-designed 7T MRI-compatible FUS transducer. (B) A sagittal view for FUS targeted at left DLPFC (red dot). A is for anterior; P is for posterior.
.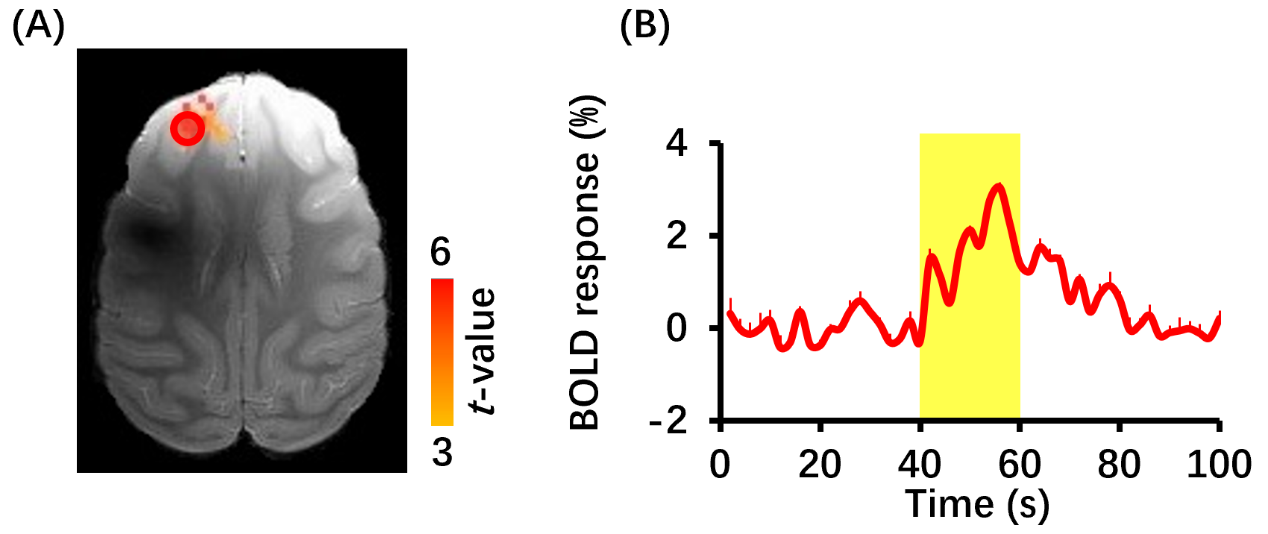
Figure 2 BOLD fMRI responses to FUS stimulation (n=3). (A) BOLD fMRI activation map. Responses were mainly located in left DLPFC. Red circle indicates region of interesting (ROI). (B) Time course of BOLD signal in the ROI. Yellow-shaded area indicates stimulus epoch. Error bars are square error mean.
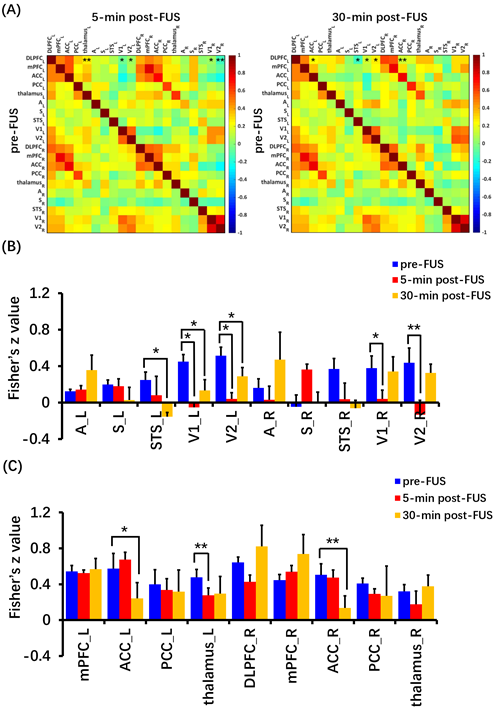
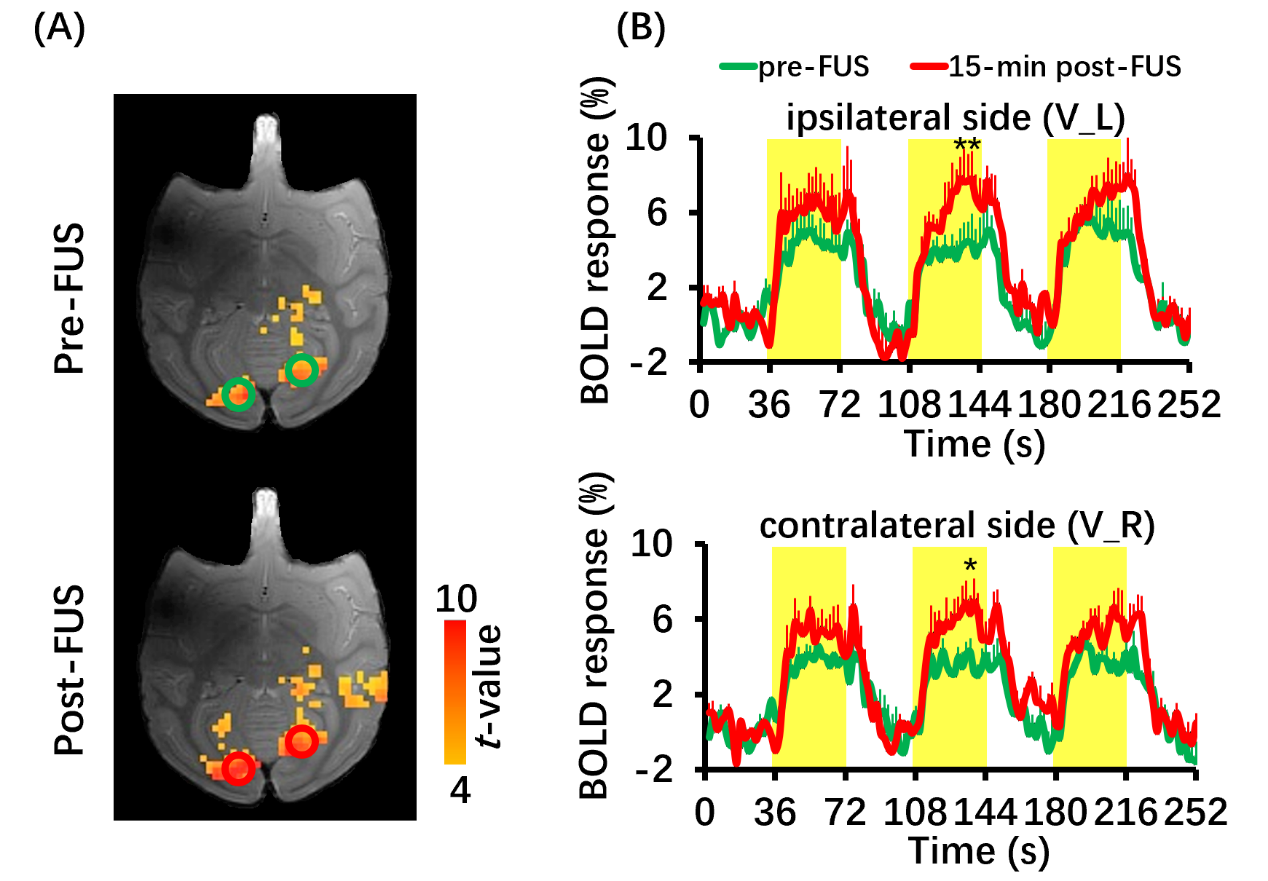
Figure 4 BOLD fMRI of visual stimuli (n=3). (A) BOLD activation maps to visual stimuli induced positive BOLD responses in bilateral visual cortices at pre-FUS and 15-min post-FUS. (B) Time courses of BOLD signal changes time of ipsilateral side and contralateral side at pre-FUS (green line) and 15-min post-FUS (red line). Yellow-shaded area indicates stimulus epoch. Error bars are square error mean. *P<0.05, **P<0.01. V_L: left visual cortex; V_R: right visual cortex.