2976
The Diagnostic Value of Quantitative Analysis of Synthetic MRI, ASL and DWI in Grading Gliomas as Compared to Conventional MRI: A Preliminary Study1Ningxia Medical University, Yinchuan, China, 2General Hospital of Ningxia Medical University, Yinchuan, China, 3GE Healthcare, MR Research, Beijing, China, Beijing, China, 4GE Healthcare, MR Enhancement Application, Beijing, China, Beijing, China
Synopsis
This work sought to investigate the performance of synthetic MRI, ASL and DWI in differentiating LGGs from HGGs as compared to conventional MRI. It was concluded that the T1 and PD from synthetic MRI can be used as novel quantitative imaging biomarkers for grading gliomas. Combining T1, PD, CBF and ADC may explore as an effective strategy to improve the ability for discriminating gliomas grade, and outperformed conventional approaches.
Introduction
Gliomas are the most common primary intracranial tumors of neuroepithelial origin, which are classified by the WHO into four grades according to pathological appearance1. State-of-the-art gliomas treatment including surgery and concurrent chemoradiation2. The ability of discriminating low-grade gliomas (LGGs) from high-grade gliomas (HGGs) is essential for appropriate diagnosis and treatment, especially when it is in an unresectable state. At present, the diagnosis of gliomas mainly depends on histopathology, and the tumor tissue needs to be obtained by biopsy or surgical excision, which is not only invasive, but also subject to sampling bias and it may not be representative of the intra-tumoral heterogeneity3. As an image-based conventional MR glioma grading system, Visually-AcceSAble-Rembrandt-Images (VASARI) is widely adopted and is often used in articles that include tumor morphology description4, 5. Meanwhile, contrast-free MRI techniques, including ASL and DWI, have also been intensely investigated6. In recent years, proposed synthetic MRI using the magnetic resonance image compilation (MAGiC) has emerged, which can simultaneously quantify tissues’ synthetic relaxometry (T1, T2) and PD, as well as a variety of weighted images within a clinically acceptable scan time7, 8. In addition, each individual MR method has its unique virtues and drawbacks which could yield complementary information, thus combining different modalities has been suggested to increase prediction accuracy9. Thus, the purpose of this study was to investigate and compare the diagnostic performance of synthetic MRI, ASL and DWI and their combination for the diagnosis and grading of glioma, aiming to find a quantitative and contrast-free alternative to conventional MRI.Material and Methods
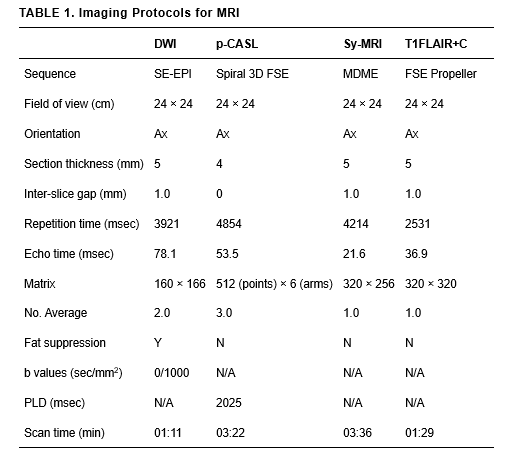
From August 2020 to July 2021, a total of 72 gliomas patients (40 men and 32 women; mean age, 45.06 ± 17.15 years; age range, 4-72 years) were confirmed by biopsy or surgical pathology enrolled in the study. All patients underwent MR exams with a 3.0T whole-body scanner (Signa Architect, GE, USA) with a 48-channel phased-array head coil. The scan sequences included synthetic MRI, ASL, DWI and contrast-enhanced T1FLAIR (T1FLAIR+C). Synthetic relaxometry (T1, T2) and PD maps, were generated from the raw data produced by MAGIC sequence using a vendor-provided program (MAGiC, v. 100.1.1). The detailed parameters for imaging sequences are shown in Table 1. For synthetic MRI, three ROIs (25-35mm2) were manually drawn on the largest area of the solid portion lesion. The ROIs were then mapped to the CBF and ADC images. Finally, the mean values of ROIs for each parameter were calculated. For the purposes of this study, the two relevant VASARI features (enhancement quality, EQ; proportion enhancing, PE) were used to describe the conventional contrast-enhanced MRI features of gliomas. These variables were visually estimated by 2 observers and then divided into categories and scoring according to the VASARI guide. (http://wiki. cancer imaging archive. net/display/Public/VASARI+Research+Project). The Student’s t-test, Mann-Whitney U-test or Fisher’s exact test was used to compare the parameters between LGGs and HGGs. Receiver operating characteristic (ROC) curves (AUC) were also evaluated to assess the diagnostic value of parameters for discrimination.Results
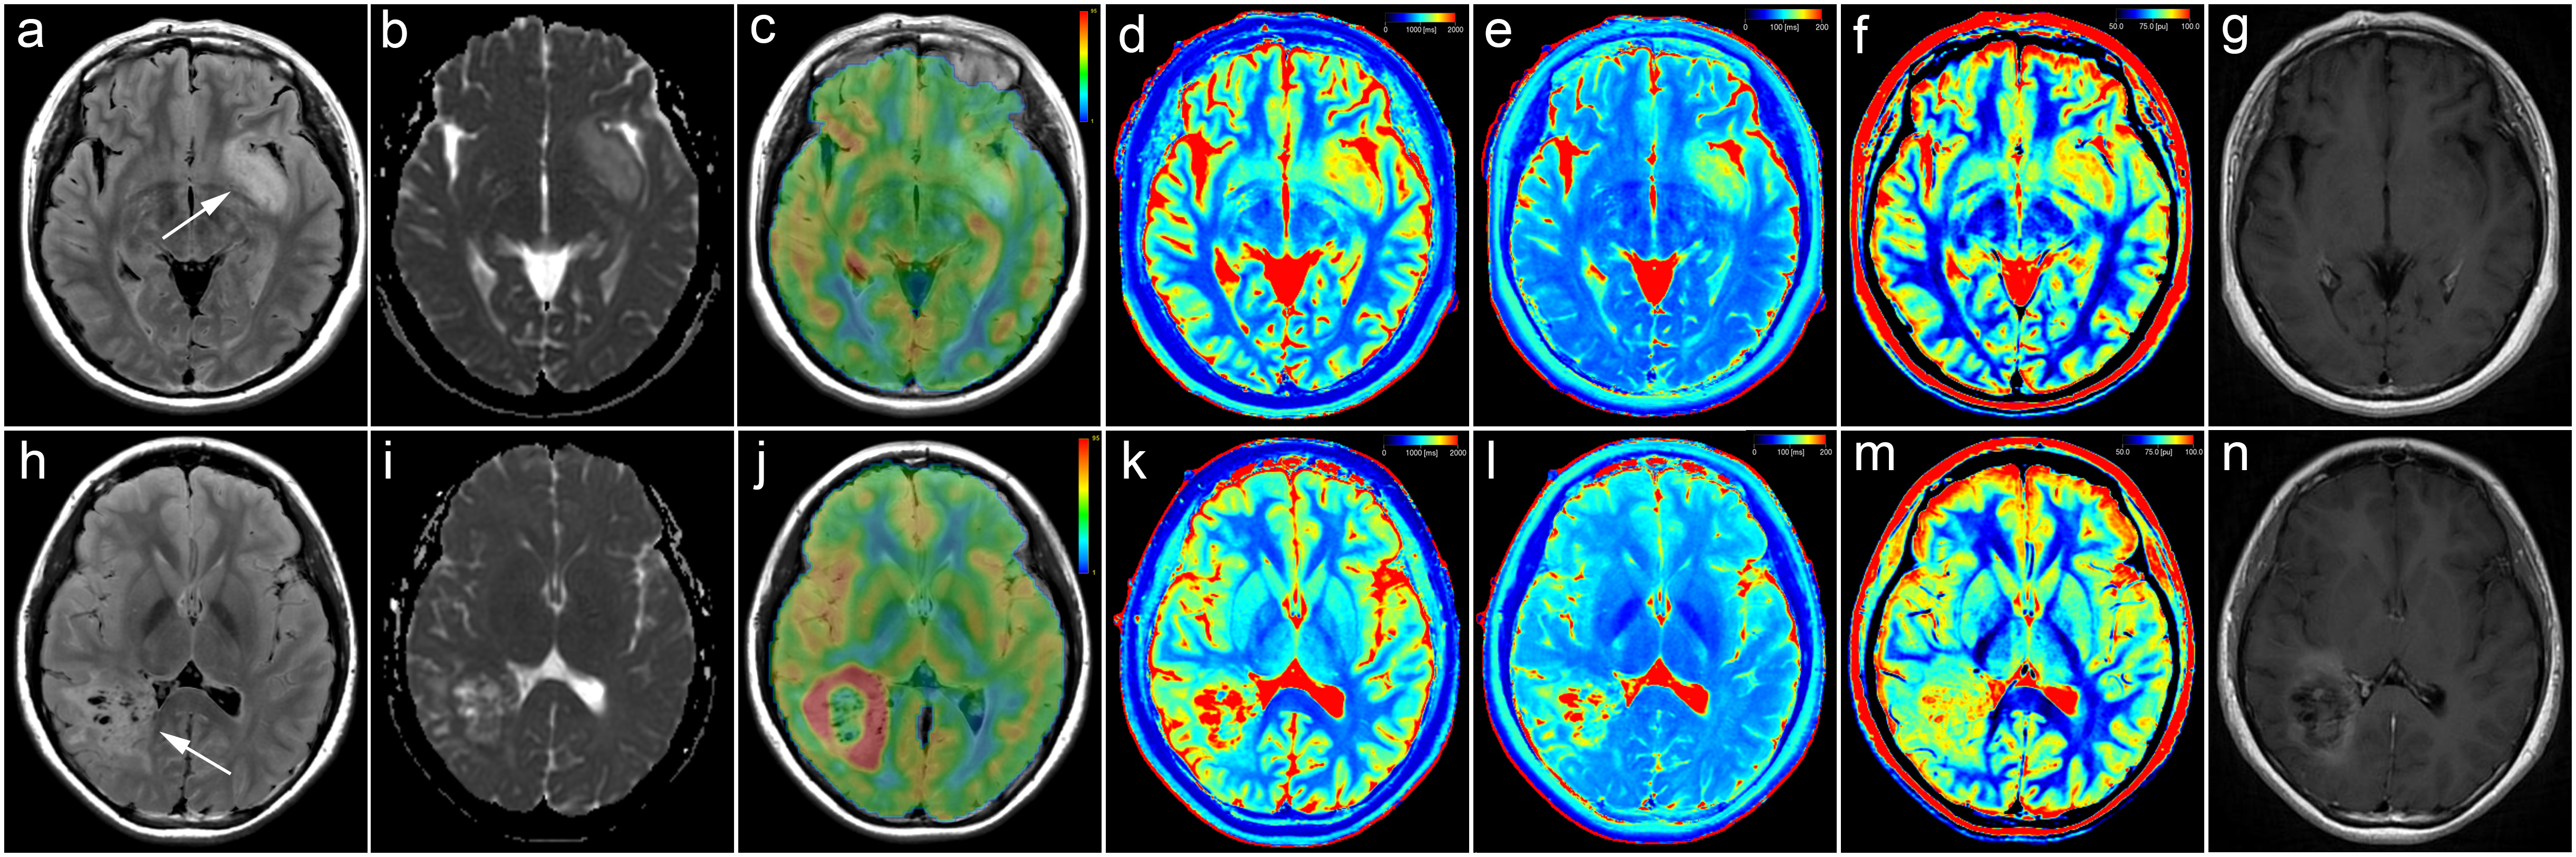
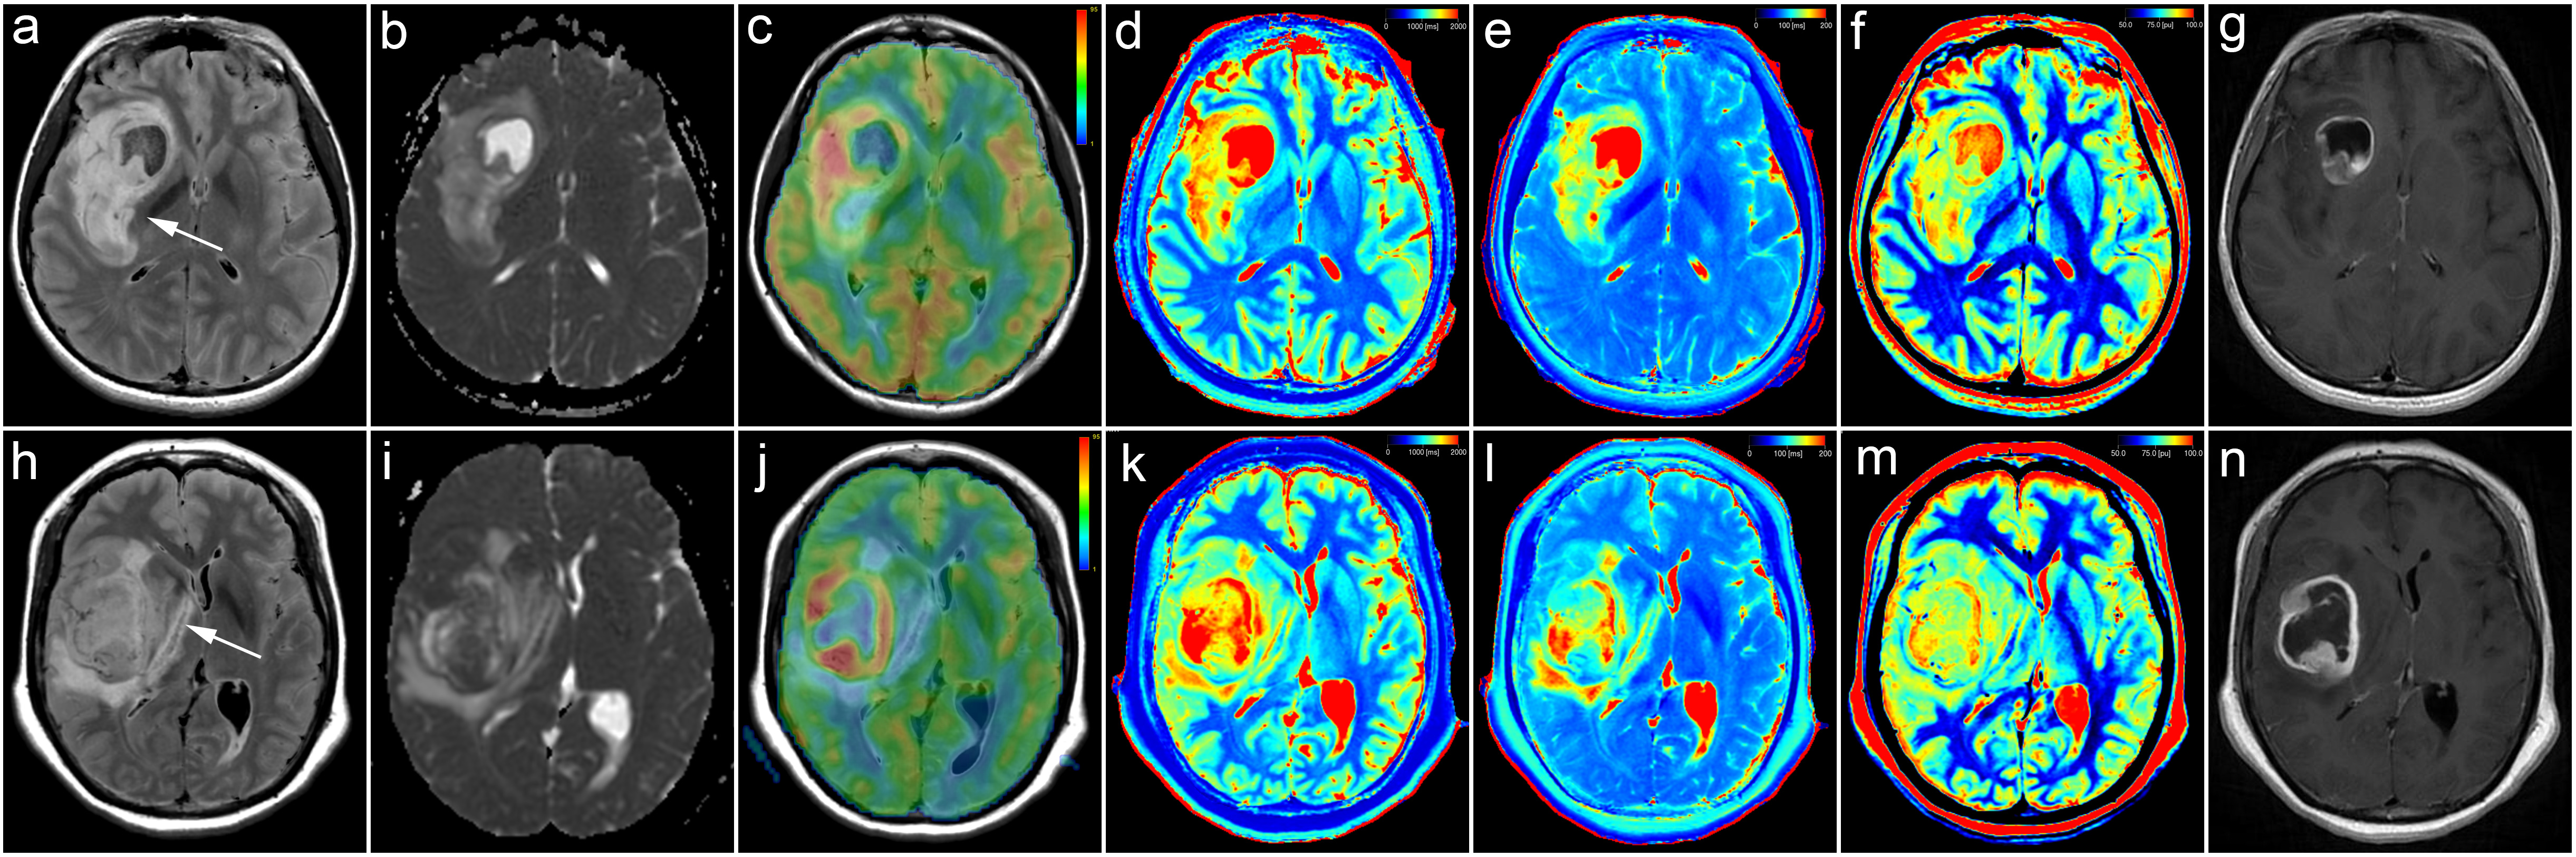
Representative images are illustrated in Figure 1 and 2. The differences of T1, T2, PD, CBF, ADC, EQ and PE between LGGs and HGGs are summarized in Table 2. There are significant differences in T1, PD, CBF, ADC, EQ and PE values between the LGGs and HGGs group (all P<0.001). Table 3 shows the AUC, Sen, Spe, PPV and NPV for the determined cut-off values. ROC analysis showed that ADC presented the largest AUC of 0.905 for identifying LGGs, followed by T1 (AUC=0.861), PD (AUC=0.855) and CBF (AUC=0.784). Combination of four parameters (T1+PD+CBF+ADC) have the highest AUC (0.993) among all combined parameters. DeLong test indicates T1+PD+CBF+ADC is significantly higher than CBF+ADC (P=0.0158), as well as EQ+PE (P=0.0016). However, there is no significant difference (P=0.2078) observed between CBF+ADC and EQ+PE.Discussion
The results revealed that lower T1, PD, CBF, EQ and PE as well as higher ADC in LGGs than HGGs, furthermore, quantitative multi-parameters of T1+PD+CBF+ADC improved the differentiation performance. The synthetic relaxometry represent the inherent properties of matter and the ADC show microstructural differences at the cellular level, if necessary, the CBF could bring hemodynamic information which may thereby improve the situation of enhanced T1 (EQ and PE) just reflects a disrupted BBB and reduce visual information characteristics of subjectivity.These advanced protocols would have an omni-directional and omni-depth role in assessing the tumor biological characteristics, thereby reducing the dependence of diagnosis on subjective factors. Of note, as none of synthetic relaxometry, ASL or DWI rely on exogenous contrast or tracers, would be beneficial for pregnant patients and those with gadolinium contrast agent allergy or decreased renal function10,11.The number of patients included in this study is limited, particularly that of LGGs, a study with larger cohorts is still needed for further clinical validation.Conclusion
We have demonstrated that relaxometry parameters derived from synthetic MRI contributed to the discrimination of LGGs from HGGs. Proposed contrast-free approach combining T1, PD, CBF and ADC showed a strong discriminative power, and outperformed conventional approaches.Acknowledgements
No acknowledgement found.References
1. Louis DN, Perry A, Reifenberger G, et al. The 2016 World Health Organization Classification of Tumors of the Central Nervous System: a summary. Acta Neuropathol 2016;131:803-20.
2. Thust SC, Heiland S, Falini A, et al. Glioma imaging in Europe: A survey of 220 centres and recommendations for best clinical practice. Eur Radiol 2018;28:3306-17.
3. Xiao H, Chen Z, Lou X, et al. Astrocytic tumour grading: a comparative study of three-dimensional pseudocontinuous arterial spin labelling, dynamic susceptibility contrast-enhanced perfusion-weighted imaging, and diffusion-weighted imaging. Eur Radiol 2015;25:3423-30.
4. Su CQ, Lu SS, Zhou MD, et al. Combined texture analysis of diffusion-weighted imaging with conventional MRI for non-invasive assessment of IDH1 mutation in anaplastic gliomas. Clin Radiol. 2019 Feb;74:154-60.
5. Su CQ, Lu SS, Han QY, et al. Intergrating conventional MRI, texture analysis of dynamic contrast-enhanced MRI, and susceptibility weighted imaging for glioma grading. Acta Radiol. 2019 Jun;60:777-87.
6. Kang X, Xi Y, Liu T, et al. Grading of Glioma: combined diagnostic value of amide proton transfer weighted, arterial spin labeling and diffusion weighted magnetic resonance imaging. Bmc Med Imaging 2020;20:50.
7. Tanenbaum LN, Tsiouris AJ, Johnson AN, et al. Synthetic MRI for Clinical Neuroimaging: Results of the Magnetic Resonance Image Compilation (MAGiC) Prospective, Multicenter, Multireader Trial. Am J Neuroradiol 2017;38:1103-10.
8. Warntjes JBM, Leinhard OD, West J, et al. Rapid magnetic resonance quantification on the brain: Optimization for clinical usage. Magn Reson Med 2008;60:320-9.
9. Heiss WD, Raab P, Lanfermann H. Multimodality assessment of brain tumors and tumor recurrence. J Nucl Med. 2011;52:1585 –1600.
10. Gao W, Zhang S, Guo J, et al. Investigation of Synthetic Relaxometry and Diffusion Measures in the Differentiation of Benign and Malignant Breast Lesions as Compared to BI‐RADS. J Magn Reson Imaging 2021;53:1118-27.
11. Kang KM, Choi SH, Hwang M, et al. T1 Shortening in the Globus Pallidus after Multiple Administrations of Gadobutrol: Assessment with a Multidynamic Multiecho Sequence. Radiology 2018;287:258-66.
Figures
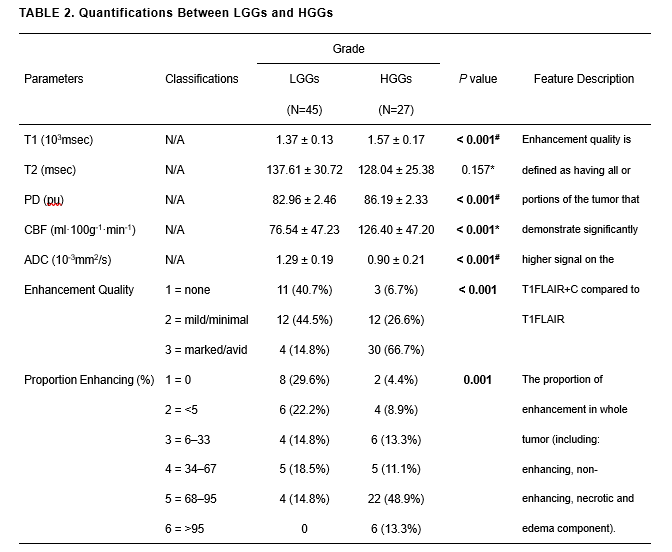
Data are mean ± standard deviation.
P values less than 0.05 were considered to indicate statistical significance.
*P value represents the comparison results of HGGs and LGGs using the t-test analyzation.
#P value represents the comparison results of HGGs and LGGs using non-parametric Mann-Whitney U-test.
T1 = T1 relaxometry; T2 = T2 relaxometry; PD = proton density; CBF = cerebral blood flow; ADC = apparent diffusion coefficient; N/A = not available.
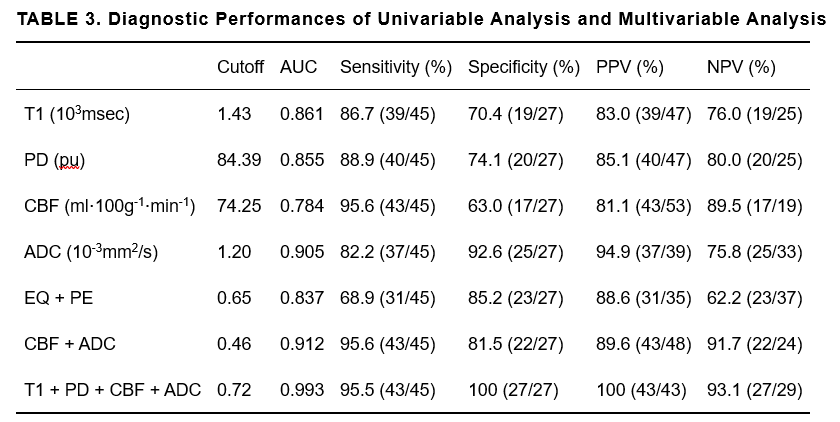
Unless otherwise indicated, data are percentages, data in parentheses are proportions.
T1 = T1 relaxometry; PD = proton density; CBF = cerebral blood flow; ADC = apparent diffusion coefficient; AUC = area under the curve; NPV = negative predictive value; PPV = positive predictive value; EQ = Enhancement Quality; PE = Proportion Enhancing (%).