2974
Application of MRI in tracking and evaluating of SPIONS labeled stromal stem cells transplanted in traumatic spinal cord injury of beagle1Radiology Department, Nanjing Drum Tower Hospital, the affiliated hospital of Nanjing University Medical School, Nanjing, China, 2Philips Healthcare, Shanghai, China, 3Nanjing Drum Tower Hospital, Nanjing, China
Synopsis
Stromal cell transplantation plays an important role in the treatment of traumatic spinal cord injury (SCI). The multi-parameter MRI, including DTI, T2 , T2* mapping and QSM , of all beagles were performed before and after operation. We found that the transplanted stromal stem cells with Ruicun-labeled in the injured spinal cord could be quantified by QSM within 28 days after transplantation. FA value can be used to quantitatively evaluate the integrity of spinal fibers and the recovery of spinal nerve function. Thus, MRI can used to track the dynamic changes of SPIONS labeled stromal stem cells transplanted.
Introduction
Stromal cell transplantation plays an important role in the treatment of traumatic spinal cord injury (SCI). Traditional magnetic resonance imaging (MRI) could not dynamically display the distribution and migration of transplanted stem cells in injured spinal cord. The aim of current study is to investigate whether Ruicun (generic drug of Ferumoxytol) nanoparticles labeling can be used to quantify the number and dynamically display the migration of stromal stem cells in injured spinal cord area with multi-parameter MRI in a large-animal model. Furthermore, the repair outcomes of human umbilical cord mesenchymal stromal cells (HUCMSCs) implants would to be evaluated.Materials and Methods
From July 2018 to October 2020, 45 beagles (female, mean age 18 months, 12-14 kg) were implanted with normal saline (n=15, group C), Ruicun-labeled (n=15, group T) or unlabeled (n=15, group M) HUCMSCs underwent the spinal cord semi-transverse injury at the T8 vertebral level. The multi-parameter MRI, including diffusion tensor imaging, T2 mapping with multi-echo TSE and T2* mapping as well as quantitative susceptibility mapping (QSM) with multi-echo ultra-short echo (UTE), of all beagles were performed on before the operation, and after the operation at an interval of 3d, 7d, 14d, 21d, 28d, 35d, 49d, 63d, 77d and 105d. The fractional anisotropy (FA), T2, T2* and QSM was measured using multi-parameter MRI. MR parameter values, Olby score and histopathological results within 28 days were used to evaluate the distribution, differentiation and repair effect of transplanted stem cell implants in SCI. Leneve homogeneity of variance test, one-way ANOVA and Pearson linear correlation analysis were used to compare the results.Results
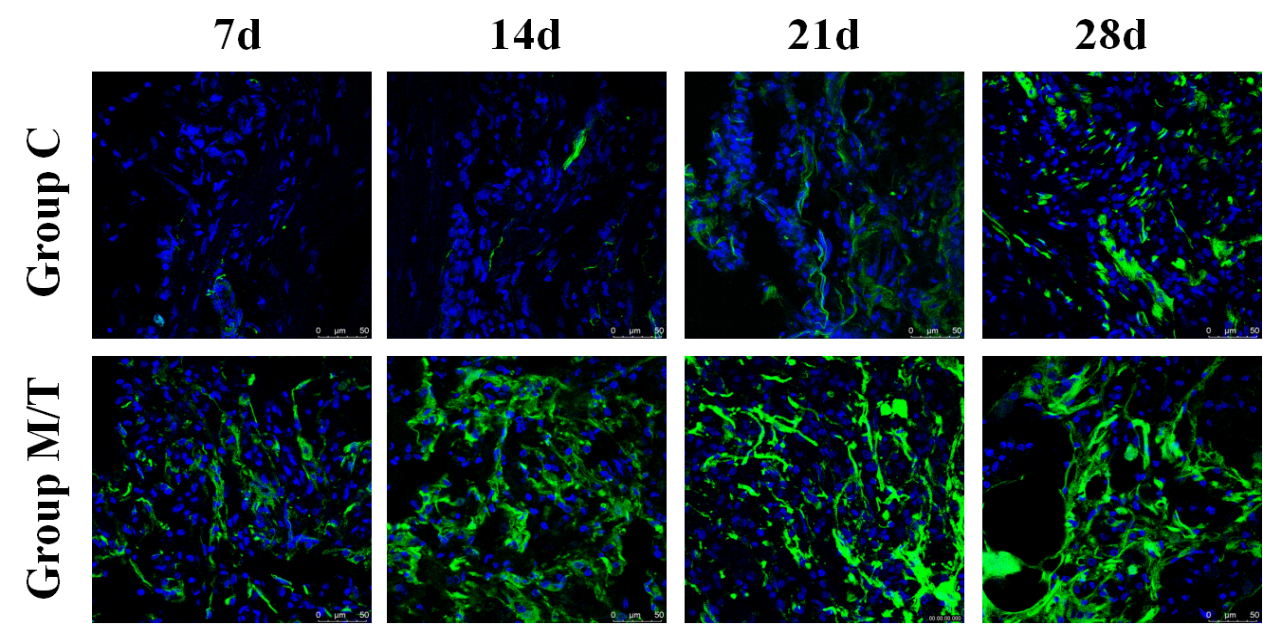
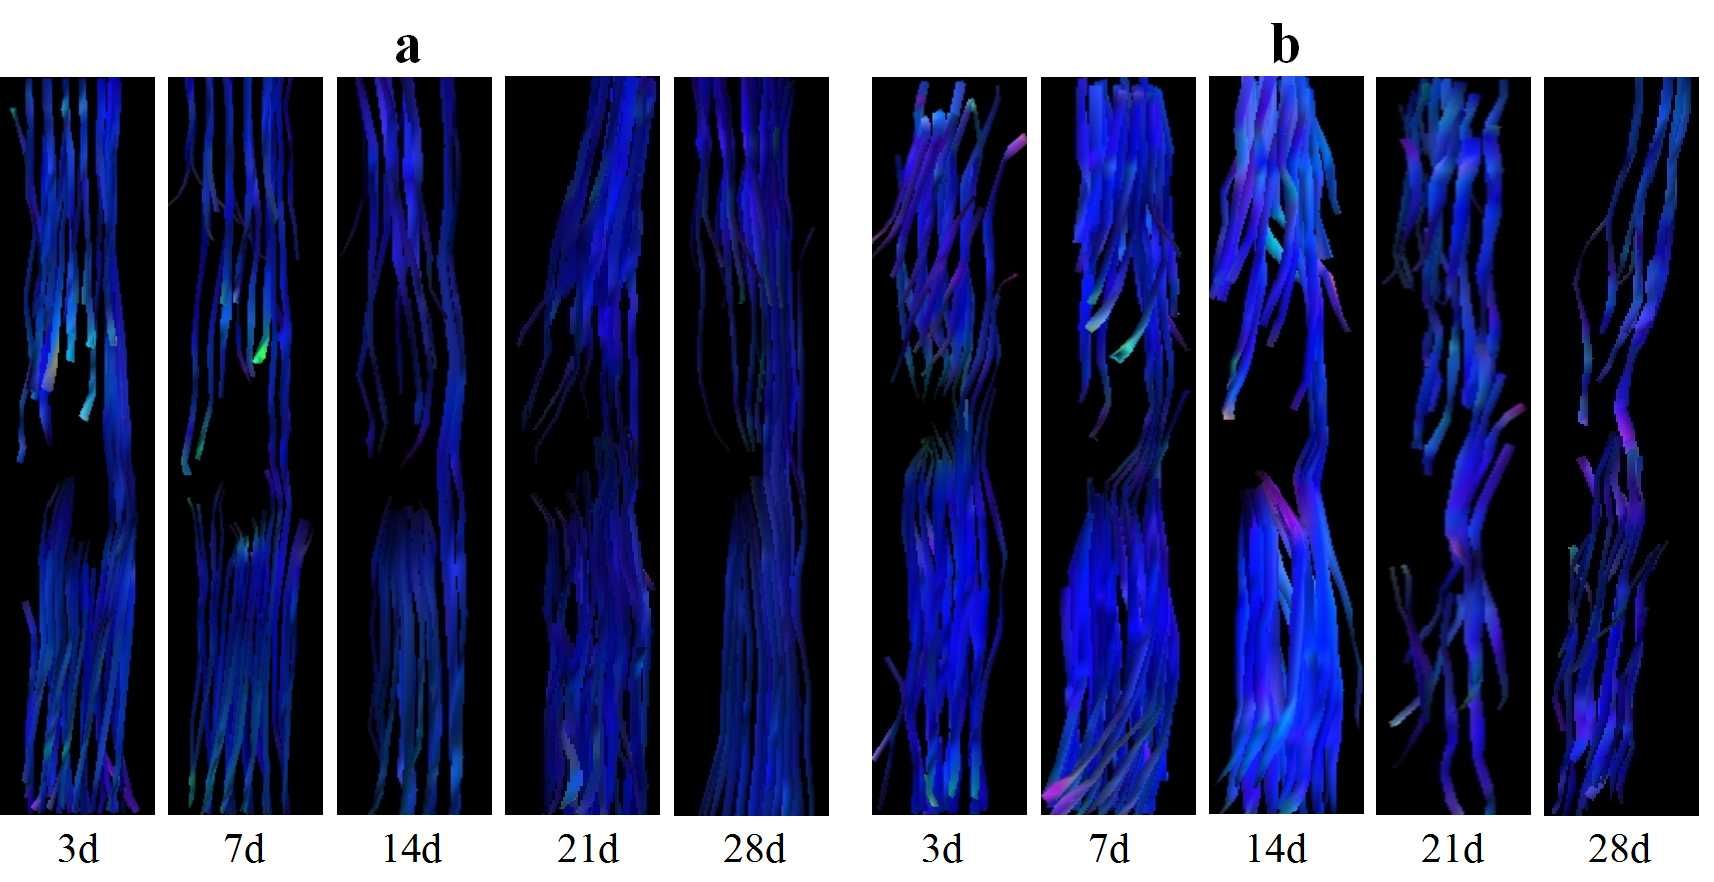
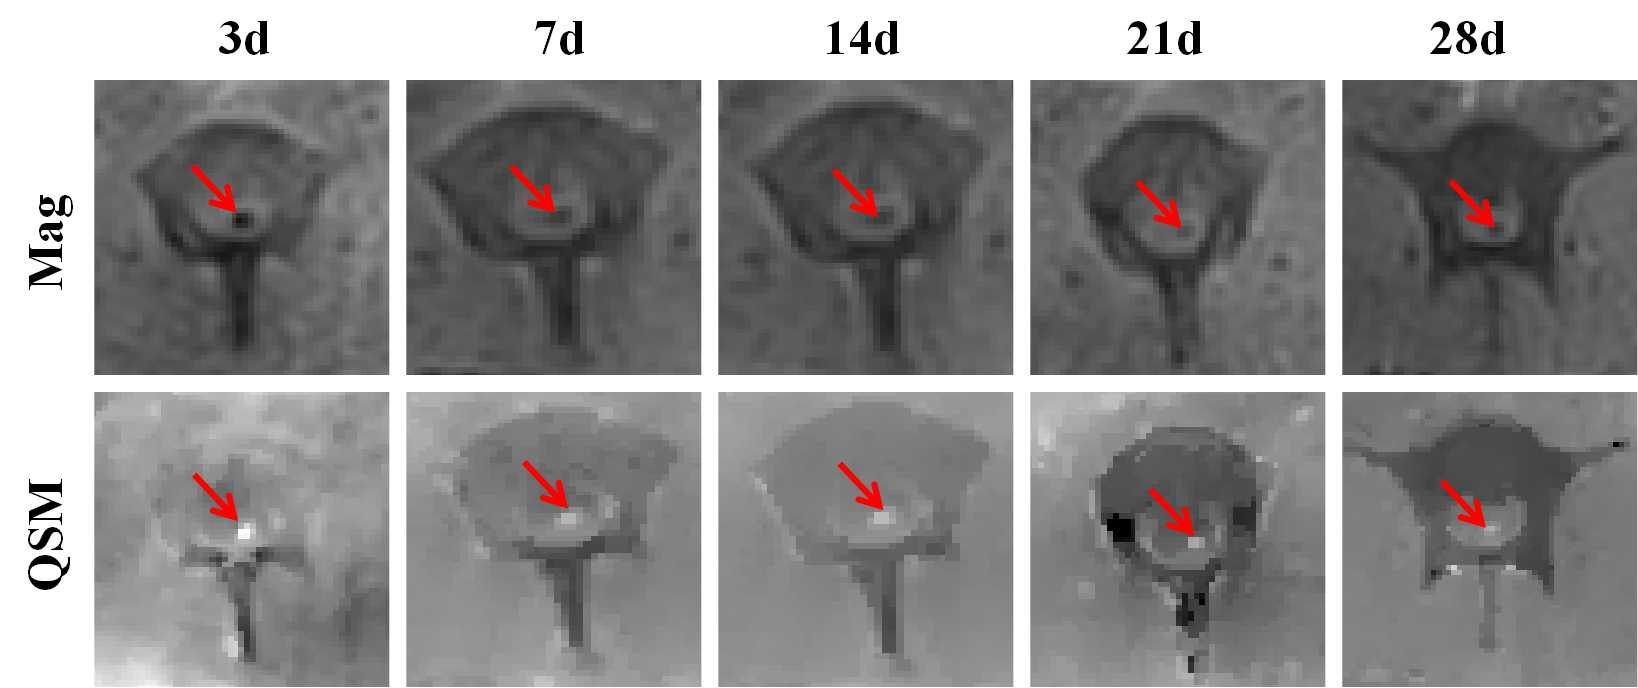
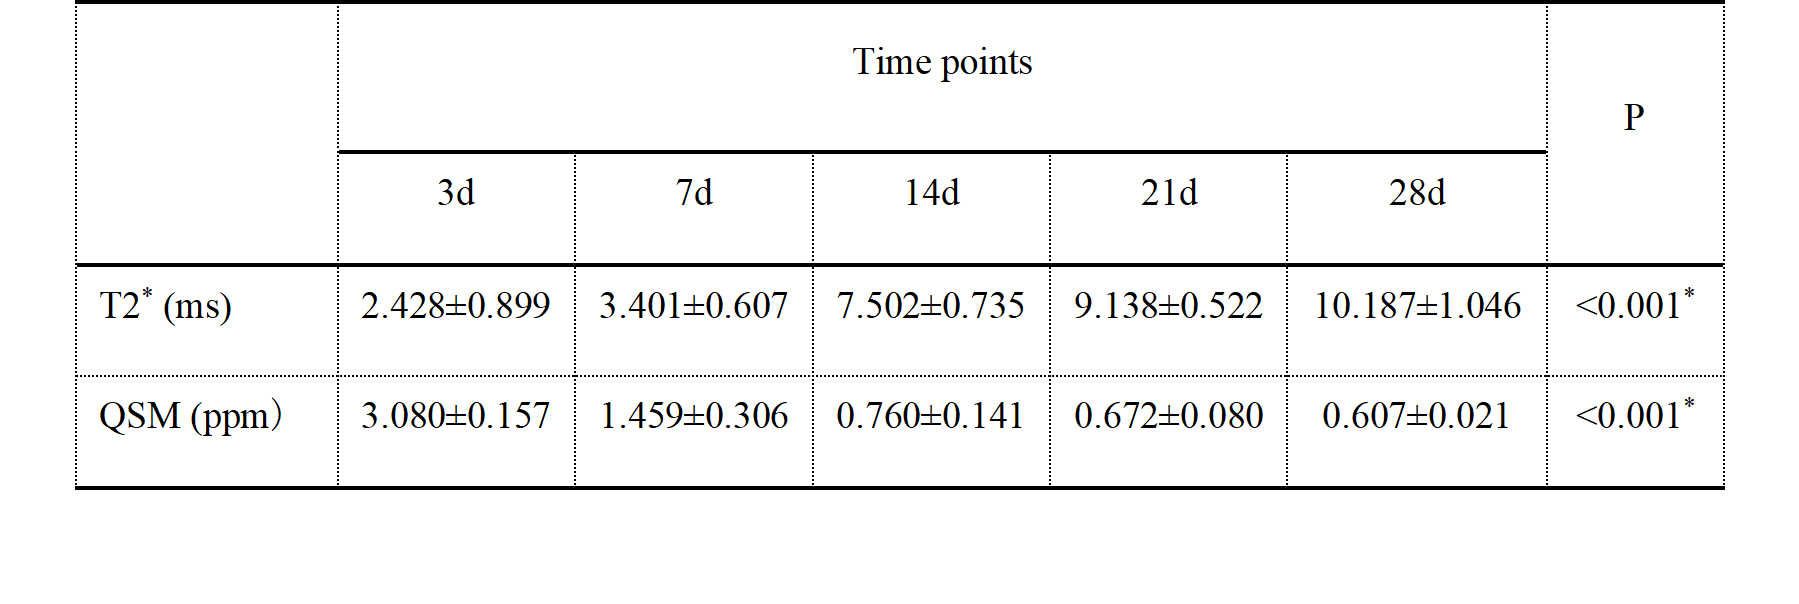
Compared with group M, group T showed significant T2 shortening effect (both sides of the injured area) and no difference in the repair of the injured spinal cord. In group T, T2* were statistically significant between day 3 and day 7, day 7 and day 14, and day 14 and day 21 (P=0.013, P<0.001, P=0.001). There were significant differences in QSM between day 3 and day 7, and day 7 and day 14 (P<0.001). The Table 1 and Figure 3 exhibited the dynamic QSM and T2* value changes at different time points after SPIONs-labeled HUCMSCs transplantation. There was a significant negative correlation between T2* and QSM (r=-0.814, P<0.001). The low signal area on both sides of the injured spinal cord was centered on the surgical area and extended to the head and tail. T2* showed an upward trend, while QSM showed a downward trend. FA of group C showed a continuous downward trend over time, while group M and T decreased first and then increased. Compared with group C, FA was significantly higher in group T and M at 14, 21 and 28 days after injury (all P<0.05). There was no significant difference in FA between Group M and Group T at all time points (all P>0.05). The Olby score of group T and M were significantly higher than that of group C on day 21 and day 28 after injury. The Olby score was positively correlated with FA value (r=0.583, P<0.001). The expression level of Tuj-1 in HUCMSCs transplantation was significantly higher than that in group C at 28 days after model making, and histopathological staining revealed the presence of retention-labeled stromal stem cells in the spinal cord on day 28 after transplantation(Figure 1). On the 105th day after injury, low signal shadow of iron nanoparticles was still observed in the spinal cord, and histopathological sections showed that iron particles were located in the intercellular stroma.Conclusions
Within 28 days after transplantation, the transplanted stromal stem cells with Ruicun-labeled in the injured spinal cord could be quantified in vivo by QSM technique based on UTE sequence, and their migration curve could be plotted. Olby score and expression of spinal cord neuron marker Tuj-1 in stromal stem cell transplantation group were significantly higher than those in normal saline group. FA value is an ideal imaging index to quantitatively evaluate the integrity of spinal fibers and the recovery of spinal nerve function after spinal cord injury. Thus, multiparameter MRI can used to track and evaluate the dynamic changes of SPIONS labeled stromal stem cells transplanted in traumatic spinal cord injury of beagle.Acknowledgements
NoneReferences
[1] Ryken T C , Hurlbert R J , Hadley M N , et al. The Acute Cardiopulmonary Management of Patients With Cervical Spinal Cord Injuries[J]. Neurosurgery, 2013, 72:84-92.
[2] Michailidou C, Marston L, Souza L H D, et al. A systematic review of the prevalence of musculoskeletal pain, back and low back pain in people with spinal cord injury[J]. Disability & Rehabilitation, 2014, 36(9):705-715.
Figures