2973
Inhomogeneous Magnetization Transfer (ihMT) Helps to Detect Multiple Sclerosis Plaques in The Spinal Cord.1Department of Radiology, Chiba Univercity Hospital, Chiba, Japan, 2Diagnostic Radiology and Radiation Oncology, Graduate School of Medicine, Chiba University, Chiba, Japan, 3Philips Japan, Tokyo, Japan, 4Philips Canada, Mississauga, ON, Canada
Synopsis
Demyelination assessment with MRI for multiple sclerosis (MS) is a reliable biomarker for monitoring disease progression. Recently, inhomogeneous magnetization transfer (ihMT) combined sequencing has been developed for myelin-specific imaging. The purpose of this study was to evaluate ihMT in delineating MS lesions in the spinal cord by comparing the conventional imaging methods. The lesion-to-white matter contrast-to-noise ratio (CNR) on ihMT was significantly higher than the other methods. The qualitative analysis revealed clarity of lesion detection, but false positives were a concern. Our results in MS patients suggest that ihMT may be a helpful sequence for lesion detection.
INTRODUCTION
Detection of hyperintense lesions on T2-FSE is important in the assessment of damage to the spinal cord in patients with multiple sclerosis (MS).1,2 Demyelination is involved in spinal cord atrophy in MS, and the degree of demyelination correlates with disease severity and prognosis.3,4 Therefore, demyelination assessment with MRI is a reliable biomarker for monitoring disease progression. Recently, inhomogeneous magnetization transfer (ihMT) combined sequencing has been developed, which is a new endogenous imaging technique with high specificity for myelin5 and has been reported to be useful in assessing the pathogenesis of MS.6,7 However, there are only a few reports on the evaluation of MS in the spinal cord region. The purpose of the present study was to evaluate ihMT in delineating MS lesions of the spinal cord by comparing it to the conventional methods of T2-weighted fast spin-echo imaging (T2-FSE) and T2-multi echo fast field echo imaging (T2-mFFE).METHODS
MR imaging of the spinal cord was performed on 15 patients (median age 36, age-range 22-60, 5 men and 10 women). All examinations were performed on a 3.0-Tesla MR system (Philips Ingenia) equipped with a total spine coil. The scanning parameters are summarized in Figure 1. For ihMT and T2-mFFE, we used the image of all echoes cumulated. The axial images were set to be parallel to the vertebral body angle and set to delineate the suspected lesion area by the sagittal images. In each sequence, an equal number of images of the same level were acquired.The quantitative criterion used for comparing each sequence was the contrast-to-noise ratio (CNR), which was calculated according to the following formula: CNR = (Slesion–Swhite-matter)/SDwhite-matter, where Slesion is the signal intensity of the lesion, Swhite-matter is the signal intensity of the white matter, and SDwhite-matter is the standard deviation of the white matter. The areas of the regions of interest drawn in the lesions ranged from 3 to 15 (mean = 8) mm2 depending on lesion size. The statistical significance of the quantitative data was determined with the Steel–Dwass nonparametric test for multiple comparisons. A significant difference was accepted if the P-value was less than 0.05.
The qualitative analysis was performed by a board-certified radiologist. Visual assessment of the presence of spinal cord lesions was performed for each imaging sequence. The number of lesions and slice positions delineated by each sequence was recorded, and then each sequence was re-evaluated side-by-side to compare lesion detection per slice section. Blinding for image type was not performed because the image sequences could be easily distinguished.
RESULTS
CNR on T2-FSE ranged from 3.39 to 11.7 (mean ± SD, 5.6 ± 2.2). CNR on ihMT ranged from 4.80 to 12.8 (7.7 ± 2.4). CNR on T2-mFFE ranged from 0.12 to 8.6 (3.3 ± 1.9). There was a significant difference among three sequences, with P < 0.05 (Figure 2).In the qualitative analysis, 88 lesions were identified on T2-FSE, 107 on ihMT, and 82 on T2-mFFE out of 300 slices in 15 patients. ihMT missed 2 lesions that were depicted on T2-FSE, T2-mFFE missed 29 lesions that were depicted on T2-FSE. The number of cases that were not delineated on T2-FSE and were determined to be lesions on both ihMT and T2-mFFE was 16 cases. The number of lesions detected on ihMT images alone was 5 cases, and the number of lesions detected on T2-mFFE images alone was 7 cases(Figure 3, right).
DISCUSSION
The 86 lesions seen on both T2-FSE and ihMT were more clearly delineated on ihMT. In addition, ihMT clearly depicted gray matter and the anatomical location of the demyelinating lesion could be clearly observed (Figure 3, left). In quantitative evaluation, the lesion-to-white matter CNR was significantly higher in ihMT than in T2-FSE and T2-mFFE. In T2-mFFE, 59 lesions that were depicted in T2-FSE were clearly depicted. However, the contrast between the white matter and the lesion was less clear than on ihMT, and CNR was also poor.In 10 out of 16 cases where the lesion was not visualized by T2-FSE but was determined by both ihMT and T2-mFFE, it was visualized on T2-FSE prior to treatment (Figure 4). Therefore, ihMT may be able to evaluate lesions after remission that cannot be recognized on T2-FSE. In 6 of the 16 cases, the lesion was clearly visible on the sagittal section, which was a missed T2-FSE. These findings indicate the superiority of ihMT. However, in the 5 cases detected by ihMT alone and the 7 cases detected by T2-mFFE alone, the spinal cord was depicted with a high signal due to some artifact (Figure 5, top Case1), suggesting the possibility of a false positive.
The lesions that were detected by T2-FSE but missed by ihMT and T2-mFEE were probably due to patient motion artifacts that obscured them. Swallowing and oral movement artifacts and respiratory movement artifacts played a major role (Figure 5, bottom Case2).
CONCLUSION
Our results in MS patients suggest that ihMT may be a useful sequence for lesion detection, as it showed better clarity of spinal cord lesions than T2-FSE and T2-mFFE. However, there are false positives due to artifacts, so care must be taken in reading the images.Acknowledgements
No acknowledgments were found.References
1. Grossman RI, et al: Assessment of spinal cord damage in MS using MRI. J Neurol Sci. 2000 Jan 15;172 Suppl 1:S36-9.
2. Simon JH. The contribution of spinal cord MRI to the diagnosis and differential diagnosis of multiple sclerosis. J Neurol Sci. 2000 Jan 15;172 Suppl 1:S32-5
3. M Kremenchutzky, et al: The natural history of multiple sclerosis: a geographically based study 9: observations on the progressive phase of the disease. Brain. 2006 Mar;129(Pt 3):584-94.
4. Filippi, M, et al: Magnetic resonance techniques in multiple sclerosis: The present and the future. Arch Neurol. 2011 Dec;68(12):1514-20.
5. Varma, G, et al: Magnetization transfer from inhomogeneously broadened lines: A potential marker for myelin. Magn. Reson. Med. 73, 614–622.
6. Van Obberghen E, et al: Evaluation of the Sensitivity of Inhomogeneous Magnetization Transfer (ihMT) MRI for Multiple Sclerosis. AJNR Am J Neuroradiol. 2018 Apr;39(4):634-641.
7. Van Obberghen E, et al: Inhomogeneous Magnetization Transfer (ihMT) in normal-appearing tissue correlates with disability of multiple sclerosis patients. Neurology. 2017 Apr; 88 (16 Supplement) P4.360
Figures
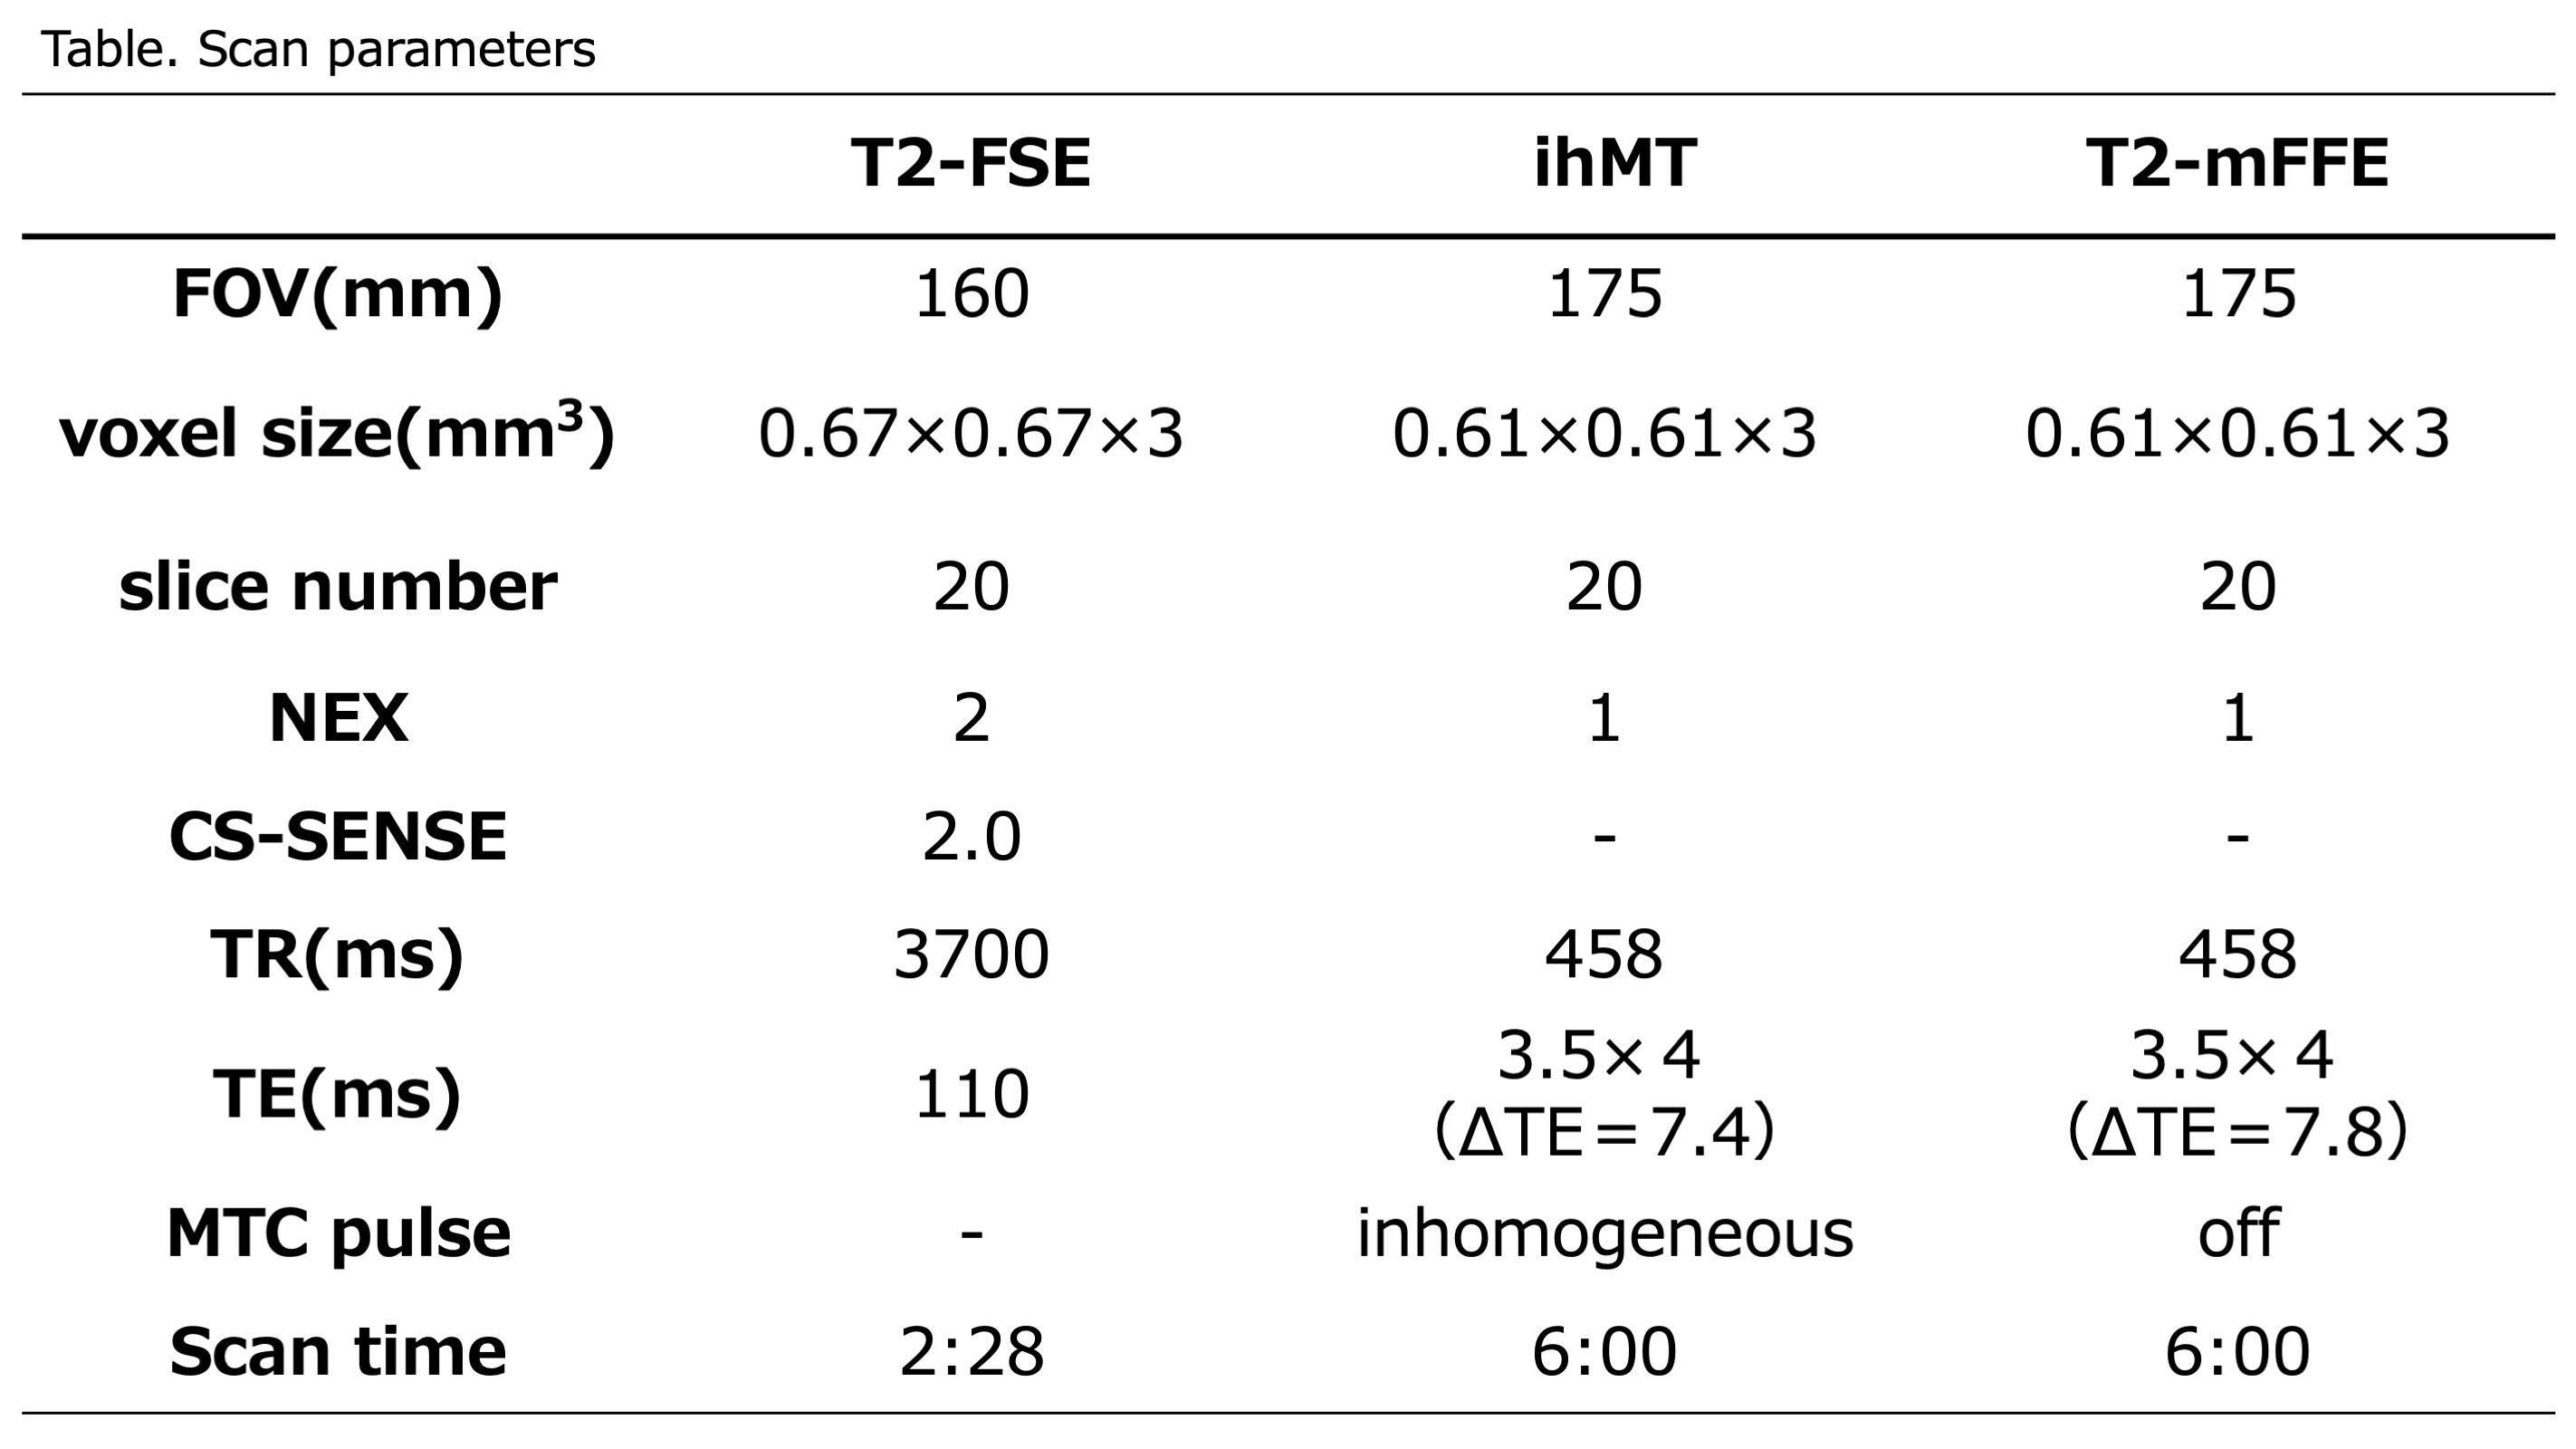
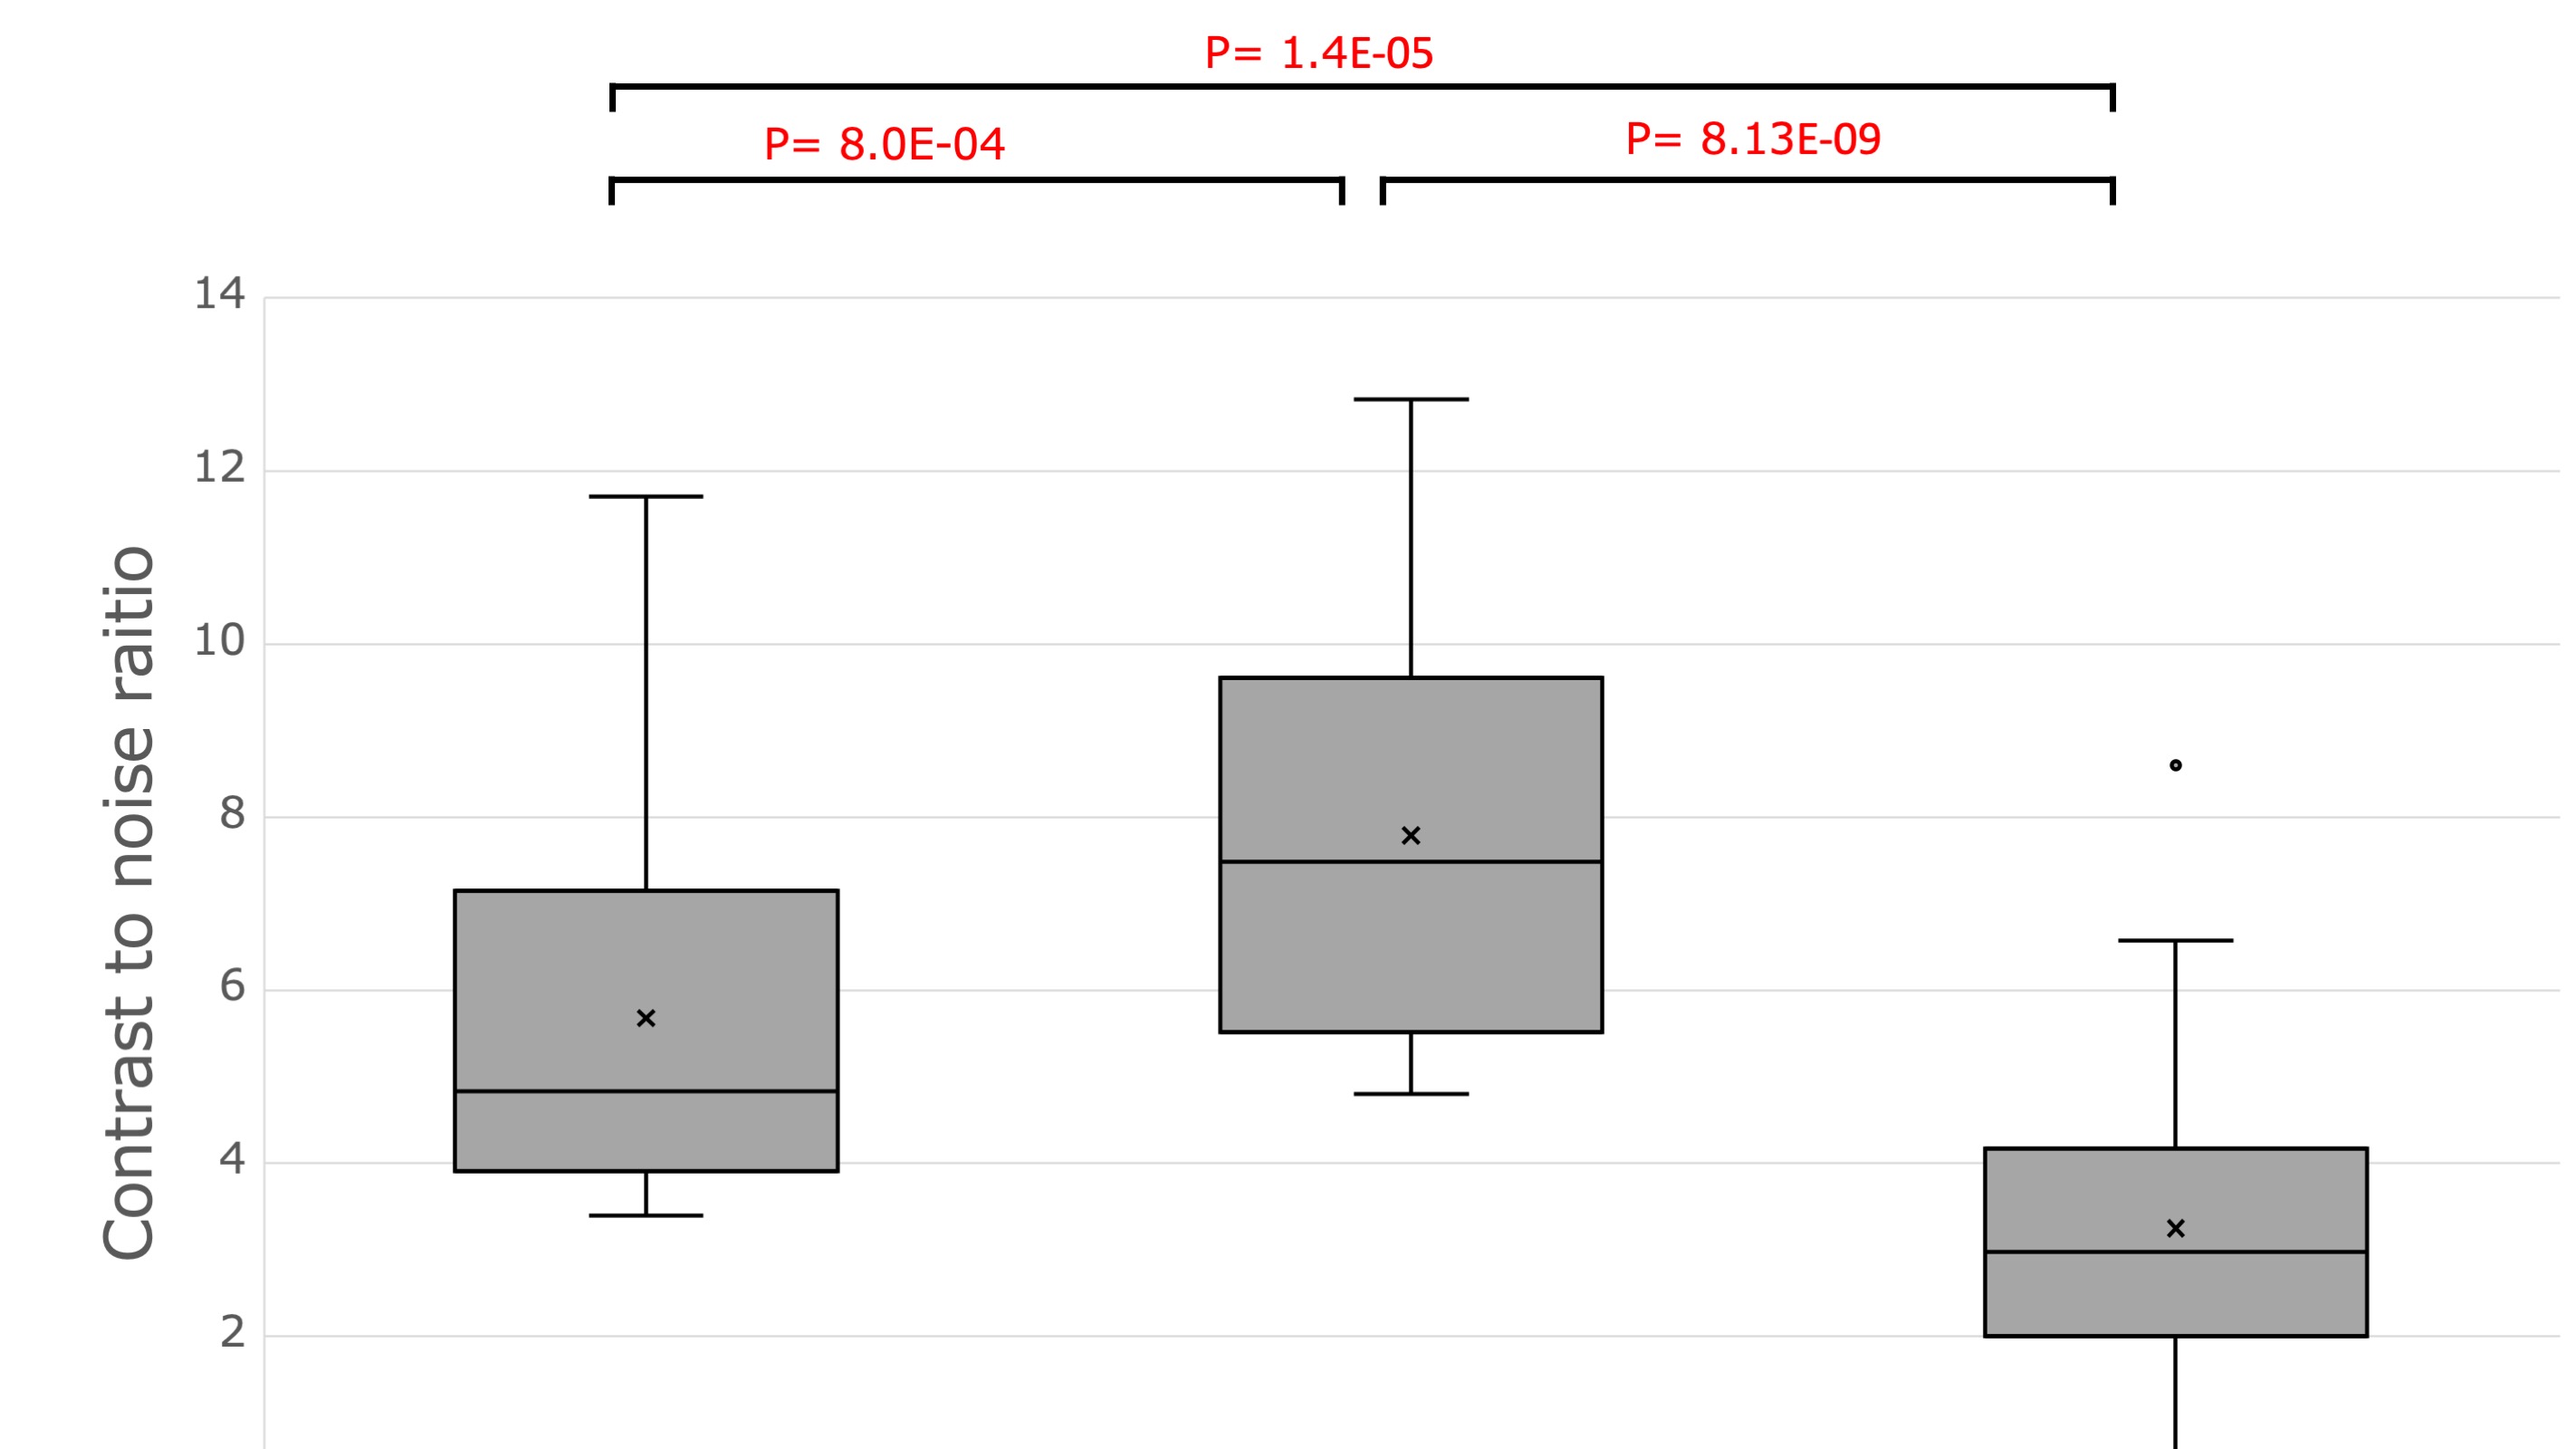
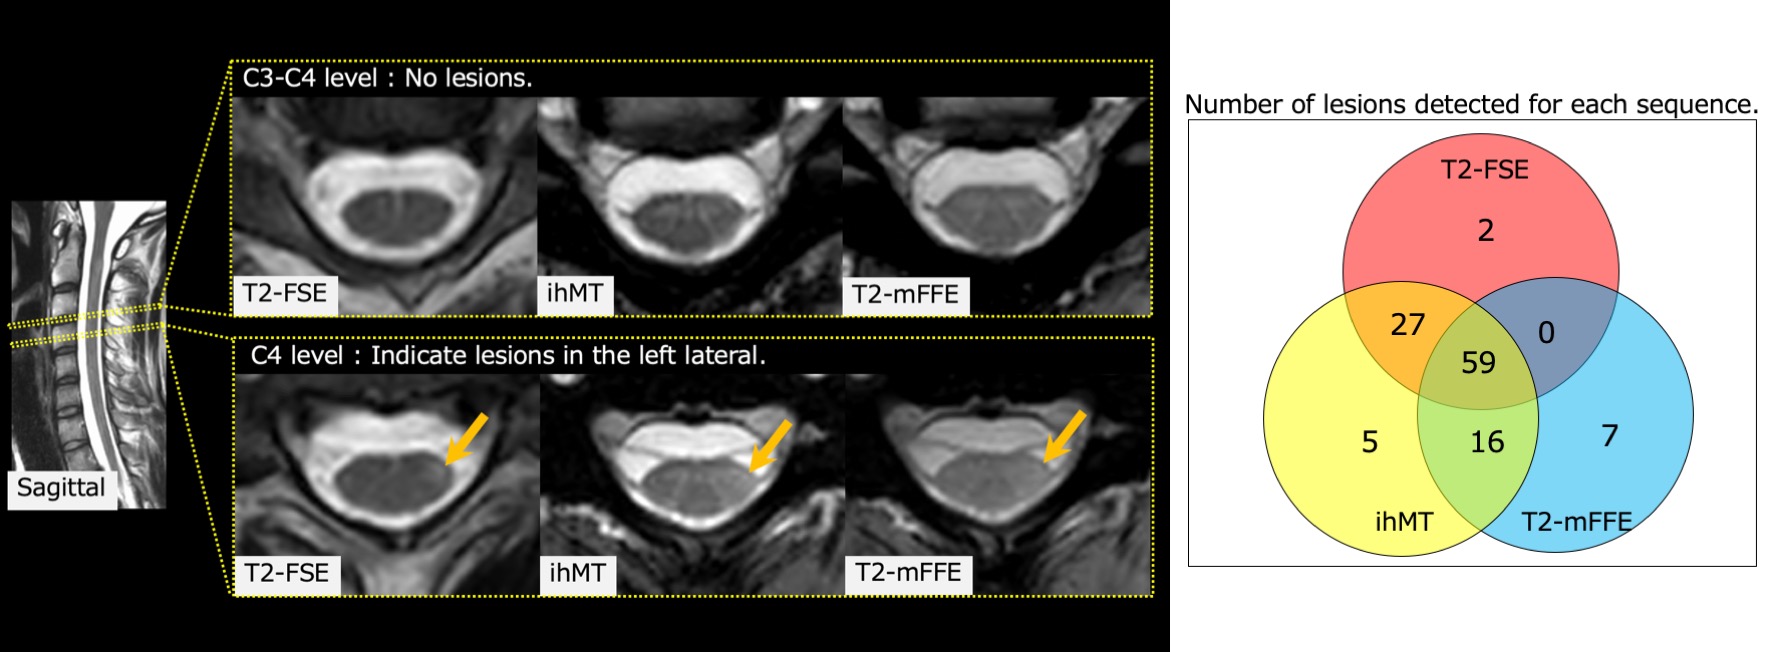
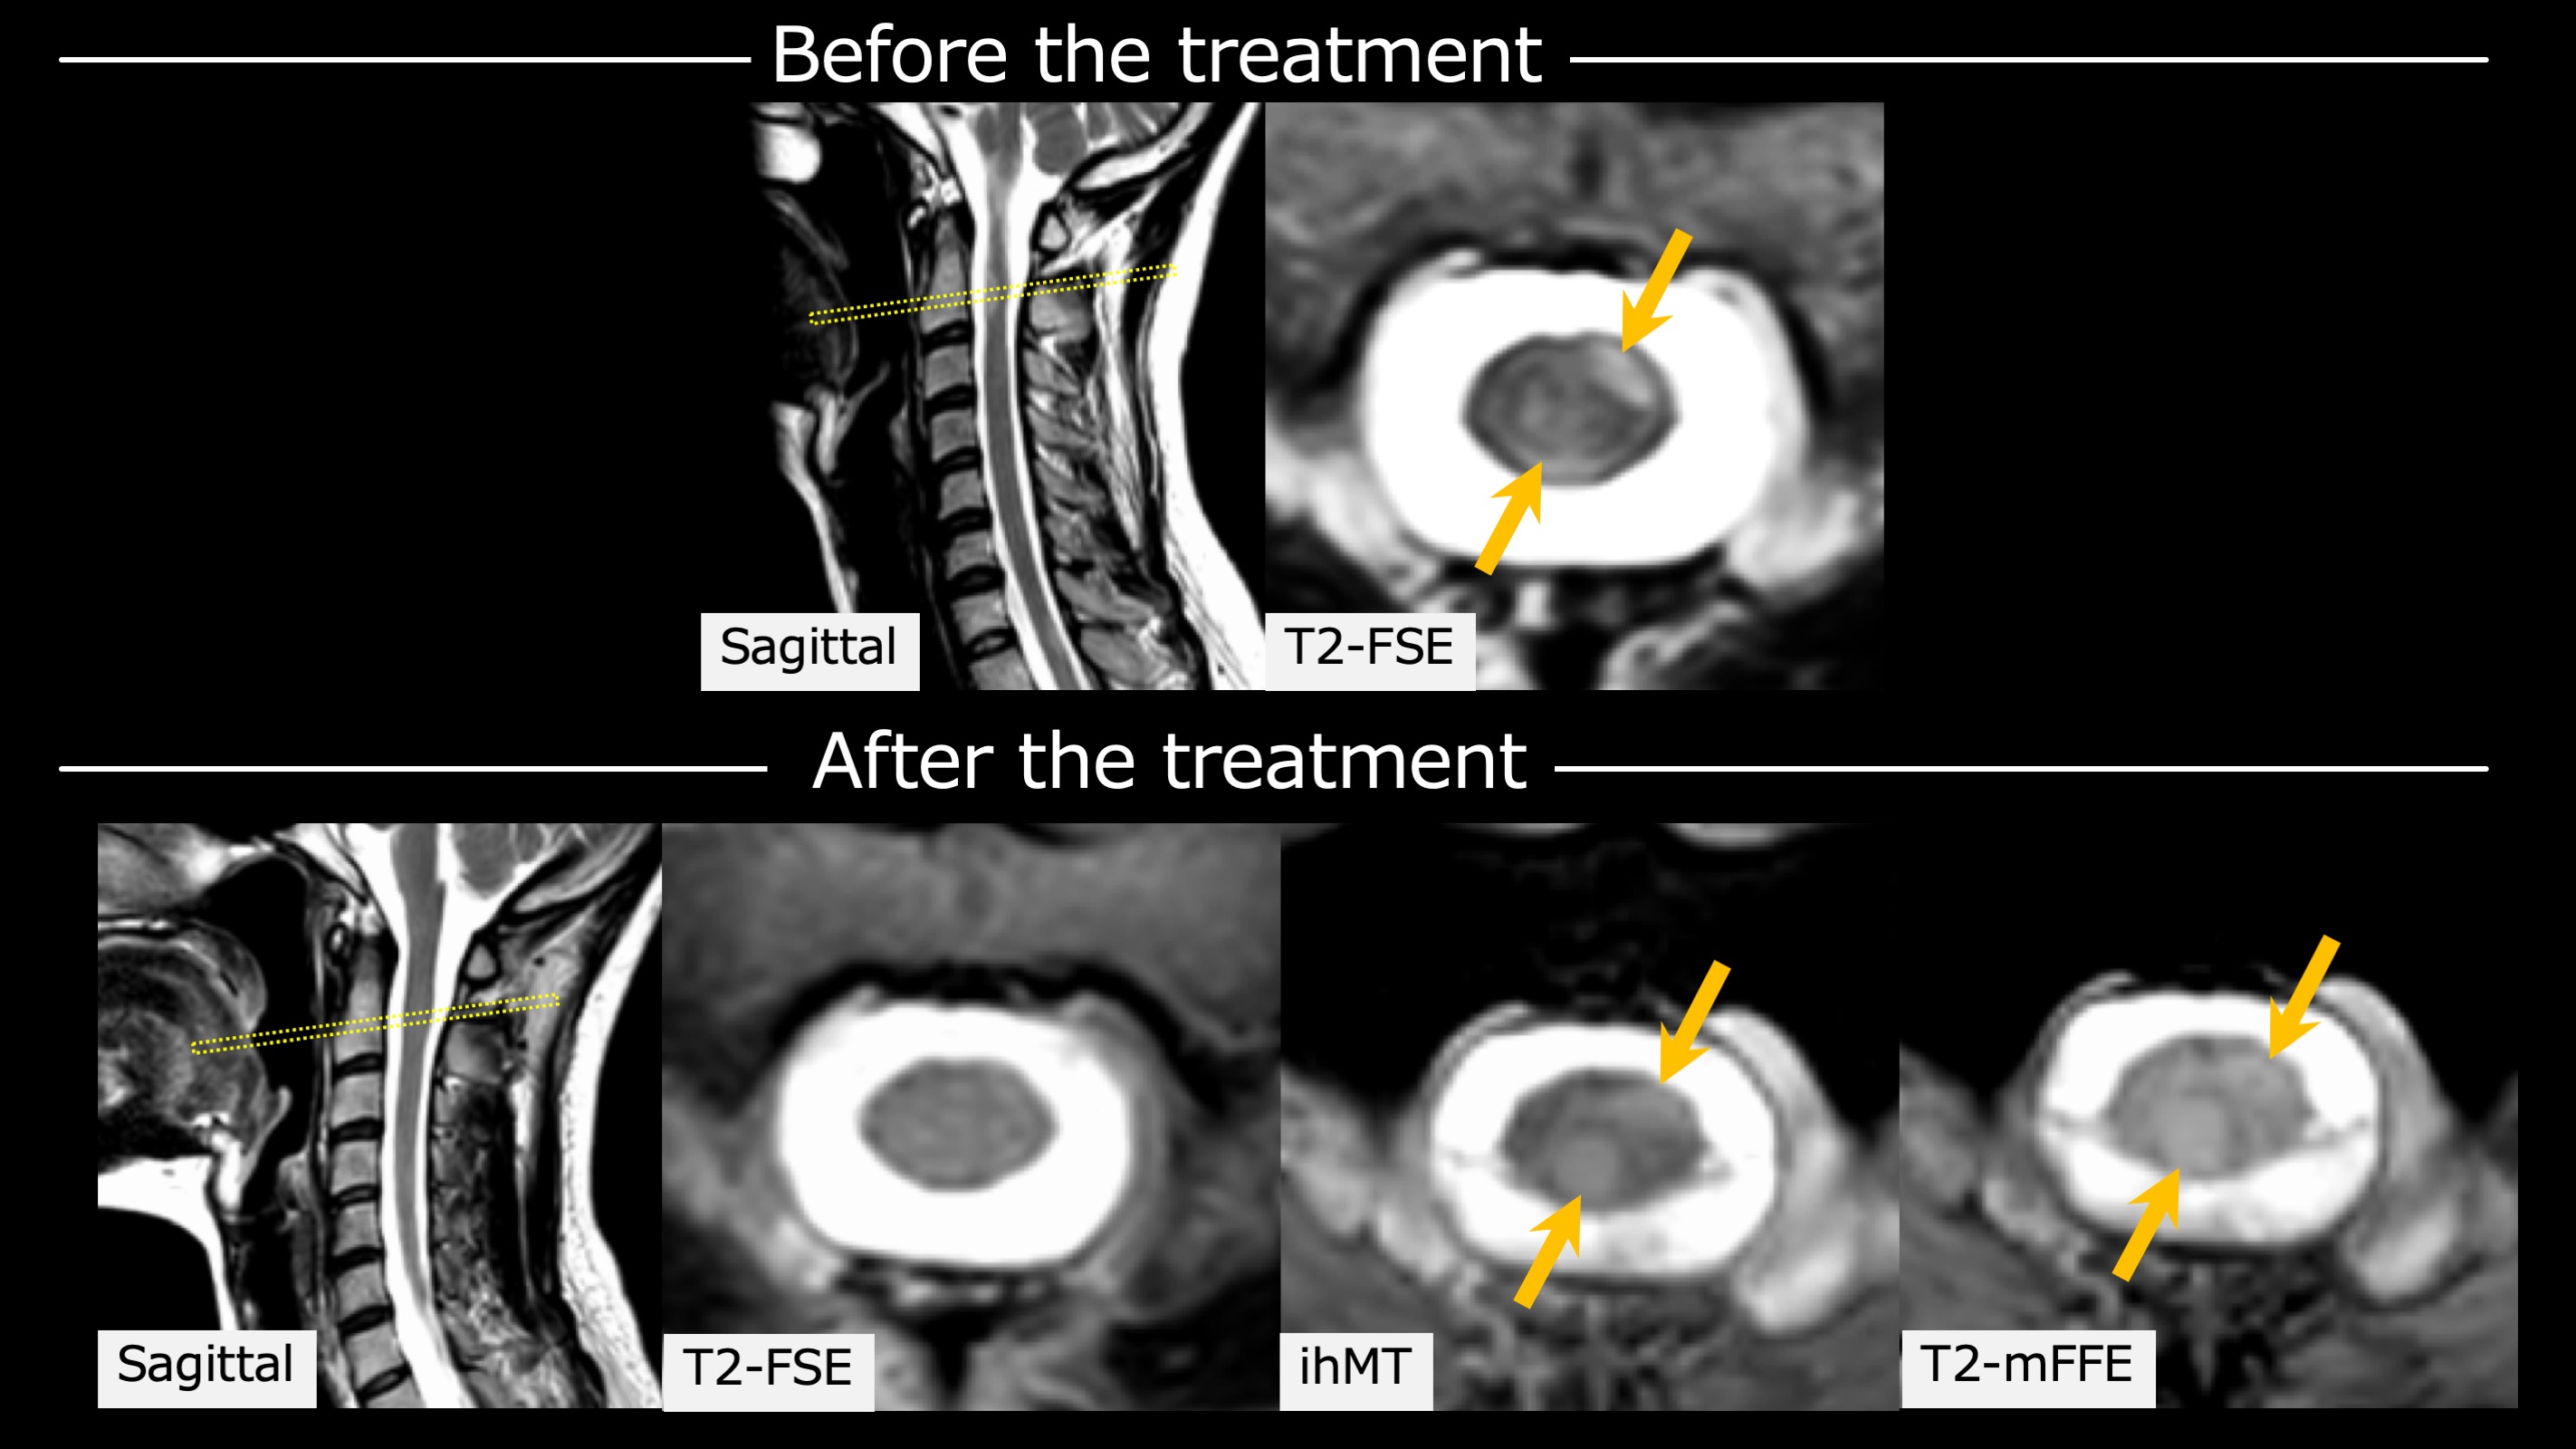
Figure 4. The top is before treatment and the bottom is after treatment. Arrows indicate the lesions. T2 high-signal lesions before treatment can be observed by ihMT and T2-mFFE.
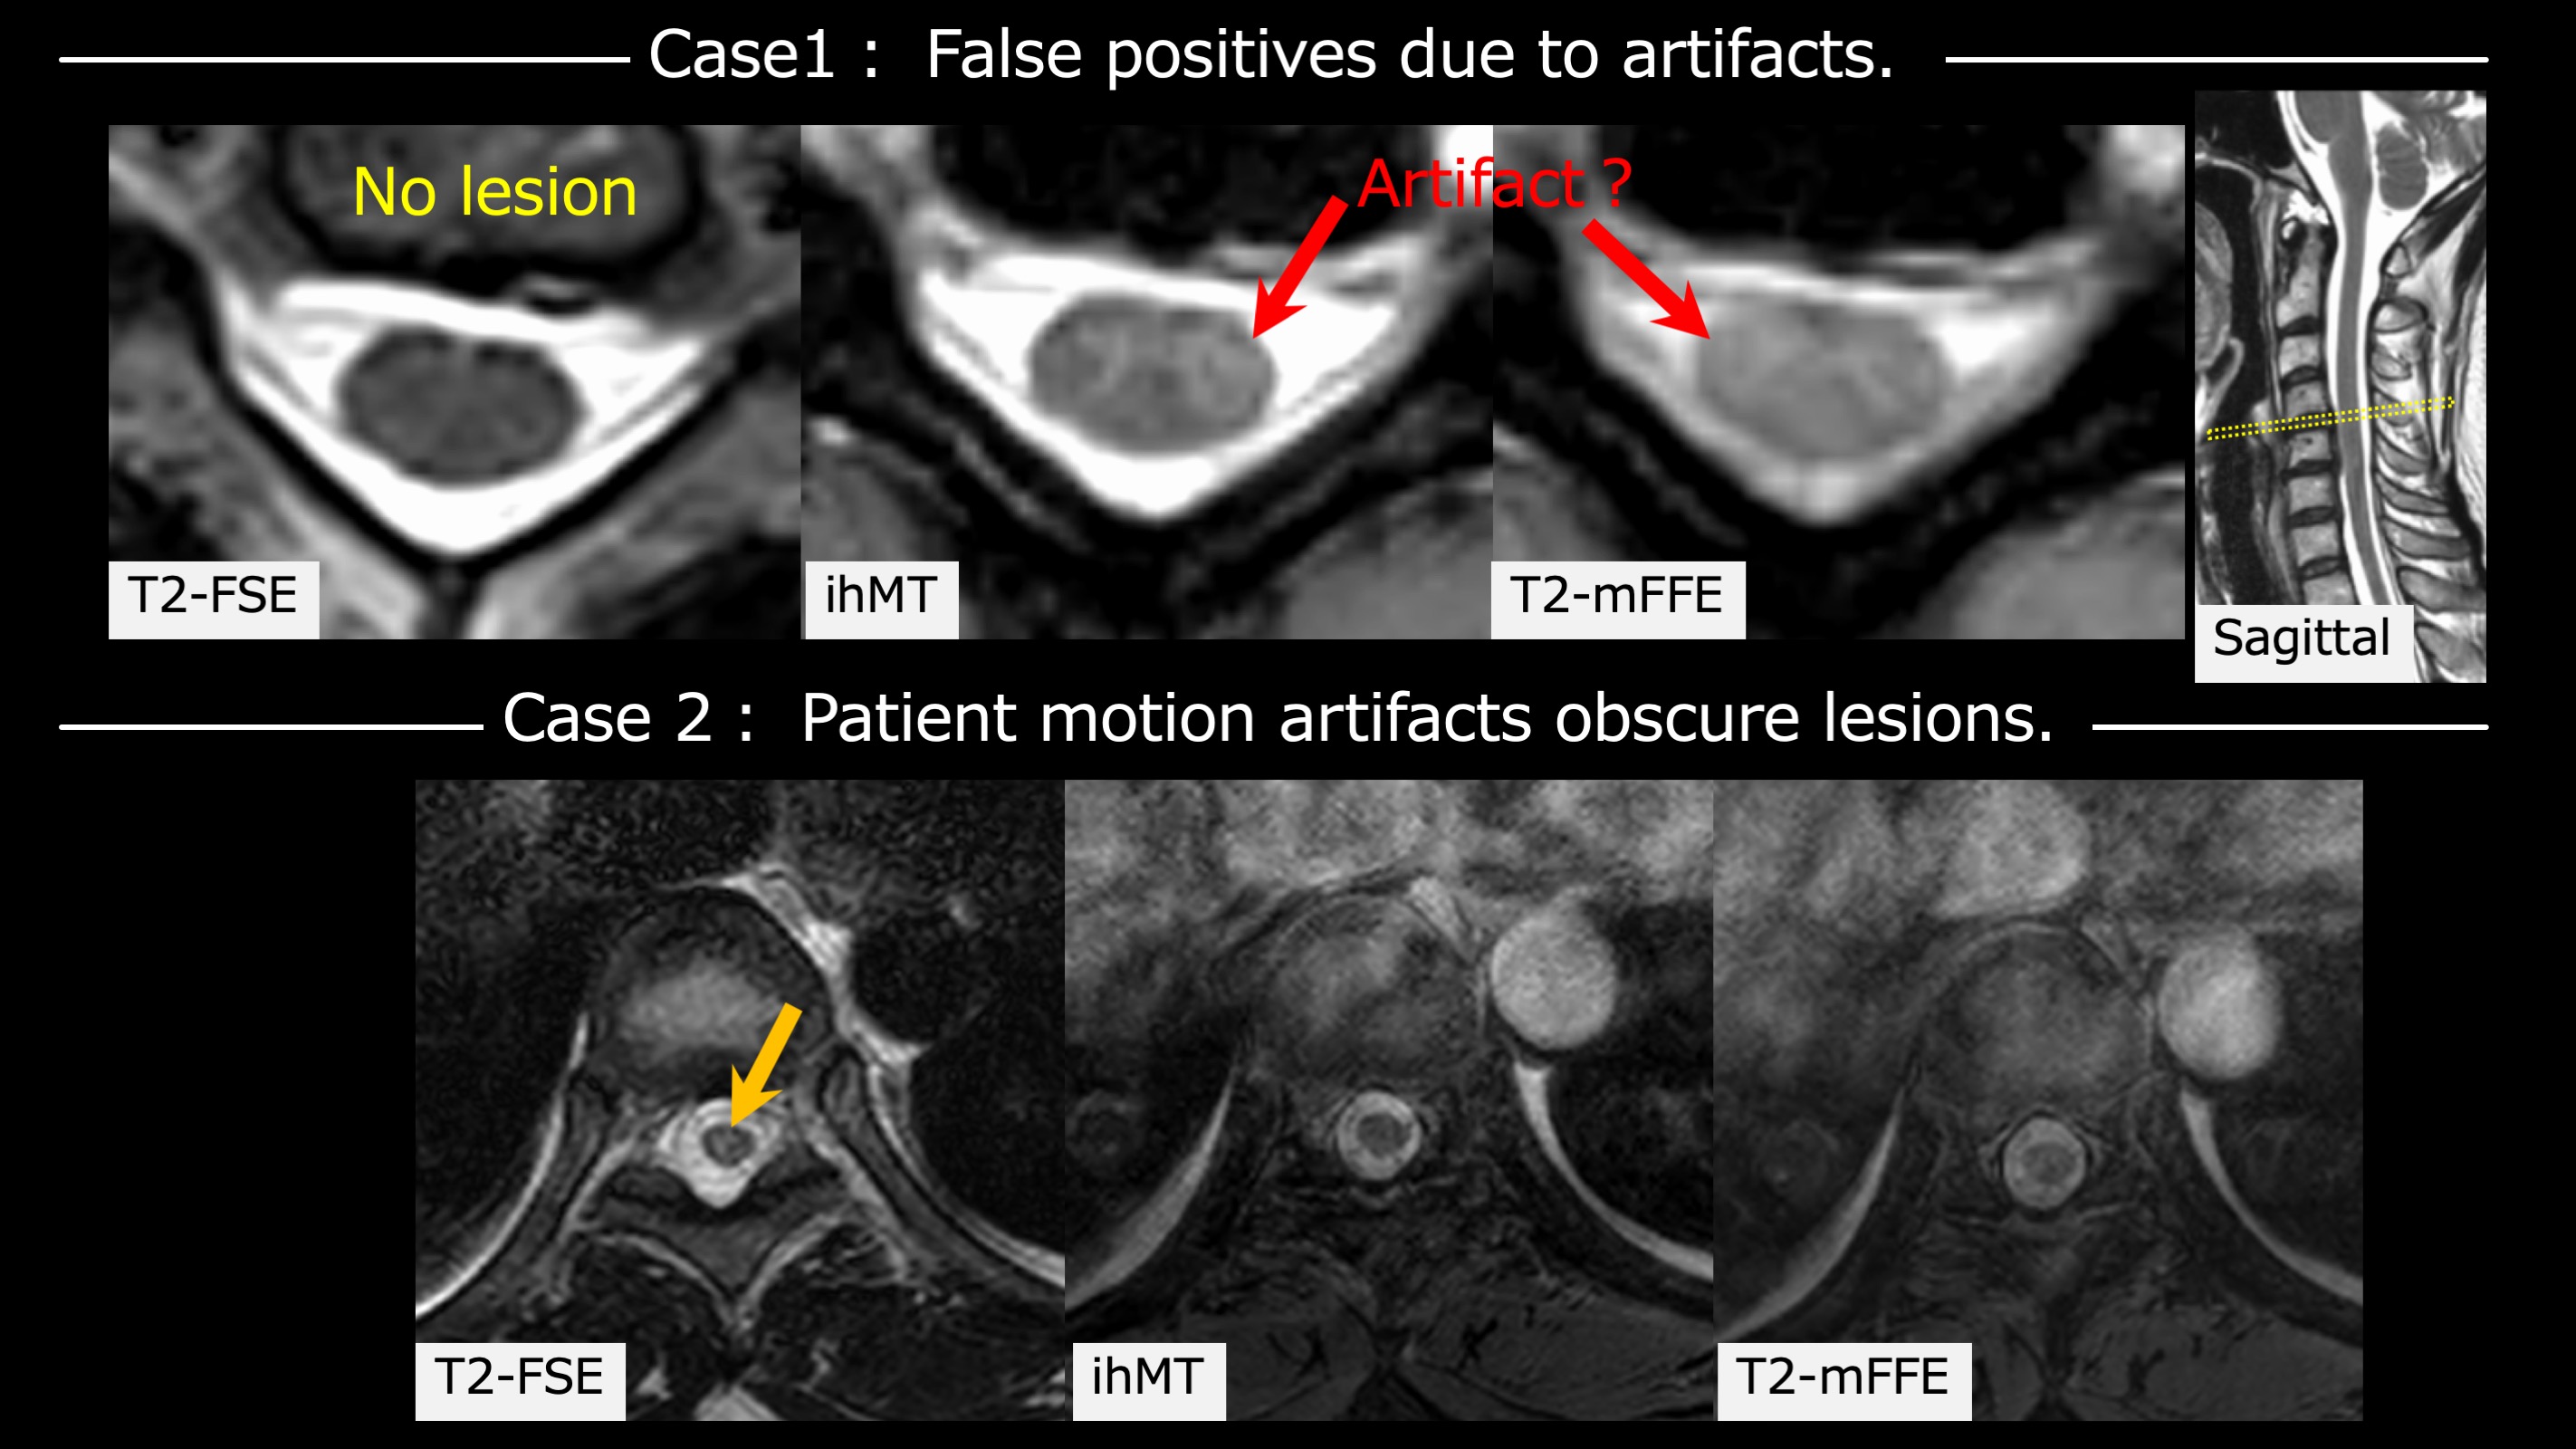
Figure 5. Case1(The top): Images of the cervical cord in a 52-year-old man with relapsing-remitting MS. The normal part of the spinal cord was depicted with a high signal due to some artifact, suggesting the possibility of a false positive.
Case2(The bottom): Images of the thoracic cord in a 25-year-old woman with relapsing-remitting MS. A lesion at the Th8-9 level is depicted in the arrows. The lesion was detected by T2-FSE, but poorly delineated by ihMT and T2-mFEE because it was obscured by patient motion artifacts.