2969
Role of the superficial white matter in processing speed decline in cerebral small vessel disease1The Second Affiliated Hospital of Zhejiang University School of Medicine, Hangzhou, China, 2Harvard Medical School, Boston, MA, United States
Synopsis
We assess microstructural alterations in superficial white matter (SWM) in cerebral small vessel disease (CSVD) and evaluate their contributions to the decline in processing speed, which is the main dysfunction in CSVD. We identify that the significant decline in processing speed may relate to the involvement of WMH in the SWM under high burden of disease. The increased extracellular free water may be the main SWM microstructural change under low burden of disease. These observations suggest that the SWM may serve as a potential target for monitoring pathophysiological processes in CSVD. This study extends the current understanding of CSVD-related dysfunction.
INTRODUCTION
Cerebral small vessel disease (CSVD) is the most important vascular contributor to cognitive decline[1]. White matter hyperintensities (WMH) are a typical feature of CSVD on magnetic resonance imaging (MRI) [2,3]. Diffusion MRI (dMRI) has provided important insights into white matter microstructural abnormalities underlying WMH and their associations with processing speed in CSVD patients [4,5]. Existing dMRI studies in CSVD have so far focused on the deep white matter (DWM) regions [2,4,7], while little attention has been paid to the superficial white matter (SWM), which is important to the processing speed. In this study, our primary goal is to employ imaging markers to investigate the role of the SWM in processing speed decline, the main cognitive deficit in CSVD [4,8]. First, we assess the effect of WMH burden on the SWM and DWM microstructure. Second, we assess the contribution of abnormalities in the SWM and the DWM towards processing speed. Third, we assess changes in the SWM (and DWM) microstructure and processing speed with different levels of WMH burden.METHODS
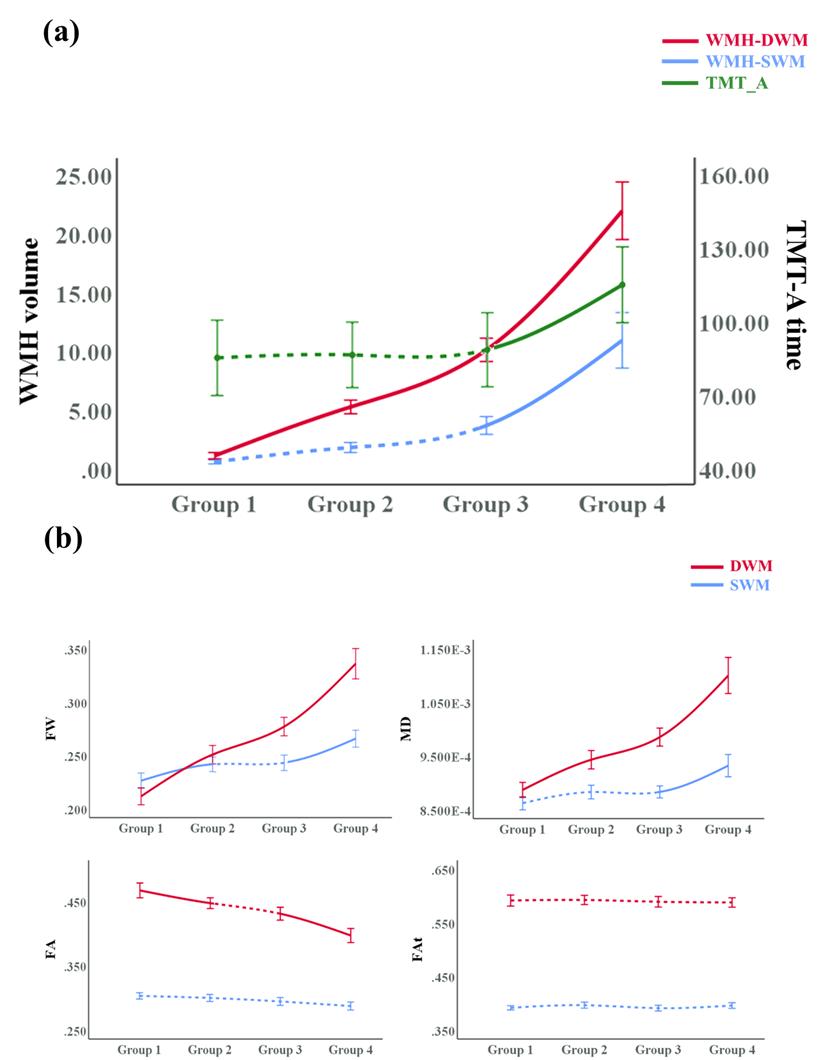
A total of 141 patients diagnosed with CSVD are studied. For each patient, multi-modal MRI data is acquired and the Trail Making Test Part A [9] is performed to assess processing speed. The entire cerebral white matter region is classified into the SWM and the DWM. Figure 1 gives an overview of the image processing steps for the computation of imaging markers of interest. Two types of imaging markers are computed, including WMH volume from T2-FLAIR and white matter microstructural measures from dMRI. For the diffusion measures, we analyzed fractional anisotropy and mean diffusivity computed using the conventional diffusion tensor model, and extracellular free-water (FW) and FW-corrected intracellular tissue FA (FAt) computed using the free-water model [10, 11]. Three analyses are performed. First, we assess the effect of WMH on white matter microstructure by examining the association of WMH volume with each diffusion measure in the SWM and the DWM. Second, we assess the relationship between the imaging markers and processing speed by analyzing the correlation of processing speed measures with the WMH volume and the diffusion measures in the SWM and DWM. Linear regression and random forest regression were analyzed to compare the contribution of each imaging marker to processing speed. Third, we assess changes in the SWM (and DWM) microstructure and cognitive performance in different levels of disease (in subgroups categorized by WMH volume). We identify the disease levels in which processing speed and imaging markers have significant between-group differences.RESULTS
We obtain the following main results, corresponding to the aforementioned three analyses. First, the contributions to processing speed of the SWM (as reflected in imaging markers) are higher than those of the DWM, despite the fact that the SWM has a lower WMH burden than the DWM. Second, SWM FW has the strongest association with processing speed among all imaging markers and, unlike the other diffusion MRI measures, significantly increases in subjects with low WMH burden (possibly representing early stages of disease). Third, under high burden of disease, the involvement of WMH in the SWM is accompanied by a significant decline in processing speed and significant changes in white matter microstructure.DISCUSSION
Our results extend the present literature on white matter changes and processing speed decline in CSVD, providing evidence for the importance of the SWM. The contributions of SWM imaging markers to processing speed were higher than those of the DWM in multivariable analyses (Fig. 2), despite the fact that the SWM had a lower WMH burden (Table 1). This finding indicates that SWM may play a role of limited change but significant effect in cognition. Considering that the SWM has the above-mentioned characteristics of limited changes but a significant effect on cognitive decline, the detection of subtle changes in the SWM is very important. In the analyses for different levels of WMH burden, the results showed that SWM microstructural changes can be detected by FW in subjects with a low WMH burden, which could not be achieved by conventional diffusion measures (Fig. 3). Besides, the significant cognitive decline may be a late event that may be related to the involvement of WMH-SWM. Therefore, it is possible that SWM imaging markers may be useful for monitoring the disease course, from early SWM microstructural change (characterized by SWM FW) to late pronounced cognitive decline (characterized by WMH-SWM).CONCLUSION
In this study, our findings identify SWM abnormalities in CSVD and suggest that the microstructural changes in the SWM contribute to processing speed, despite the relatively low WMH burden in the SWM. Increased extracellular FW may be the main SWM microstructural change under a low burden of disease. The significant decline in processing speed may relate to the involvement of WMH in the SWM under a high burden of disease. These observations suggest that the SWM may serve as a potential target for monitoring pathophysiological processes in CSVD. This study highlights that the importance of SWM may be underestimated in previous CSVD studies.Acknowledgements
The authors gratefully acknowledge the following funding grants:RK: P41 EB015902 (NAC), P41EB028741 (AT-NCIGT), R01 CA235589 (LNQ), National Cancer Data Ecosystem, Task Order No. 413 HHSN26110071 under Contract No. HHSN261201500003l; LJO and FZ: R01MH119222, R01MH125860, P41EB015902, R01MH074794; FZ also acknowledges a BWH Radiology Research Pilot Grant Award; NM: R01MH125860, R01MH112748, R01MH111917, K24MH116366, R01AG042512, R21DA042271; MZ: the National Natural Science Foundation of China (Grant Nos. 81771820, 82101987 & 81901706), and the Natural Science Foundation of Zhejiang Province (Grant No. LSZ19H180001), the China Postdoctoral Science Foundation (Grant No. 2019M662083) and the Zhejiang province Postdoctoral Science Foundation.References
1. Wardlaw JM, Smith C, Dichgans M. Small vessel disease: mechanisms and clinical implications. Lancet Neurol. 2019;18: 684–696.
2. Wardlaw JM, Smith EE, Biessels GJ, Cordonnier C, Fazekas F, Frayne R, et al. Neuroimaging standards for research into small vessel disease and its contribution to ageing and neurodegeneration. Lancet Neurol. 2013;12: 822–838.
3. Fazekas F, Chawluk JB, Alavi A, Hurtig HI, Zimmerman RA. MR signal abnormalities at 1.5 T in Alzheimer’s dementia and normal aging. AJR Am J Roentgenol. 1987;149: 351–356.
4. Hamilton OKL, Backhouse EV, Janssen E, Jochems ACC, Maher C, Ritakari TE, et al. Cognitive impairment in sporadic cerebral small vessel disease: A systematic review and meta-analysis. Alzheimers Dement. 2021;17: 665–685.
5. Duering M, Gesierich B, Seiler S, Pirpamer L, Gonik M, Hofer E, et al. Strategic white matter tracts for processing speed deficits in age-related small vessel disease. Neurology. 2014;82: 1946–1950.
6. Vergoossen LWM, Jansen JFA, van Sloten TT, Stehouwer CDA, Schaper NC, Wesselius A, et al. Interplay of White Matter Hyperintensities, Cerebral Networks, and Cognitive Function in an Adult Population: Diffusion-Tensor Imaging in the Maastricht Study. Radiology. 2021;298: 384–392.
7. Cremers LGM, de Groot M, Hofman A, Krestin GP, van der Lugt A, Niessen WJ, et al. Altered tract-specific white matter microstructure is related to poorer cognitive performance: The Rotterdam Study. Neurobiol Aging. 2016;39: 108–117.
8. Hamilton OKL, Cox SR, Okely JA, Conte F, Ballerini L, Bastin ME, et al. Cerebral small vessel disease burden and longitudinal cognitive decline from age 73 to 82: the Lothian Birth Cohort 1936. Transl Psychiatry. 2021;11: 376.
9. Bowie CR, Harvey PD. Administration and interpretation of the Trail Making Test. Nat Protoc. 2006;1: 2277–2281.
10. Pasternak O, Sochen N, Gur Y, Intrator N, Assaf Y. Free water elimination and mapping from diffusion MRI. Magn Reson Med. 2009;62: 717–730.
11. Pasternak O, Kelly S, Sydnor VJ, Shenton ME. Advances in microstructural diffusion neuroimaging for psychiatric disorders. Neuroimage. 2018;182: 259–282.
Figures
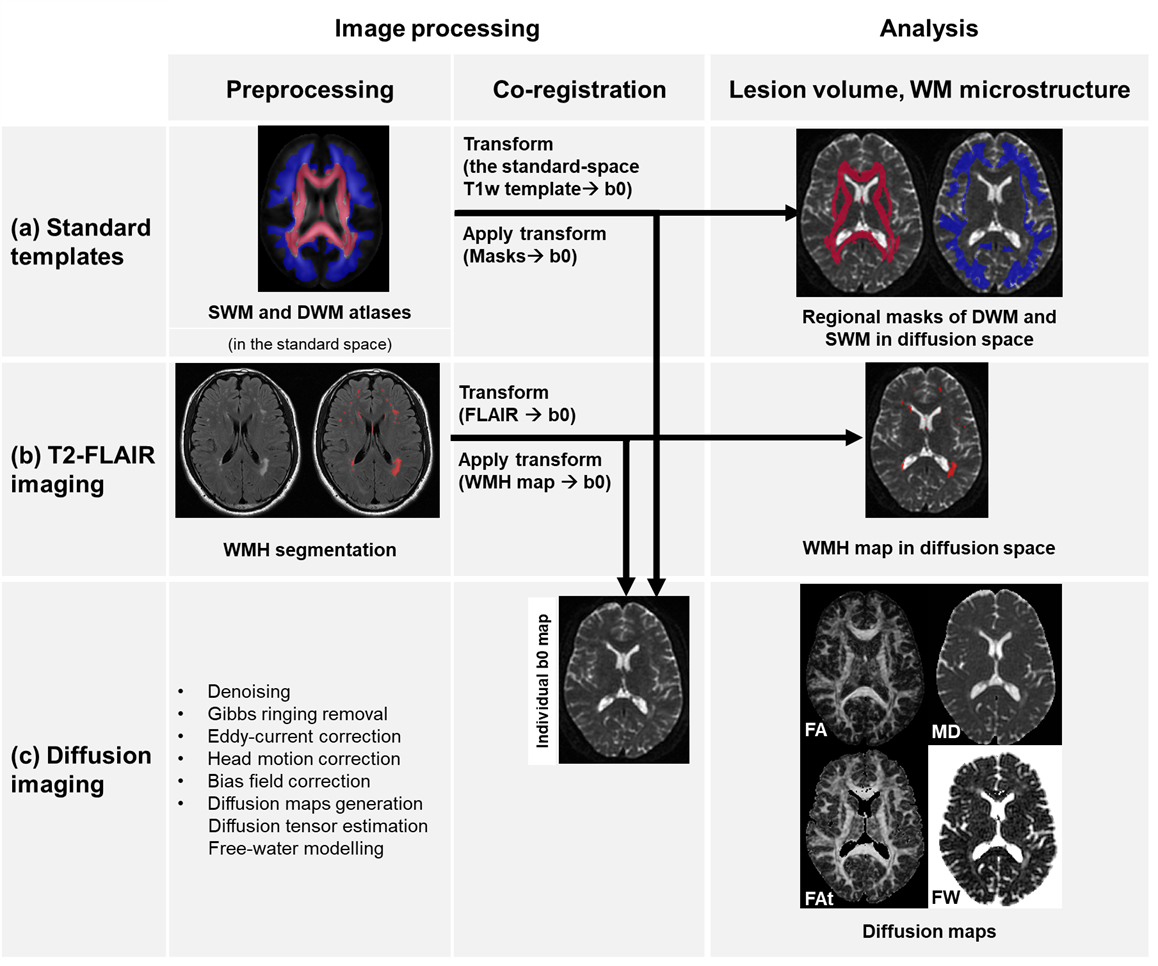
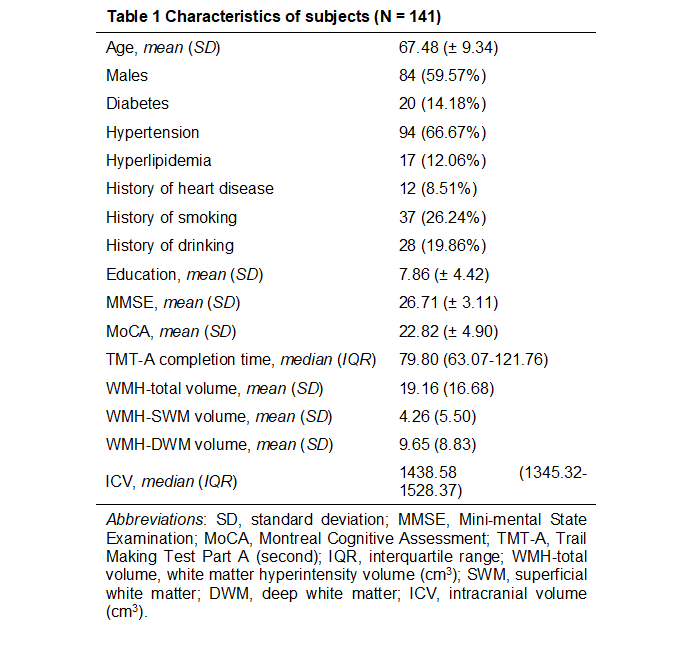
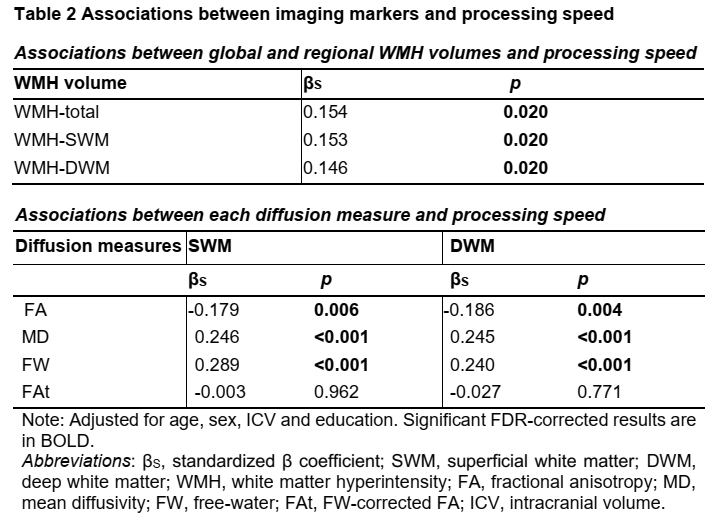
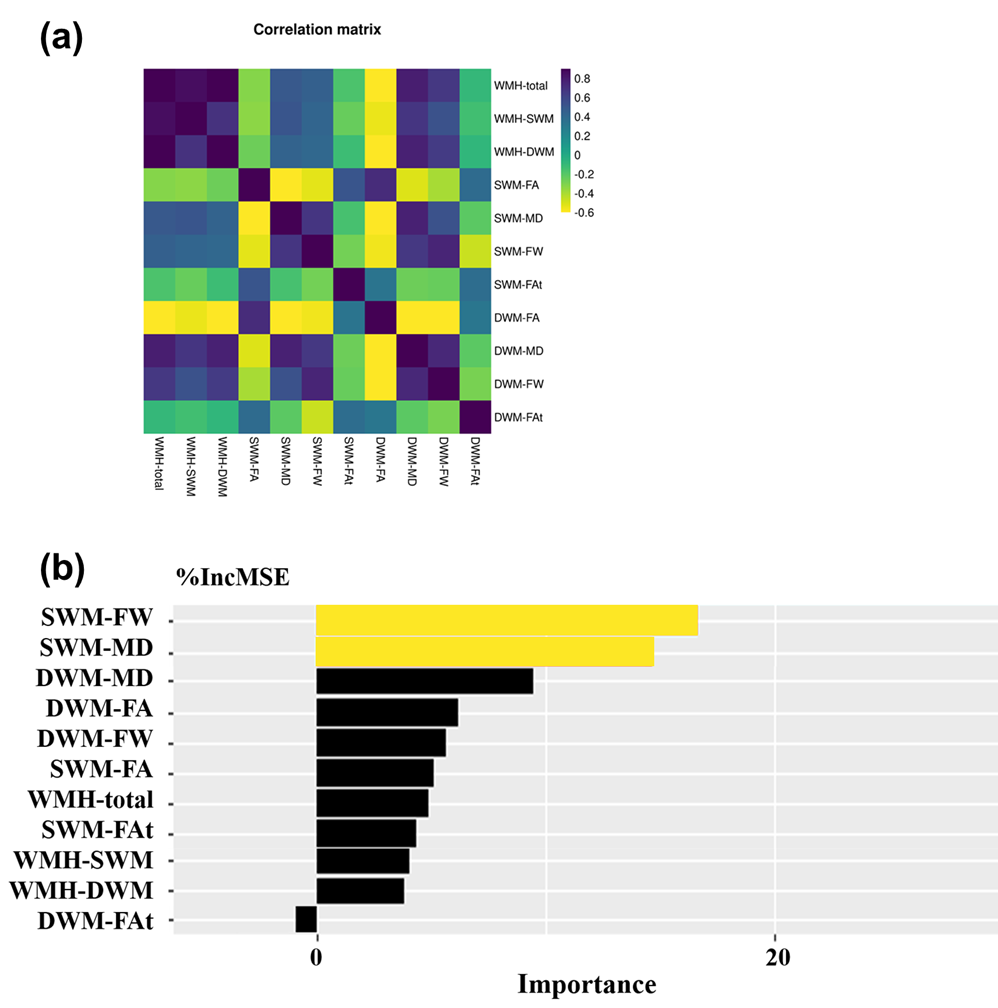
Figure 2. (a) Correlation matrix illustrating the degree of intercorrelation between imaging markers. (b) Multivariable analyses. Random forest regressions for estimating the importance of independent variables with regard to processing speed (dependent variable) while accounting for all other variables. Significant variables are highlighted in red. Variables are sorted by the increase in MSE (%IncMSE).