2968
Radiation-induced White Matter Abnormalities in Nasopharyngeal Carcinoma: Evaluation by DKI and NODDI1School of Biomedical Engineering, Southern Medical University, Guangzhou, China, 2Department of Medical Imaging, Sun Yat-sen University Cancer Center, State Key Laboratory of Oncology in South China, Collaborative Innovation Center for Cancer Medicine, Guangdong Key Laboratory of Nasopharyngeal Carcinoma Diagnosis and Therapy, Guangzhou, China
Synopsis
Based on the multi-shell diffusion MRI data acquisition and tract-based spatial statistics (TBSS), we conducted a longitudinal study to explore the changing patterns of DKI and NODDI metrics after radiotherapy for nasopharyngeal carcinoma (NPC) patients. We found most of the significant regions showed a “self-recovery” mechanism but the temporal lobe regions show a progressive changing pattern over time after RT. Besides, we also found that the change of DKI metrics has a stronger dose-correlation than DTI and NODDI metrics. Our study indicates the DKI and NODDI metrics can provide more comprehensive brain microstructure changes compared with conventional DTI.
Introduction
The radiotherapy (RT) for NPC patients can inevitably cause brain structural abnormalities and cognitive decline which can be characterized by altered white matter microstructural properties. Recently, there are a few studies investigated the changes of whole-brain WM by TBSS analysis of DTI model in NPC patients1,2. However, the TBSS results are inconsistent across different studies which may be partly due to the limitations of the diffusion tensor model in complex brain microstructure. Compared with DTI, the multi-shell models, such as DKI3 and NODDI4, can better reflect diffusional heterogeneity and microstructural complexity, which have been shown to be more sensitive and interpretable in detecting the microstructure changes of brain tissue. Besides, most existing neuroimaging studies with structural MRI are cross-sectional studies in NPC patients1,2. They focus on only one post-RT period, or the data with different post-RT duration are not from the same group of NPC patients in which the cohort effect can compromise the ability to detect the RT-induced brain alteration. The purpose of our study is to longitudinally explore the dynamic evolution of whole-brain WM over time after completing RT based on DTI, DKI and NODDI metrics using TBSS.Methods
We recruited 28 NPC patients receiving radiotherapy and each patient was repeatedly scanned at four periods: before RT (baseline), 0~3 (acute), 6 (early-delayed) and 12 months (late-delayed) after RT (Table 1).Multi-shell DWI data were acquired on a 3.0T GE scanner with SE-EPI: TR/TE=5300/79.3 ms, FOV=256×256 mm2, image resolution=128×128, number of diffusion gradient directions=2/25/25 at b=0/1000/2000 s/mm2 respectively.
After denoising, Gibbs ringing removal, motion and eddy correction, the preprocessed DWI data were fitted to DTI model using FSL5 and DKI model using Diffusional Kurtosis Estimator6. The diffusion metrics (FA, MD) and kurtosis metrics (MK, RK, AK) used in our study were generated. Besides, maps of neurite density index (NDI), orientation dispersion index (ODI) were generated using the Accelerated Microstructure Imaging via Convex Optimization (AMICO)7.
Then, the TBSS8 analysis on the above metrics were conducted using FSL. The one-way repeated measures analysis of variance (ANOVA) was used to compare four groups at the baseline, and three following-up stages after RT. After that, a post-hoc analysis (multiple comparisons) was performed by using paired T-test to compare each pair of four groups.
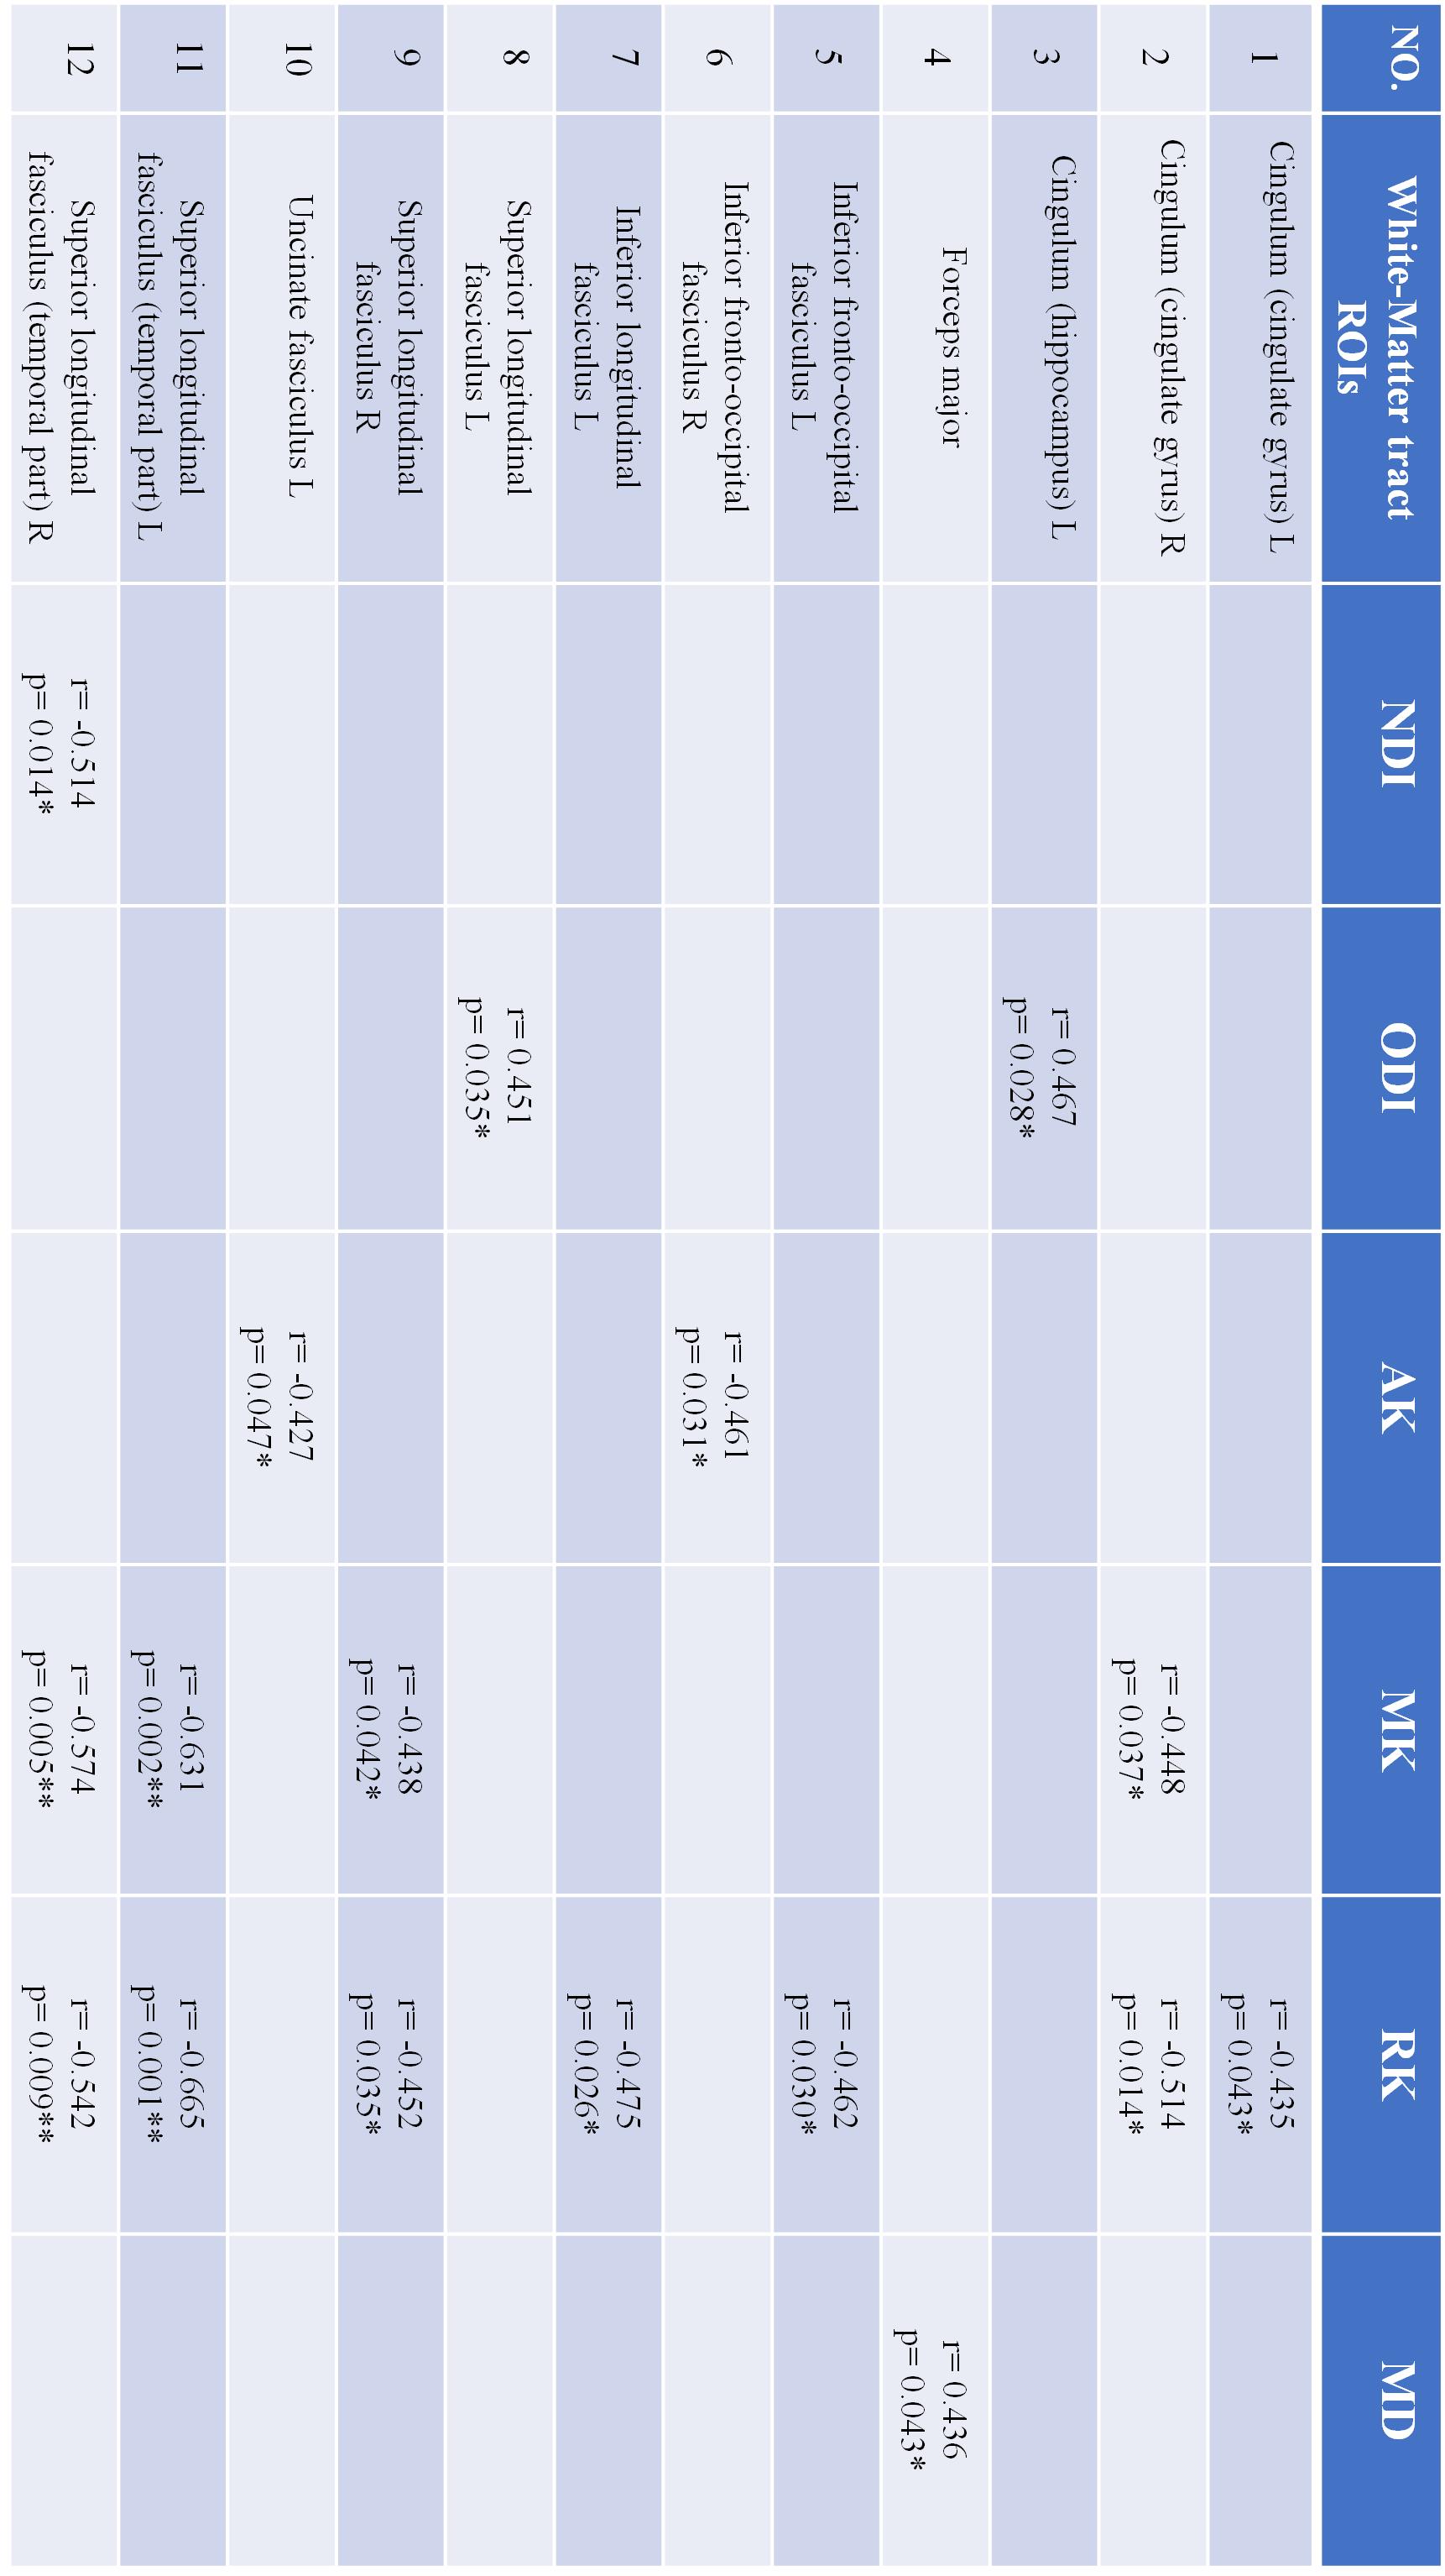
The JHU tractography atlas is used to assess the correlation of all metrics with radiotherapy dose in well-defined ROIs. For each participant, the mean metric value of voxels within an ROI was calculated. Then the dose-dependency was investigated using Spearman's rank correlation coefficient.
Results
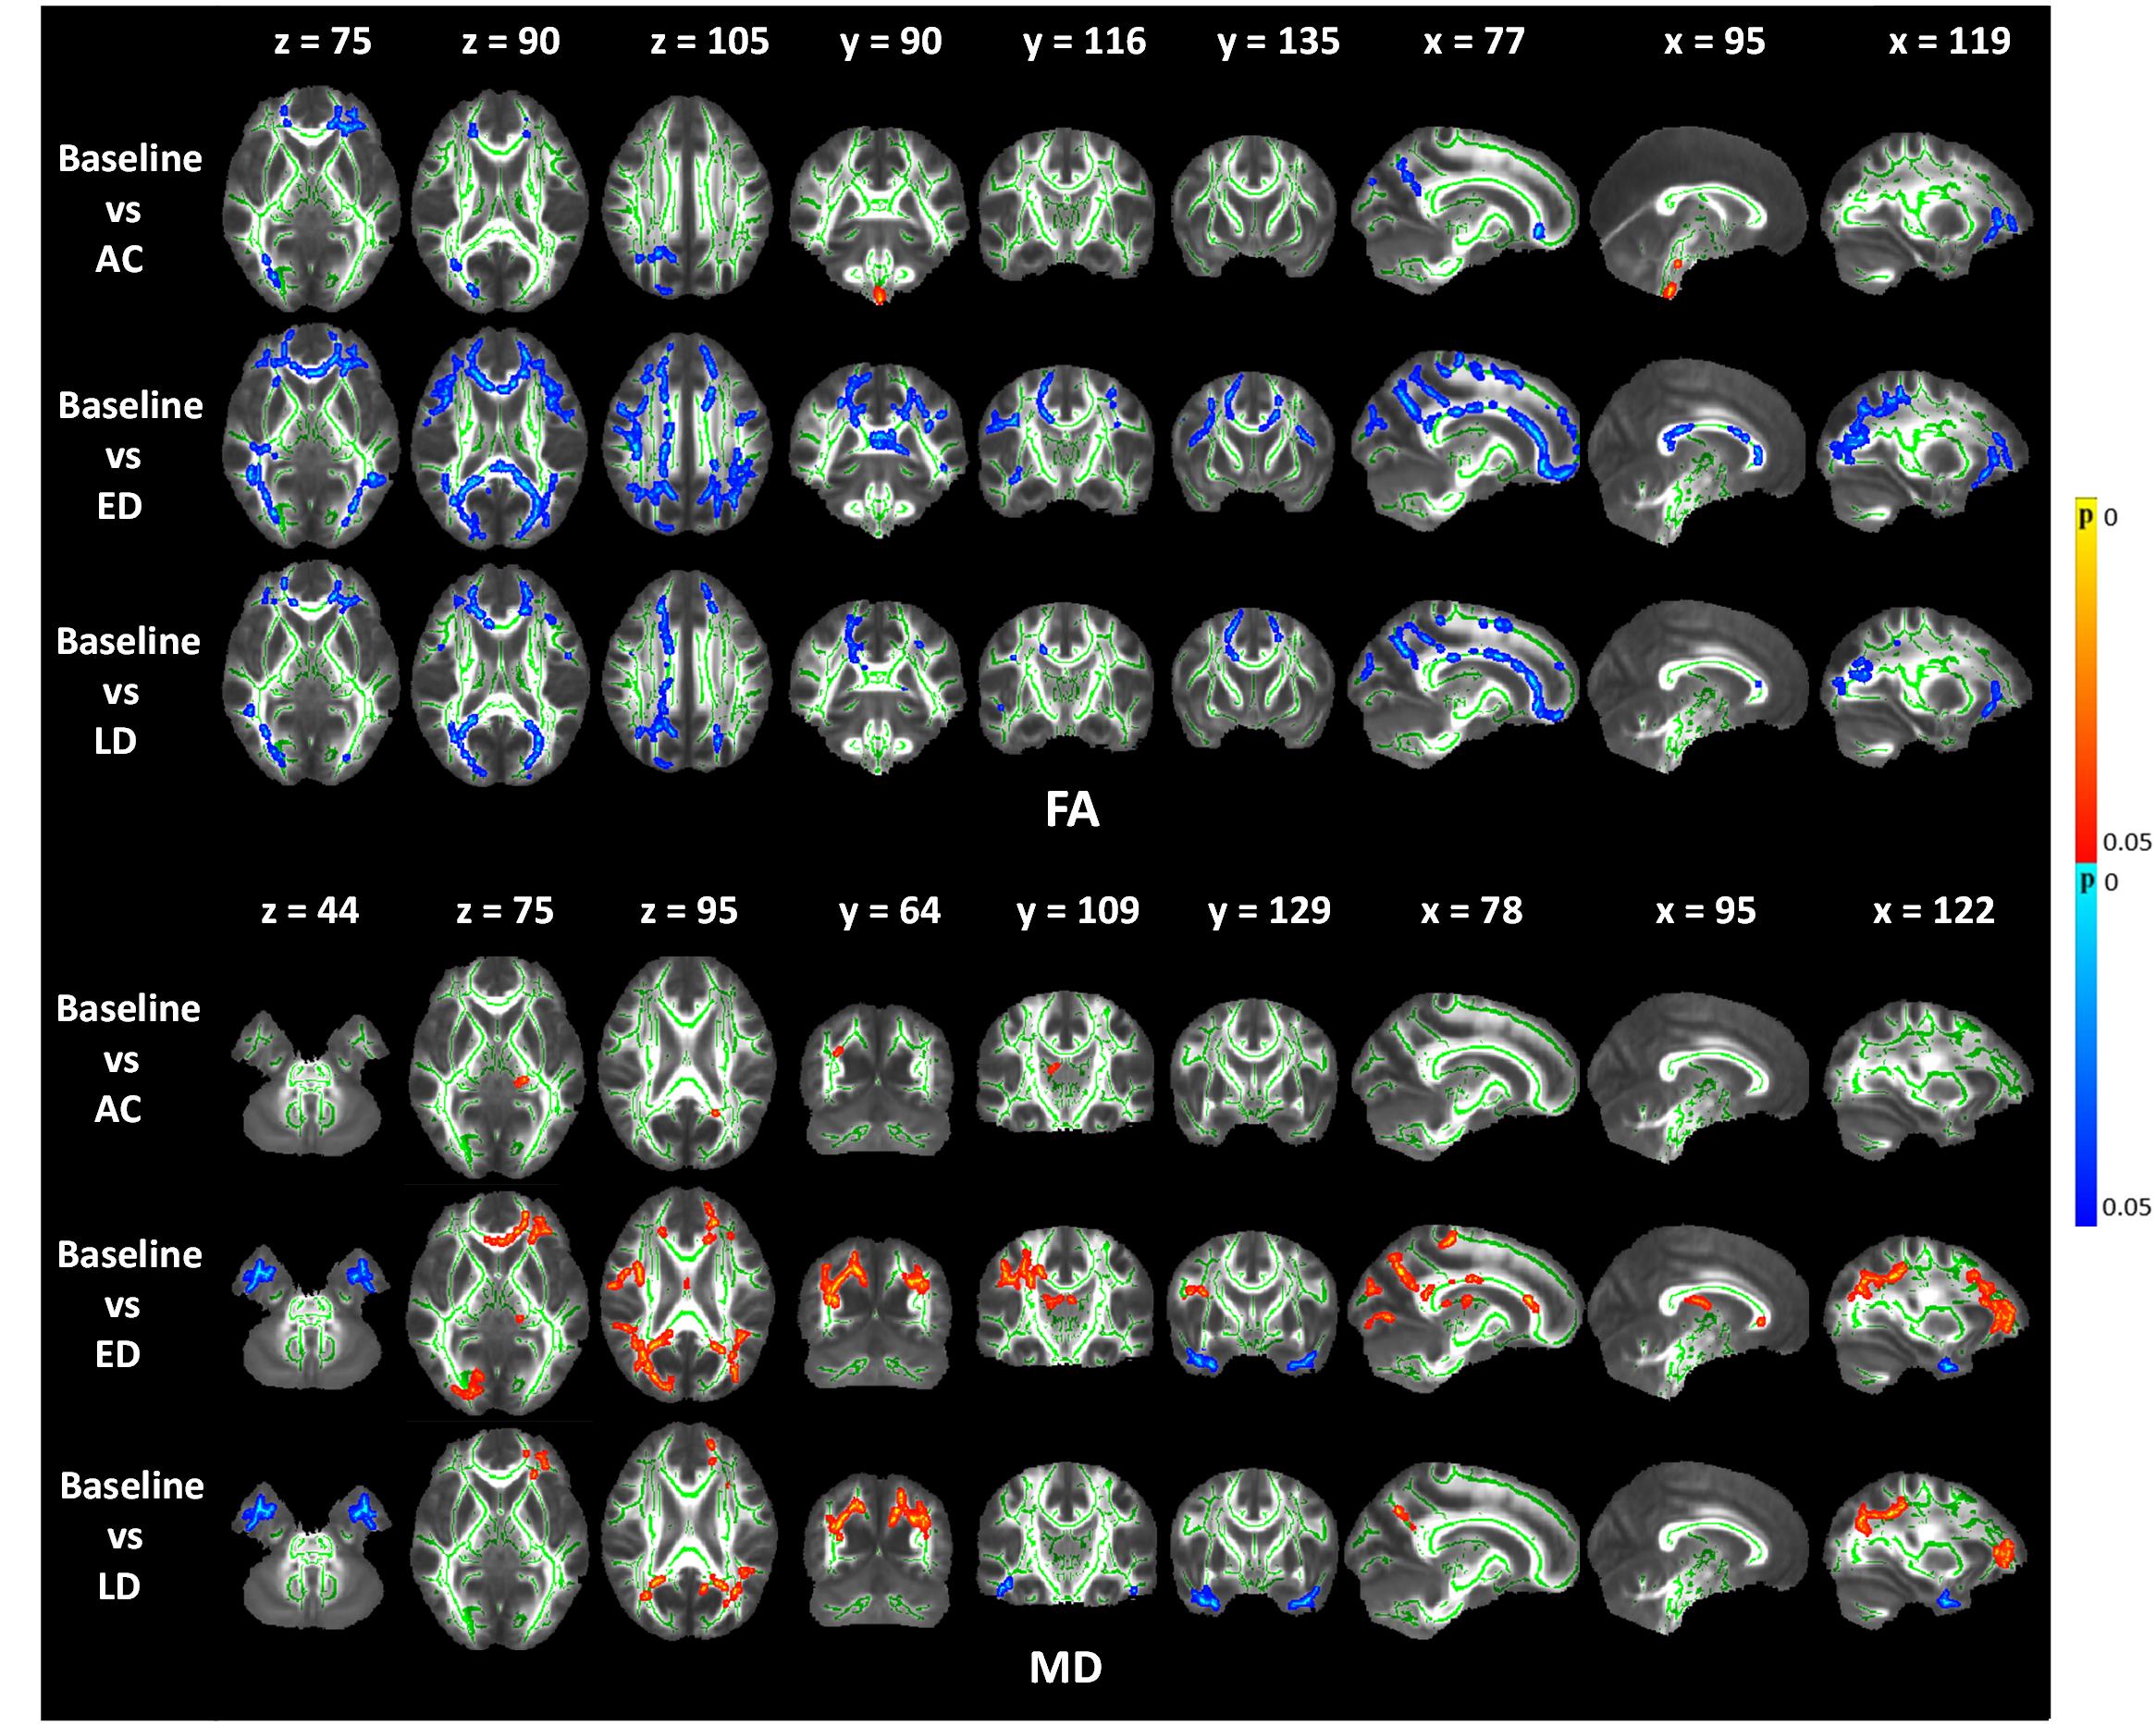
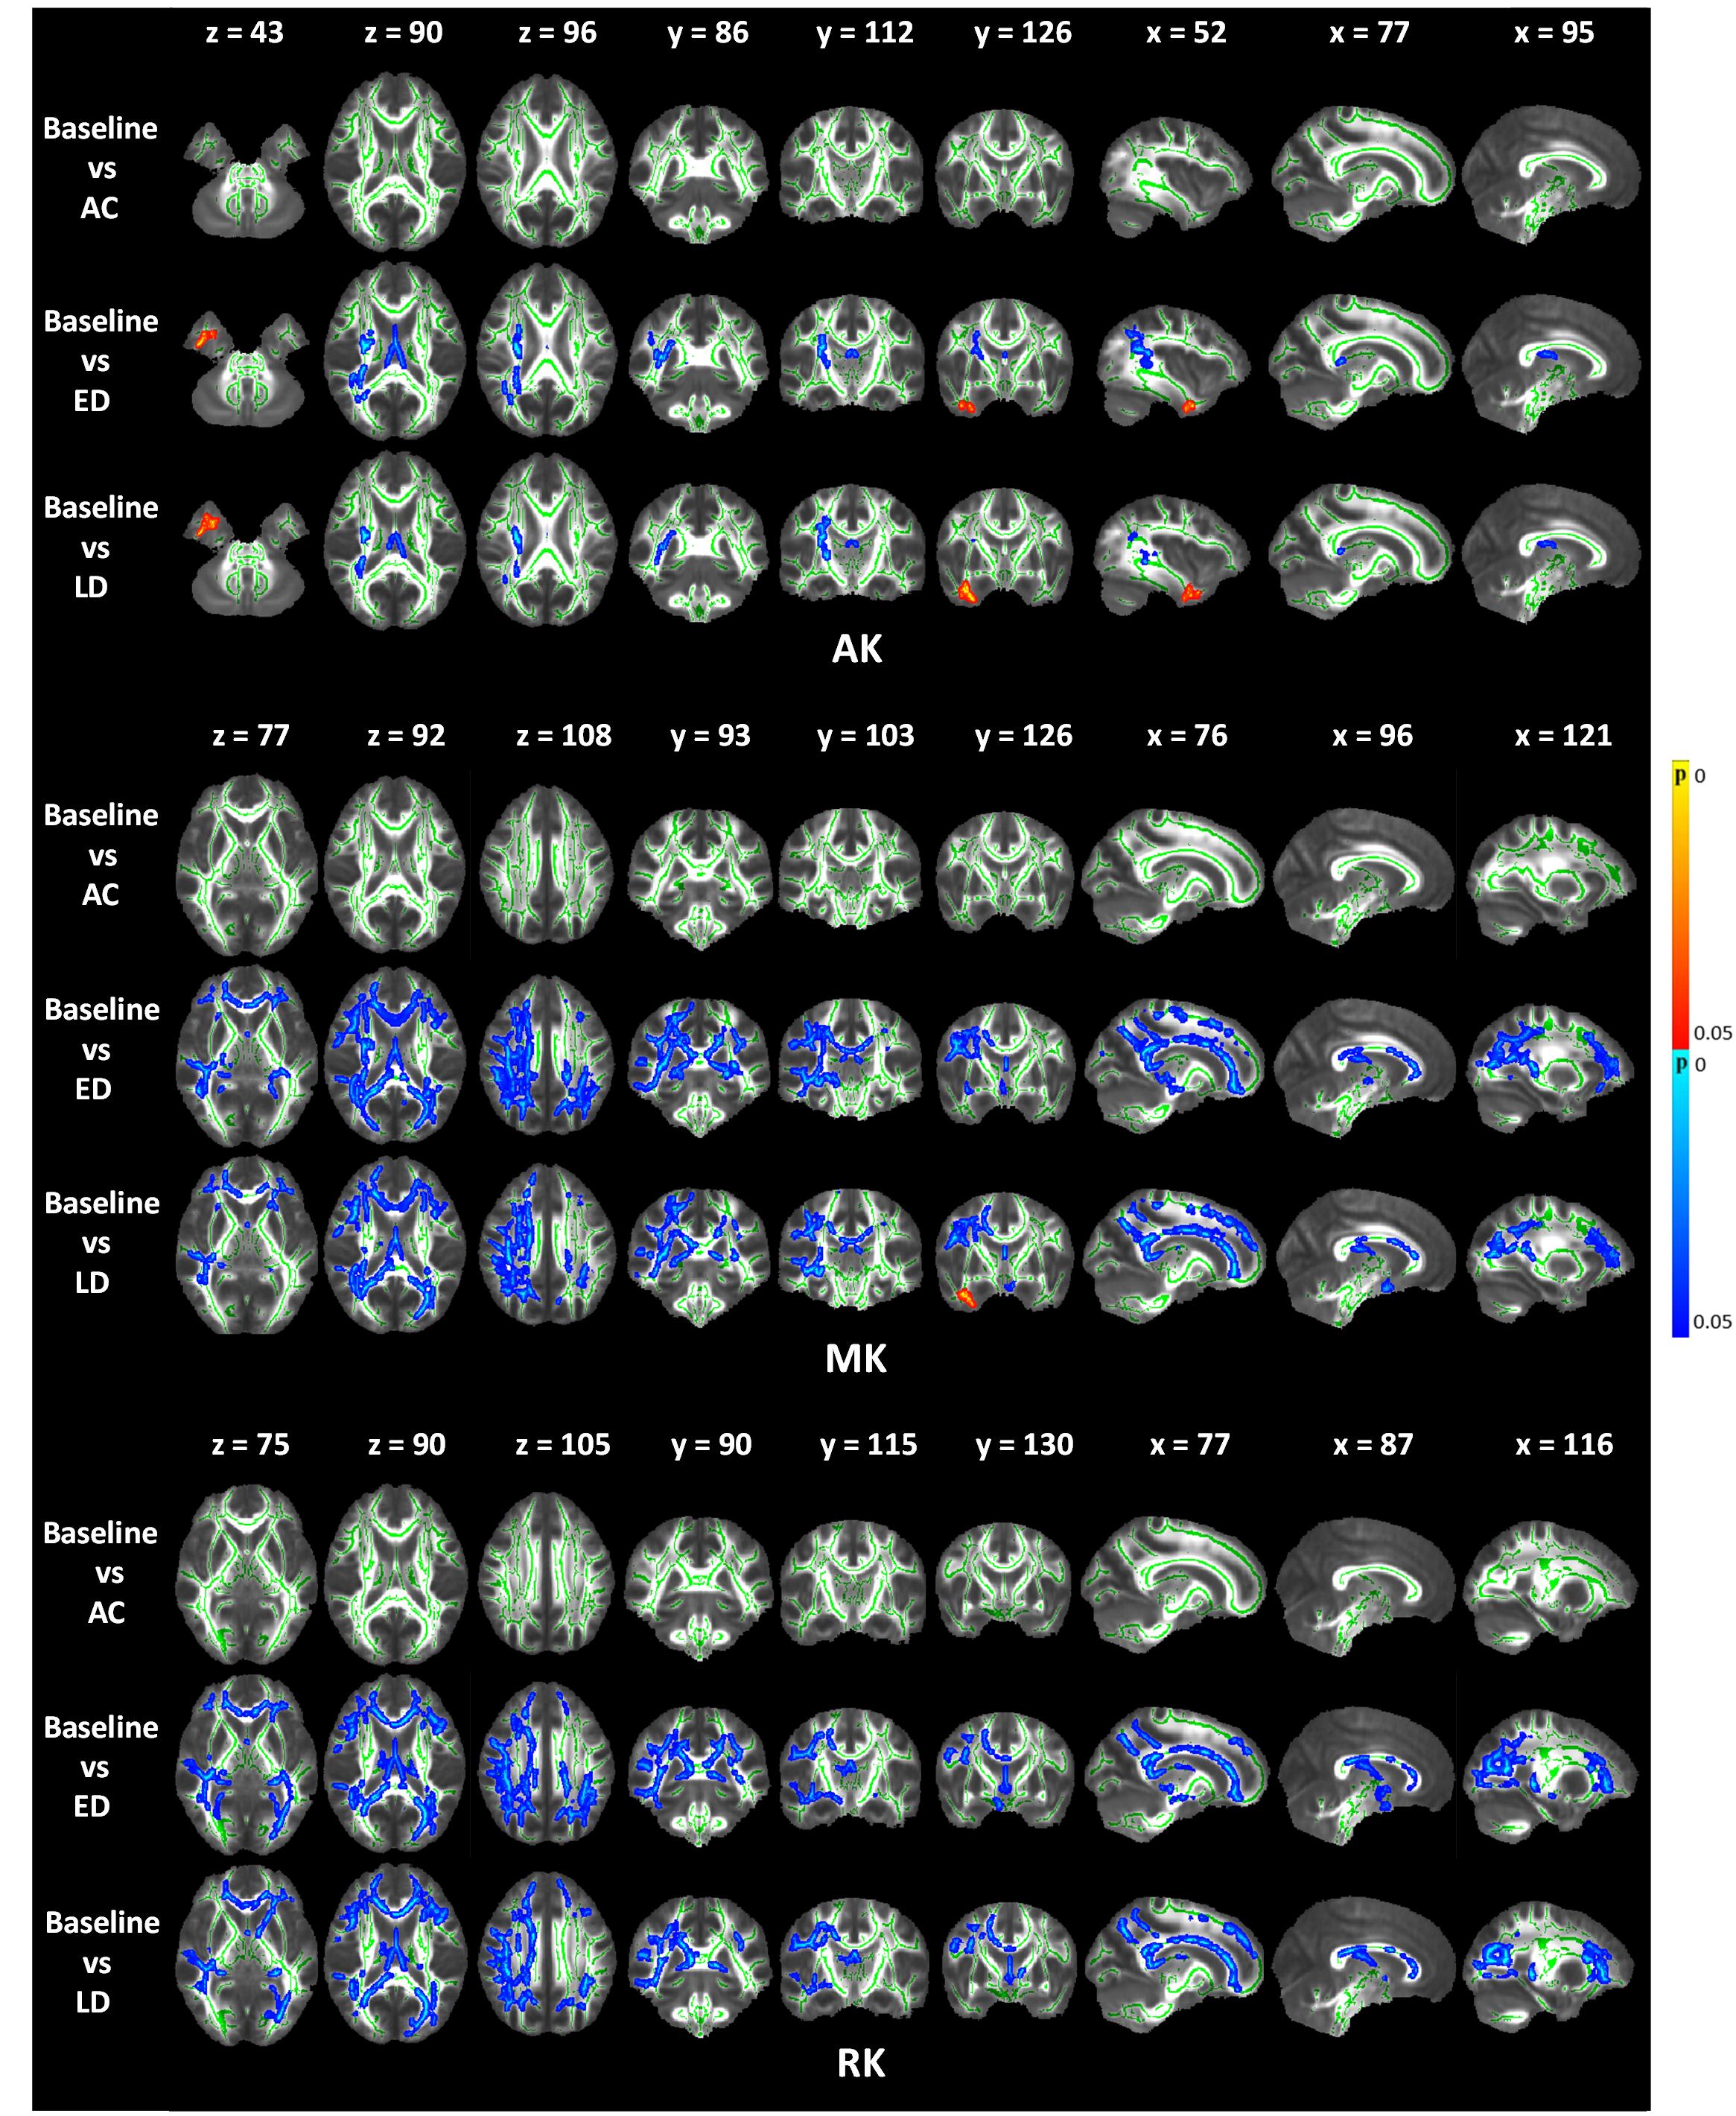
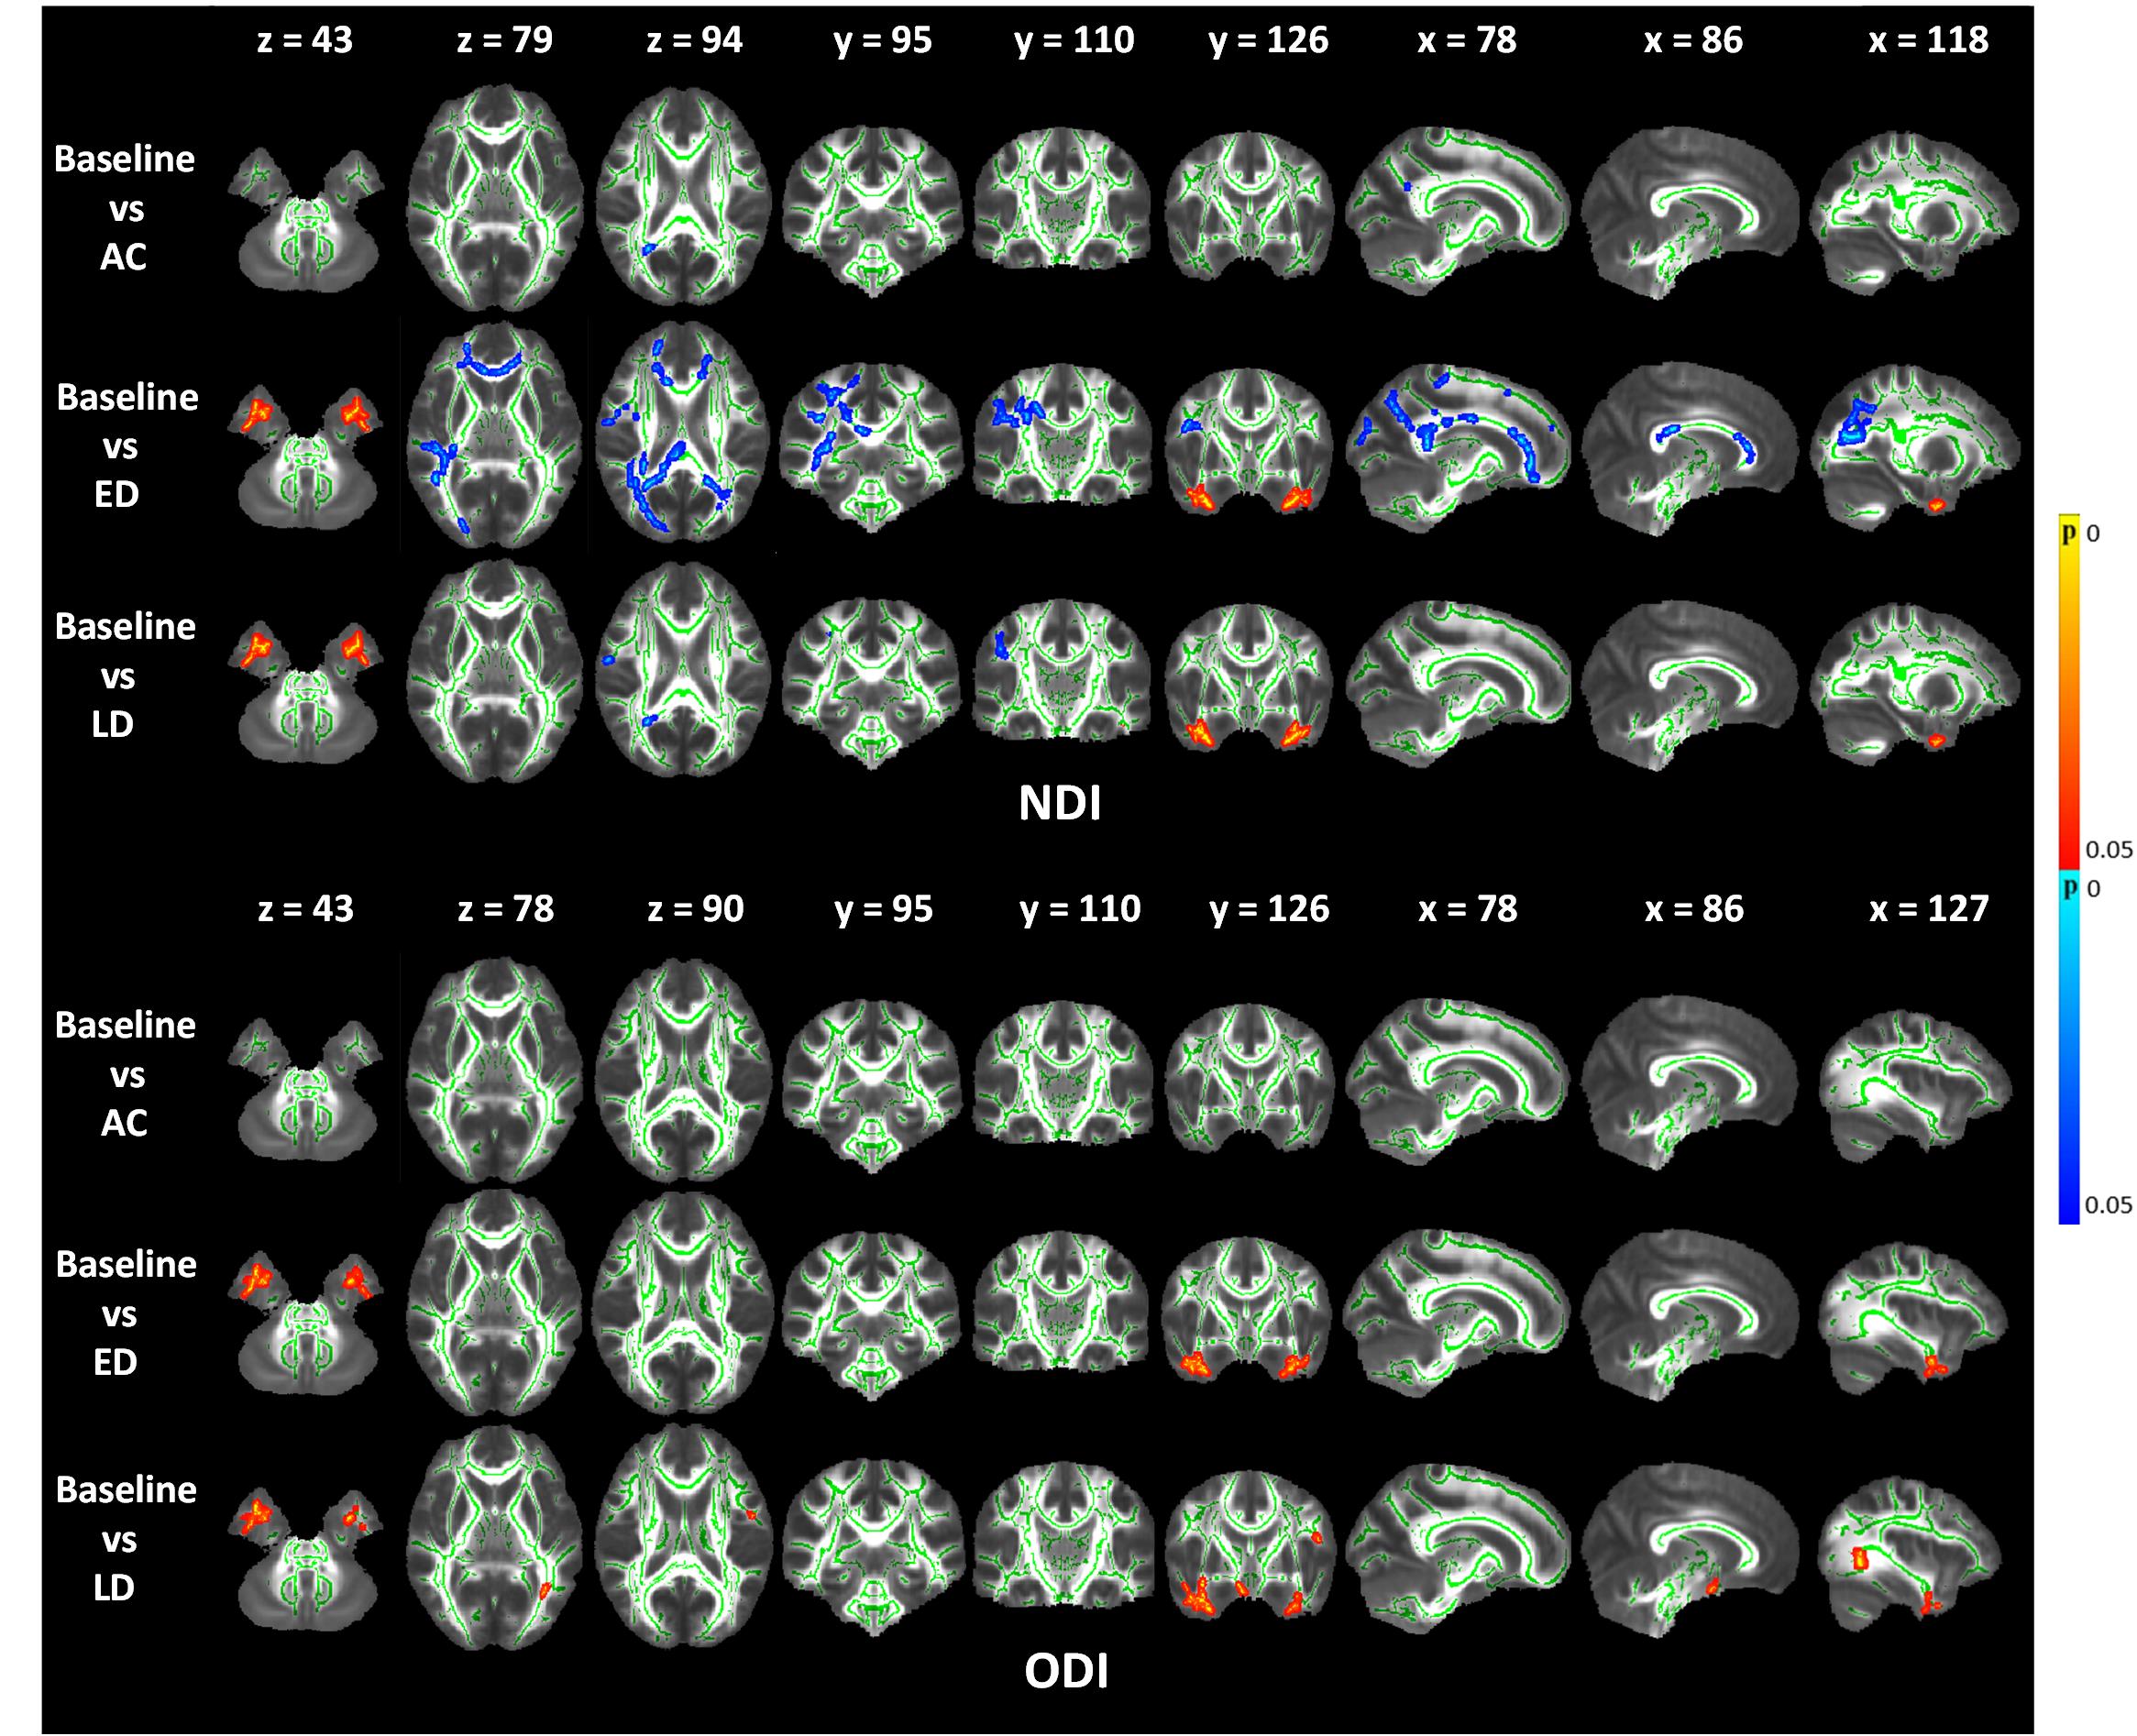
The FA shows a significant decrease across wide regions in the frontal and occipital lobes at the early delayed and late-delayed stages, compared to baseline. A significant cluster in the brainstem show increased FA. We also observed the significant clusters in the frontal and occipital lobes show increased MD and in the bilateral temporal lobe show decreased MD compared to baseline (Figure 1). Further, the DKI metrics, AK, MK and RK, show significant decrease in the frontal and occipital lobes after RT but the significant regions have hemispheric specificity, which mostly cluster in the right hemisphere. In the right temporal lobe, we observed increased AK and MK after RT (Figure 2). Furthermore, NDI shows significant decrease mainly in the right frontal and occipital lobes. The significant clusters in bilateral temporal lobe show increase NDI and ODI compared to baseline (Figure 3).Moreover, we observed the significant regions of all metrics were greatest at early-delayed stage when compared to the baseline but reduced at late-delayed stage. However, the temporal lobe shows a progressive increase or decrease from early-delayed stage to late-delayed stage.
Table 2 is the correlation results of all metrics with radiotherapy dose in ROIs at early-delayed stage. The dose-dependency ROIs are generally consistent with the TBSS significant clusters.
Discussion & Conclusion
The TBSS results show the most regions of significant change after RT are located in the frontal, occipital and temporal lobes. Most of the significant regions showed a “self-recovery” mechanism, which may indicate that the structural brain reorganization mainly occurred in the late-delay stage. This result is generally consistent with previous studies1,9,10. The DKI and NODDI metrics can provide more comprehensive microstructure changes of brain tissue compared with DTI, especially the changes in temporal lobe which is often within the RT target volume and inevitably receives high-dose radiation. Late delayed temporal injuries have been well documented as irreversible11,12. This might explain why the temporal lobe show a progressive changing pattern without recovering tendency like other significant regions. Besides, we also found that the change of DKI metrics has a stronger dose-correlation than DTI and NODDI metrics at early-delayed stage. Our study reveals the DKI and NODDI metrics can be used as the new imaging markers to reflect brain microstructural change which can provide more comprehensive insights into neuropathology mechanism of RT-induced brain injuries.Acknowledgements
This study was supported by the National Natural Science Foundation of China under Grant 61971214, the Natural Science Foundation of Guangdong Province under Grant 2019A1515011513, the Guangdong-Hong Kong-Macao Greater Bay Area Center for Brain Science and Brain-Inspired Intelligence Fund under Grant 2019022.References
1. Duan, F., Cheng, J., Jiang, J., Chang, J., Zhang, Y., & Qiu, S. (2016). Whole-brain changes in white matter microstructure after radiotherapy for nasopharyngeal carcinoma: a diffusion tensor imaging study. Eur Arch Otorhinolaryngol, 273(12), 4453-4459. doi:10.1007/s00405-016-4127-x.
2. Leng X, Fang P, Lin H, An J, Tan X, Zhang C, et al. Structural MRI research in patients with nasopharyngeal carcinoma following radiotherapy: a DTI and VBM study. Oncol Lett. (2017) 14:6091–6. doi: 10.3892/ol.2017.6968.
3. Jensen JH, Helpern JA, Ramani A, Lu H, Kaczynski K. Diffusional kurtosis imaging: the quantification of non-Gaussian water diffusion by means of MRI. Magn Reson Med 2005; 1432 to 1440. 4. Zhang H, Schneider T, Wheeler-Kingshott CA, Alexander DC (2012): NODDI: practical in vivo neurite orientation dispersion and density imaging of the human brain. NeuroImage 61:1000–1016.
5. Jenkinson M, Beckmann CF, Behrens TE, Woolrich MW, Smith SM (2012): Fsl. NeuroImage 62:782–790.
6. Tabesh A, Jensen JH, Ardekani BA, and Helpern JA. Estimation of tensors and tensor-derived measures in diffusional kurtosis imaging. Mag Reson Med. 2011 Mar;65(3):823-36.
7. Alessandro Daducci, Erick Canales-Rodriguez, Hui Zhang, Tim Dyrby, Daniel Alexander, Jean-Philippe Thiran. (2015). Accelerated Microstructure Imaging via Convex Optimization (AMICO) from diffusion MRI data. NeuroImage 105, pp. 32-44.
8. Smith SM, Jenkinson M, Johansen-Berg H, Rueckert D, Nichols TE, Mackay CE, et al. (2006): Tract-based spatial statistics: Voxelwise analysis of multi-subject diffusion data. Neuroimage 31:1487–1505.
9. Wang, H. Z., Qiu, S. J., Lv, X. F., Wang, Y. Y., Liang, Y., Xiong, W. F., & Ouyang, Z. B. (2012). Diffusion tensor imaging and 1H-MRS study on radiation-induced brain injury after nasopharyngeal carcinoma radiotherapy. Clin Radiol, 67(4), 340-345. doi:10.1016/j.crad.2011.09.008.
10. Chen, Q., Lv, X., Zhang, S., Lin, J., Song, J., Cao, B., . . . Huang, R. (2020). Altered properties of brain white matter structural networks in patients with nasopharyngeal carcinoma after radiotherapy. Brain Imaging Behav, 14(6), 2745-2761. doi:10.1007/s11682-019-00224-2.
11. Lv, X., He, H., Yang, Y., Han, L., Guo, Z., Chen, H., . . . Xie, C. (2019). Radiation-induced hippocampal atrophy in patients with nasopharyngeal carcinoma early after radiotherapy: a longitudinal MR-based hippocampal subfield analysis. Brain Imaging Behav, 13(4), 1160-1171. doi:10.1007/s11682-018-9931-z.
12. Mao, Y. P., Zhou, G. Q., Liu, L. Z., Guo, R., Sun, Y., Li, L., . . . Ma, J. (2014). Comparison of radiological and clinical features of temporal lobe necrosis in nasopharyngeal carcinoma patients treated with 2D radiotherapy or intensity-modulated radiotherapy. Br J Cancer, 110(11), 2633-2639. doi:10.1038/bjc.2014.243.
Figures