2967
White matter microstructure alterations using Generalized Q-Sampling Imaging in Moderate and Severe Obstructive Sleep Apnea1Department of Radiology, The First Affiliated Hospital of Guangzhou Medical University, Guangzhou, China, 2The Affiliated Brain Hospital of Guangzhou Medical University (Guangzhou Huiai Hospital), Guangzhou, China, 3MR Collaboration, Siemens Healthineers Ltd., Guangzhou, China, 4MR Scientific Marketing, Siemens Healthineers, Guangzhou, China
Synopsis
In the current study, we assessed possible alterations of brain white matter (WM) microstructure in patients with obstructive sleep apnea (OSA) using generalized q-sampling imaging (GQI). We found higher normalized quantitative anisotropy values of the bilateral superior longitudinal fasciculus, uncinate fasciculus, fornix, and corpus callosum bundle in the OSA group vs controls, which were related to multiple clinical indices of OSA.
Introduction:
Neurological and psychiatric symptoms related to Obstructive Sleep Apnea (OSA) may be explained by subtle structural changes in specific neuronal circuit [1]. Widespread WM structural alterations have been observed in OSA patients in recent studies with conventional diffusion-based methods, such as diffusion tensor imaging (DTI). However, DTI was unable to fully interpret the branching or crossing fibers[2], and hard to completely show the fibers in regions of edema[3]. As a more sophisticated and novel protocol, indices of generalized q-sampling imaging (GQI)[2] might be sensitive enough to evaluate the impact of OSA on WM. Herein, the aim of this study was to investigate the feasibility and clinical applicability of GQI for quantitative detection of WM microstructural integrity in patients with OSA.METHODS:
A total of 34 treatment-naive patients (32 males and 2 females, mean age 40.36±10.80years) with OSA and 30 healthy controls (26 males and 4 females, mean age 36.45±12.75years), matched in gender and age, underwent full-night polysomnography, and MRI examinations on a 3T MR scanner (MAGNETOM Skyra, Siemens Healthcare, Erlangen, Germany) using a 20-channel head coil. The diffusion images were acquired using a 2D echo planar imaging (EPI) diffusion sequence with imaging parameters: TE=101 ms, TR=2000 ms, in-plane resolution = 1.8×1.8mm2, slice thickness = 5.2 mm. A half q-space Cartesian grid sampling procedure with a radial grid size of 4, as well as 20 b-values (150, 250, 350, 400, 500, 600, 650, 750, 1000, 1100, 1150, 1250, 1350, 1400, 1500, 1600, 1650, 1750, 1950 and 2000 s/mm2) with a total of 128 diffusion directions was used to obtain diffusion-weighted (DW) data. The restricted diffusion was quantified using restricted diffusion imaging[4]. The diffusion data were reconstructed using GQI model with a diffusion sampling length ratio of 1.25, and the following indices were calculated: generalized fractional anisotropy (GFA), normalized quantitative anisotropy (NQA), and the isotropic value (ISO) of the orientation distribution function.For each subject, the bilateral superior longitudinal fasciculus (SLF), uncinate fasciculus (UF), fornix (FORX), Cingulum bundle (CB), and corpus callosum bundle (CCB) were reconstructed by GQI tractography (Figure 1). The GQI indices were measured to determine differences between patients with OSA and healthy controls. Correlations among GQI indices and multiple clinical indices were investigated using Pearson correlation analysis. Receiver operating characteristic (ROC) curves were used to evaluate the diagnostic performance of OSA using GQI indices.
RESULTS:
NQA values were significantly increased in the bilateral SLF (p= 5.3×10⁻⁴ for the left, p=0.0019 for the right), bilateral UF (p= 2.8×10⁻⁴ for the left, p=0.012 for the right), bilateral FORX (p= 0.0021 for the left, p=0.011 for the right), and CCB (p=0.002) in patients with OSA compared to healthy controls (Figure 2,3). However, there was no significant difference in either GFA or ISO values. The highest diagnostic performance for OSA was observed in NQA value of the right hippocampus with area under the curve (AUC) of 0.762 (p =0.0067) (Figure 4). Meanwhile, the NQA value of the bilateral SLF, UF, FORX, and CCB were positively associated with apnea-hypopnea index (AHI) (all p< 0.05), arousal index (AI) (all p< 0.05), and time percentage of 90% oxygen saturation (T90%) (all p< 0.05), while the left SLF, UF, FORX, and CCB were negatively associated with the lowest pulse oxygen saturation (LSaO2) (all p< 0.05), as summarized in Figure 5.Discussion and Conclusions:
In this study, we assessed the possible alterations of brain WM microstructure in patients with OSA using GQI. To the best of our knowledge, GQI has not been utilized in patients with OSA. Here, we observed that NQA values in the OSA group were higher than healthy controls in the bilateral SLF, UF, FORX, and CCB, which related to WM compactness. These results indicated that WM fiber tracts might not be damaged, but rather the glia cells proliferate around them[5, 6]. The GQI tractography method is capable of evaluating microstructural integrity of the WM bundle in patients with OSA and is related to multiple clinical indices; therefore, it might be a potential biomarker to further understand the pathophysiological mechanisms of moderate to severe OSA.Acknowledgements
No acknowledgement found.References
[1] Baril A A, Martineau-Dussault M E, Sanchez E, et al. Obstructive Sleep Apnea and the Brain: a Focus on Gray and White Matter Structure [J]. Curr Neurol Neurosci Rep, 2021, 21(3): 11.
[2] Yeh F C, Wedeen V J, Tseng W Y. Generalized q-sampling imaging [J]. IEEE Trans Med Imaging, 2010, 29(9): 1626-1635.
[3] Provenzale J M, McGraw P, Mhatre P, et al. Peritumoral brain regions in gliomas and meningiomas: investigation with isotropic diffusion-weighted MR imaging and diffusion-tensor MR imaging [J]. Radiology, 2004, 232(2): 451-460.
[4] Yeh F C, Liu L, Hitchens T K, et al. Mapping immune cell infiltration using restricted diffusion MRI [J]. Magn Reson Med, 2017, 77(2): 603-612.
[5] Chen H L, Lu C H, Lin H C, et al. White matter damage and systemic inflammation in obstructive sleep apnea [J]. Sleep, 2015, 38(3): 361-370.
[6] Zhao Y S, Tan M, Song J X, et al. Involvement of Hepcidin in Cognitive Damage Induced by Chronic Intermittent Hypoxia in Mice [J]. Oxidative medicine and cellular longevity, 2021, 2021(8520967.
Figures
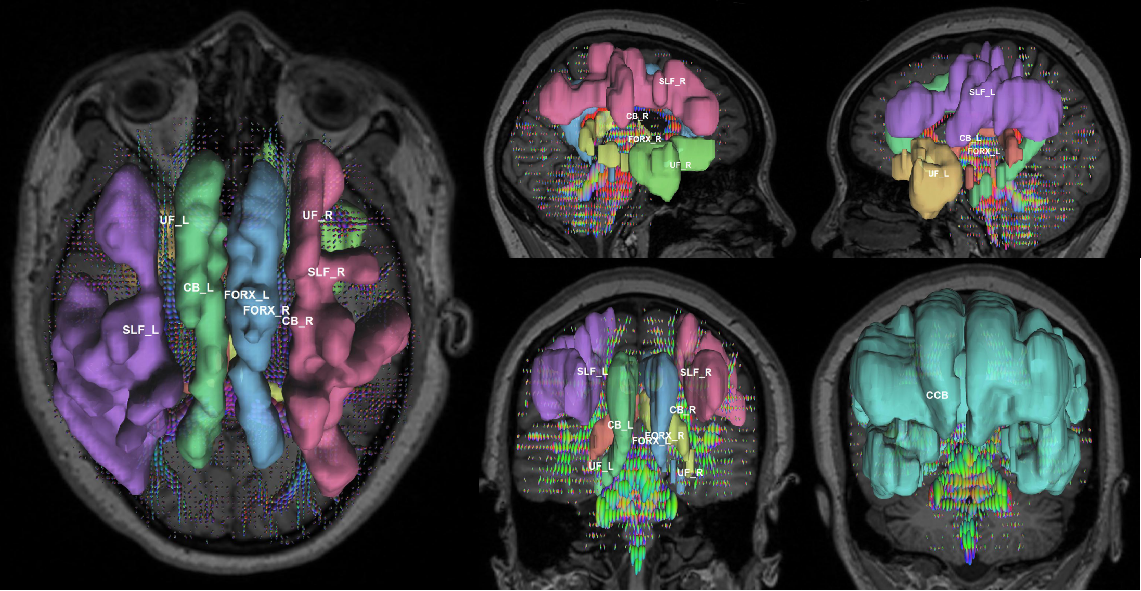
Figure 1. Diffusion spectrum MRI tractography: Regions of interest were bilateral superior longitudinal fasciculus (SLF), uncinate fasciculus (UF), fornix (FORX), Cingulum bundle (CB), and corpus callosum bundle (CCB).
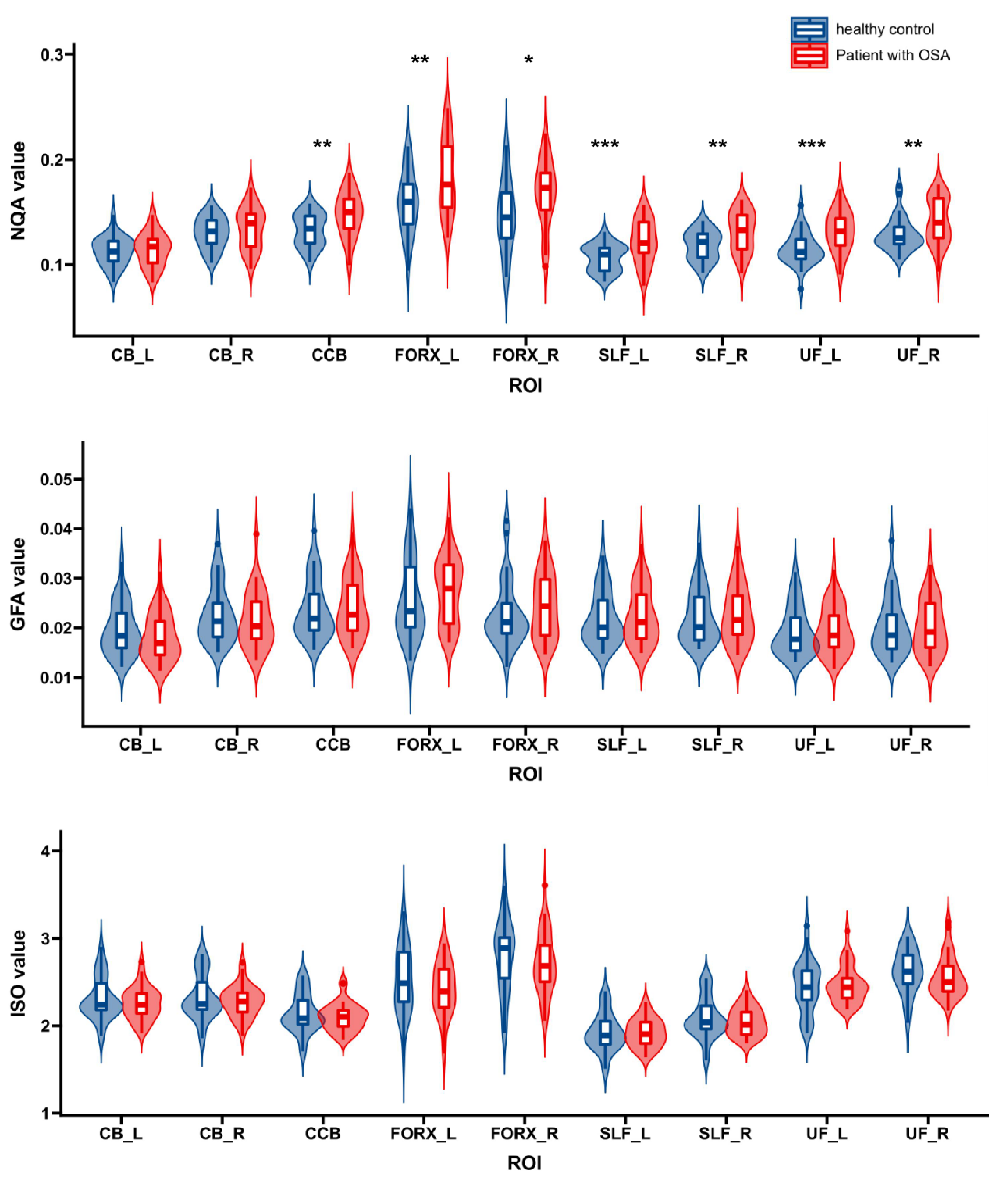
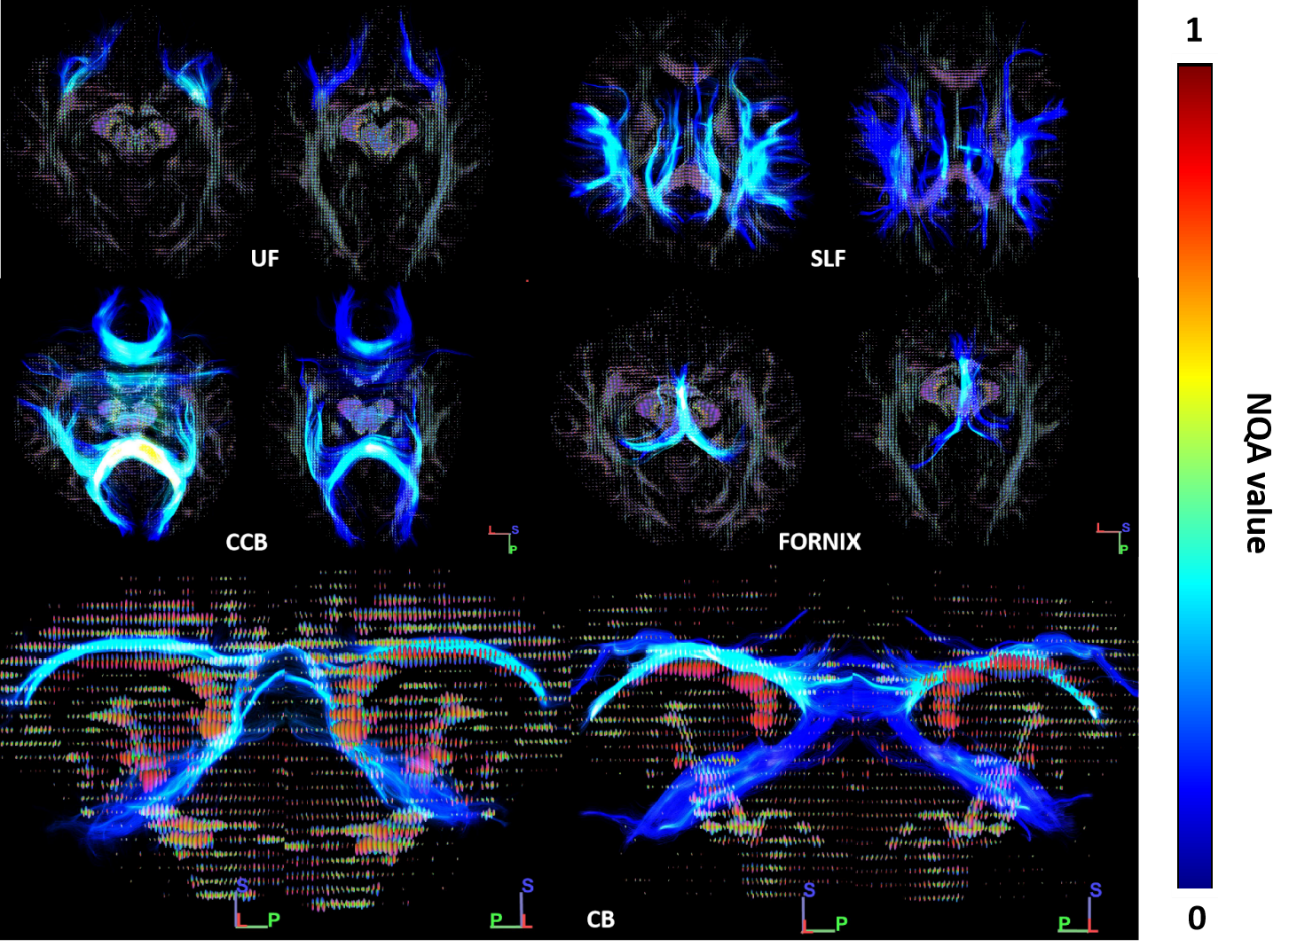
Figure 3. Representative NQA values of two individuals with same age, a HC subject (right) and a OSA patient (left). Note NQA values increased in the bilateral SLF, UF, FORX and CCB of the patient. OSA, obstructive sleep apnea; HC, healthy control.
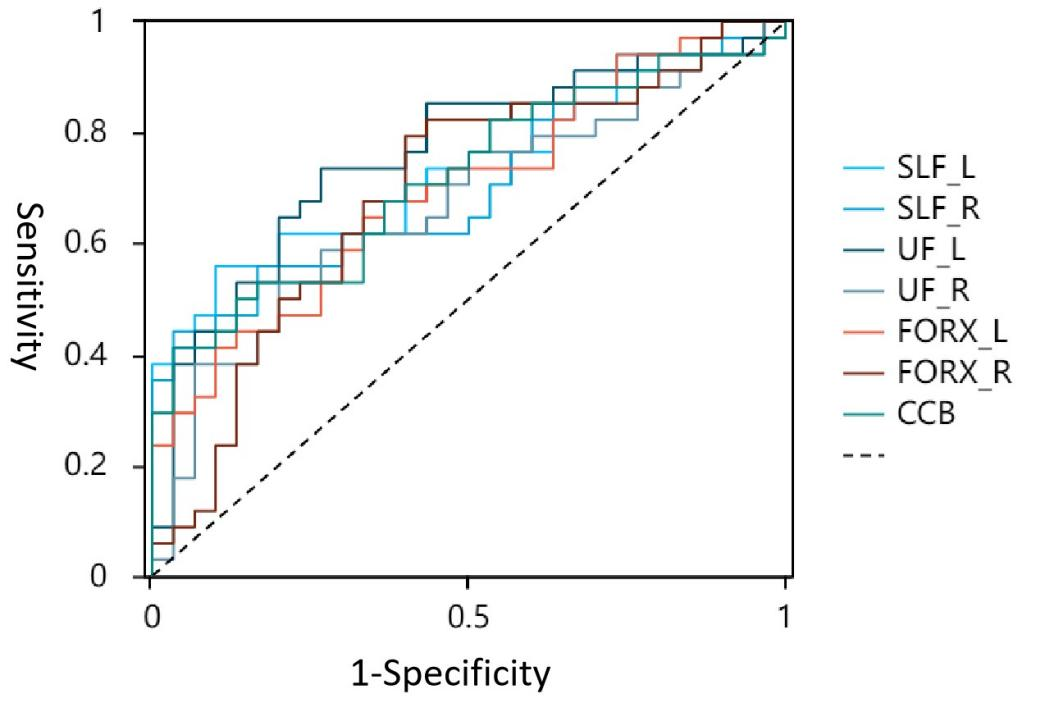
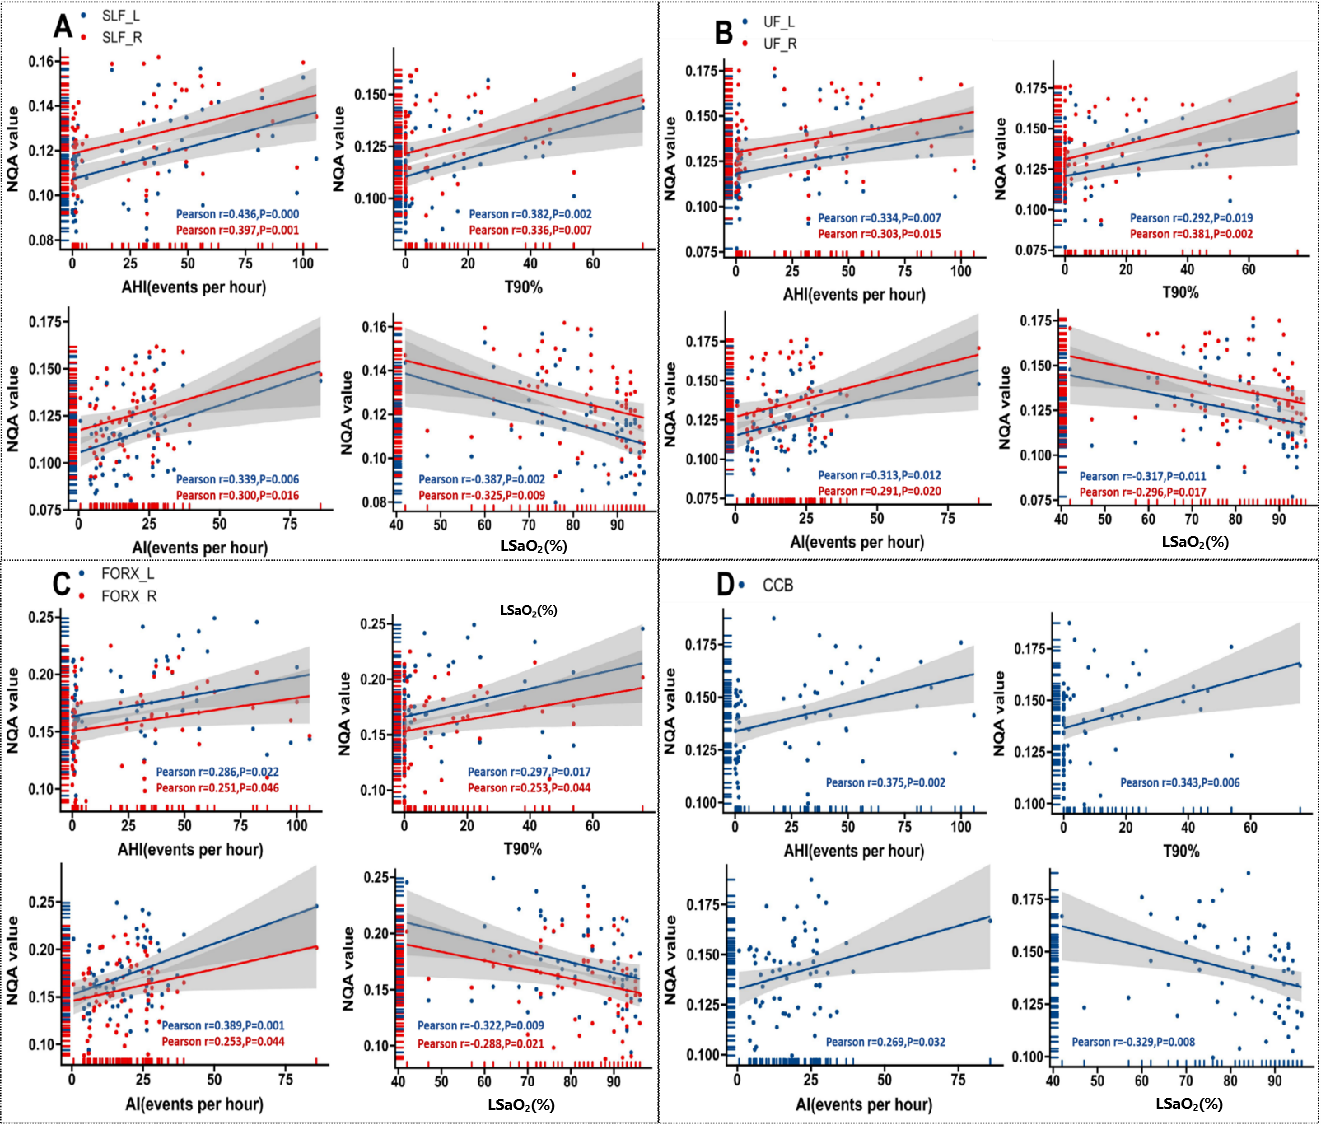
Figure 5. Scatter plot illustrating relationship between NQA values and clinical indices (AHI, AI, T90%, and LSaO2) in: (A) bilateral SLF, (B) bilateral UF, (C) bilateral FORX, and (D) CCB. AHI, apnea-hypopnea index; AI, arousal index; CCB, corpus callosum bundle; FORX, fornix; LSaO2, lowest pulse oxygen saturation; NQA, normalized quantitative anisotropy; SLF, superior longitudinal fasciculus; T90%, time percentage of 90% oxygen saturation; UF, uncinate fasciculus.