2966
Fixel-Based Analysis of White Matter Degeneration in Patients with Progressive Supranuclear Palsy and Corticobasal Syndrome1Department of Radiology, Juntendo University Graduate School of Medicine, Tokyo, Japan, 2Department of Radiology, The University of Tokyo, Tokyo, Japan, 3Department of Radiology, Toho University Omori Medical Center, Tokyo, Japan
Synopsis
Progressive supranuclear palsy (PSP) and corticobasal syndrome (CBS) are neurodegenerative disorders associated with corticobasal degeneration pathology. A previous study evaluated white matter (WM) alteration using diffusion tensor imaging; however, the details are unclear due to the crossing fiber. This study evaluated cross-sectional and longitudinal WM changes in PSP and CBS using fixel-based analysis. This study also demonstrated consistent cross-sectional and longitudinal WM degeneration with previous histopathological studies and higher sensitivity than classical magnetic resonance imaging findings in differentiating PSP and CBS. Our results suggest that FBA can be a biomarker to classify PSP and CBS and estimate disease progression.
INTRODUCTION
Progressive supranuclear palsy (PSP) and corticobasal degeneration (CBD, frequently presenting with corticobasal syndrome [CBS]) are characterized by 4R-tau pathology1, 2. Due to overlapping clinical information, pathology, and genetic risk factors, disease assessment is often difficult3. Recently, the white matter (WM) structure has been evaluated using diffusion tensor imaging4-6 and voxel-based morphometry (VBM)6; however, accurate assessment of regions containing crossing fibers was challenging because the voxel-wise metrices are unreliable to resolve multiple fiber orientations in regions of crossing (up to 90% in the brain7). Fixel-based analysis (FBA), a recently developed framework, can be used to solve the problems because it provides WM micro- and macrostructural metrics in specific fiber-bundle populations within a voxel (i.e., fixel)8. This study evaluated WM alterations in PSP and CBS over 1-year using FBA to verify the hypothesis that FBA can detect the fiber-specific WM alterations consistent with PSP and CBS pathophysiology and FBA metrices can be disease progression biomarkers in these patients.METHODS
Data acquisitionMagnetic resonance imaging (MRI) data and clinical information of 17 participants with CBS and 20 participants with PSP were acquired from Four-Repeat Tauopathy Neuroimaging Initiative at baseline and 1-year follow-up, and 20 healthy controls (HCs) were obtained from the Neuroimaging Initiative for Frontotemporal Lobar Degeneration (Table 1). The diffusion-weighted images (DWIs) were obtained using the 3-T MRI scanner with the following parameters: echo-planar imaging, TR/TE, 9200/82 ms; matrix, 128×128 (2.7×2.7 mm); thickness, 2.7 mm; b-values, 0 and 2000 s/mm2; and diffusion encoding directions, 41.
Fixel-based analysis
The following FBA pipeline was performed using MRtrix3Tissue9. The denoising10 and correction for Gibbs artifacts11 and eddy current- and motion-induced distortion12 were performed for DWIs. Then, fiber orientation distributions13 were estimated using single-shell three-tissue constrained spherical deconvolution. The fiber density (FD), log-transformed fiber cross-section (Log-FC), a product of FD and FC (FDC) were calculated on a group-specific template.
Statistical analysis
Longitudinal and cross-sectional FBA were performed using the connectivity-based fixel enhancement14. Then, family-wise error (FWE)-corrected P-values were assigned to each fixel using nonparametric permutation testing over 10,000 permutations. VBM was performed to assess the WM atrophy. A FWE-corrected P-value < 0.05 was considered significant. Receiver operating characteristic curve analysis was also performed based on the averaged FBA metrices that significantly differed from PSP and CBS. A neuroradiologist (K.K.) made a diagnosis of PSP and CBS based on the classical MRI findings (i.e., hummingbird sign for PSP and asymmetric precentral atrophy for CBS). Then, the sensitivity and specificity were calculated. Spearman’s correlation coefficients were then calculated to examine the association between the changes over 1-year of FBA metrices on fixels significantly changed in longitudinal FBA and clinical scores PSPRS and MMSE.
RESULTS
Group comparison at baselineOn comparing PSP and CBS at baseline, Log-FC and FDC showed a significant loss in PSP along the dentate-rubro-thalamic tract (DRTT), including superior cerebellar peduncle (SCP), crossing the midline (Figure 1). When using DRTT, the areas under the ROC curve were 0.85 (specificity, 88%; sensitivity, 80%) in FDC and 0.87 (specificity, 82%; sensitivity, 75%) in Log-FC. However, in classical MRI features, the results were following: Specificity 70%; Sensitivity 65% in hummingbirds sign and Specificity 85%; Sensitivity 70% in asymmetric precentral atrophy. Significantly decreased FBA metrices in PSP were revealed in the SCP, midbrain, pons, corticospinal tract (CST), superior longitudinal fasciculus (SLF), and body of the corpus callosum (CC) compared with the HC (Figure 2). There was also significantly decreased FD, Log-FC, and FDC in the CST, SLF, and CC in CBS compared with HC.
Longitudinal analysis in 1 year
On comparing baseline and 1-year results (Figure 3), the CBS showed significantly decreased Log-FC, FD, and FDC in WM, including CST, SLF, and body of CC. However, PSP revealed significantly low FBA metrices in the SCP, CST, SLF, and body and splenium of CC. In CBS, the alteration of FBA metrices were significantly correlated with the changes of PSPRS and MMSE over 1-year (Table 2).
DISCUSSION
Our study demonstrated consistent WM degeneration with previous findings15, 16 and higher sensitivity than VBM and diagnosis with classical MRI findings. The decreased FD, Log-FC, and FDC might suggest selective neurodegeneration related to the hyperphosphorylated tau deposition (i.e., axonal loss and demyelination)4, 17. However, on comparing PSP and CBS, decreased Log-FC and FDC representing WM atrophy were detected specifically in PSP. Interestingly, the significant fixels were along the DRTT and represented the fibers across the midline, coursing toward the ventrolateral nucleus of the thalamus. Atrophy of the DRTT in PSP is consistent with the histopathological reports of high vulnerability of this region to tau accumulation18. Furthermore, the degeneration along the DRTT is considered characteristic of PSP pathology19. This novel finding might suggest FBA’s superiority in delineating crossing fibers and high sensitivity to classify PSP and CBS.Our longitudinal analysis indicated the progressive WM degeneration in the fixels corresponding to tau accumulation as revealed in the histopathological studies of each disease20, 21 The correlation between the changes of FBA metrices and progression of cognitive and motor dysfunction in CBS might suggest FBA can predict the disease progression in CBS.
CONCLUSION
Our results suggest that FBA can be a biomarker to specifically classify PSP and CBS and estimate disease progression.Acknowledgements
This study was partially supported by the Private University Research Branding Project (Ministry of Education, Culture, Sports, Science and Technology, Japan) and JSPS KAKENHI (grant JP19K17244, JP18H02772).References
1. Boeve BF. Parkinson-related dementias. Neurol Clin 2007;25:761-781, vii.
2. Litvan I, Hauw JJ, Bartko JJ, et al. Validity and reliability of the preliminary NINDS neuropathologic criteria for progressive supranuclear palsy and related disorders. J Neuropathol Exp Neurol 1996;55:97-105.
3. Ling H, Macerollo A. Is it Useful to Classify PSP and CBD as Different Disorders? Yes. Mov Disord Clin Pract 2018;5:145-148.
4. Upadhyay N, Suppa A, Piattella MC, et al. MRI gray and white matter measures in progressive supranuclear palsy and corticobasal syndrome. J Neurol 2016;263:2022-2031.
5. Whitwell JL, Schwarz CG, Reid RI, Kantarci K, Jack CR, Jr., Josephs KA. Diffusion tensor imaging comparison of progressive supranuclear palsy and corticobasal syndromes. Parkinsonism Relat Disord 2014;20:493-498.
6. Zhang Y, Walter R, Ng P, et al. Progression of Microstructural Degeneration in Progressive Supranuclear Palsy and Corticobasal Syndrome: A Longitudinal Diffusion Tensor Imaging Study. PLoS One 2016;11:e0157218.
7. Jeurissen B, Leemans A, Tournier JD, Jones DK, Sijbers J. Investigating the prevalence of complex fiber configurations in white matter tissue with diffusion magnetic resonance imaging. Hum Brain Mapp 2013;34:2747-2766.
8. Raffelt DA, Tournier JD, Smith RE, et al. Investigating white matter fibre density and morphology using fixel-based analysis. Neuroimage 2017;144:58-73.
9. Tournier JD, Smith R, Raffelt D, et al. MRtrix3: A fast, flexible and open software framework for medical image processing and visualisation. Neuroimage 2019;202:116137.
10. Veraart J, Fieremans E, Novikov DS. Diffusion MRI noise mapping using random matrix theory. Magn Reson Med 2016;76:1582-1593.
11. Kellner E, Dhital B, Kiselev VG, Reisert M. Gibbs-ringing artifact removal based on local subvoxel-shifts. Magn Reson Med 2016;76:1574-1581.
12. Andersson JLR, Sotiropoulos SN. An integrated approach to correction for off-resonance effects and subject movement in diffusion MR imaging. Neuroimage 2016;125:1063-1078.
13. Dhollander T, Mito, M., Raffelt, D. & Connelly, A. Improved white matter response function estimation for 3-tissue constrained spherical deconvolution. 27th Int Soc Magn Reson Med 2019.
14. Raffelt DA, Smith RE, Ridgway GR, et al. Connectivity-based fixel enhancement: Whole-brain statistical analysis of diffusion MRI measures in the presence of crossing fibres. Neuroimage 2015;117:40-55.
15. Boelmans K, Bodammer NC, Suchorska B, et al. Diffusion tensor imaging of the corpus callosum differentiates corticobasal syndrome from Parkinson's disease. Parkinsonism Relat Disord 2010;16:498-502.
16. Po-Yuan Chen Y-MW, Yi-Hsin Weng, and Jiun-Jie Wang. Fibre-specific white matter degeneration in the patients with Progressive supranuclear palsy. ISMRM2020 2020.
17. Stamelou M, Respondek G, Giagkou N, Whitwell JL, Kovacs GG, Höglinger GU. Evolving concepts in progressive supranuclear palsy and other 4-repeat tauopathies. Nat Rev Neurol 2021;17:601-620.
18. Dickson DW. Neuropathology of progressive supranuclear palsy. Handb Clin Neurol 2008;89:487-491.
19. Tsuboi Y, Slowinski J, Josephs KA, Honer WG, Wszolek ZK, Dickson DW. Atrophy of superior cerebellar peduncle in progressive supranuclear palsy. Neurology 2003;60:1766-1769.
20. Kovacs GG, Lukic MJ, Irwin DJ, et al. Distribution patterns of tau pathology in progressive supranuclear palsy. Acta Neuropathologica 2020;140:99-119.
21. Sakai K, Piao YS, Kikugawa K, et al. Corticobasal degeneration with focal, massive tau accumulation in the subcortical white matter astrocytes. Acta Neuropathol 2006;112:341-348.
Figures
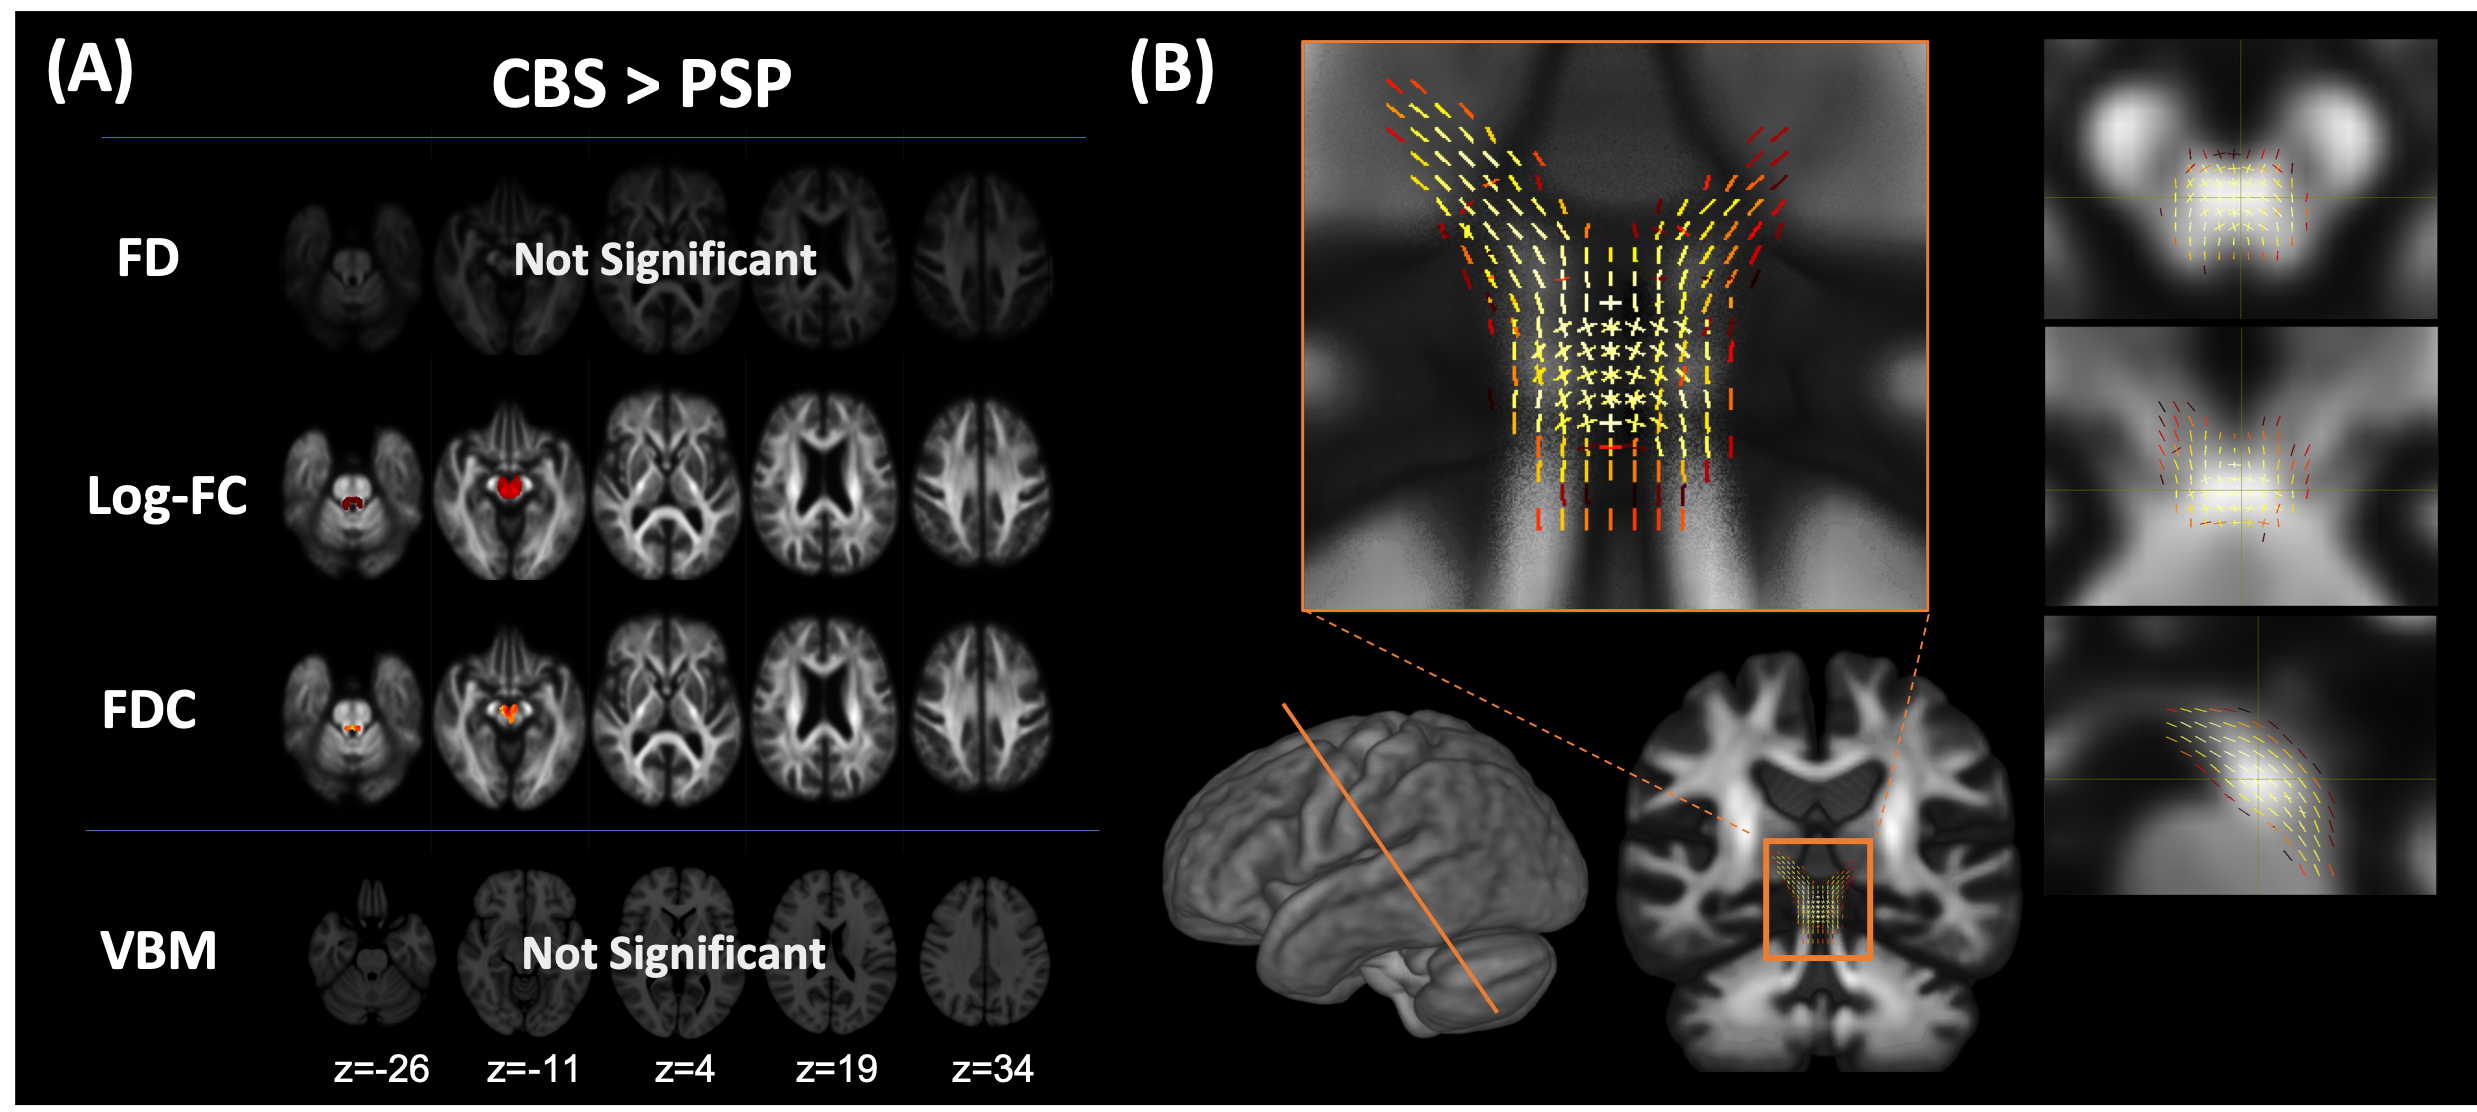
Figure 1. Comparison of fixel-based analysis between PSP and CBS at baseline
(A) PSP showed significantly decreased Log-FC and FDC in the SCP and midbrain. No significant changes were observed in CBS compared with PSP. VBM showed no significant changes in any comparisons. (B) The fixels with significantly decreased Log-FC in PSP were detected along the dentate-rubro-thalamic tract.
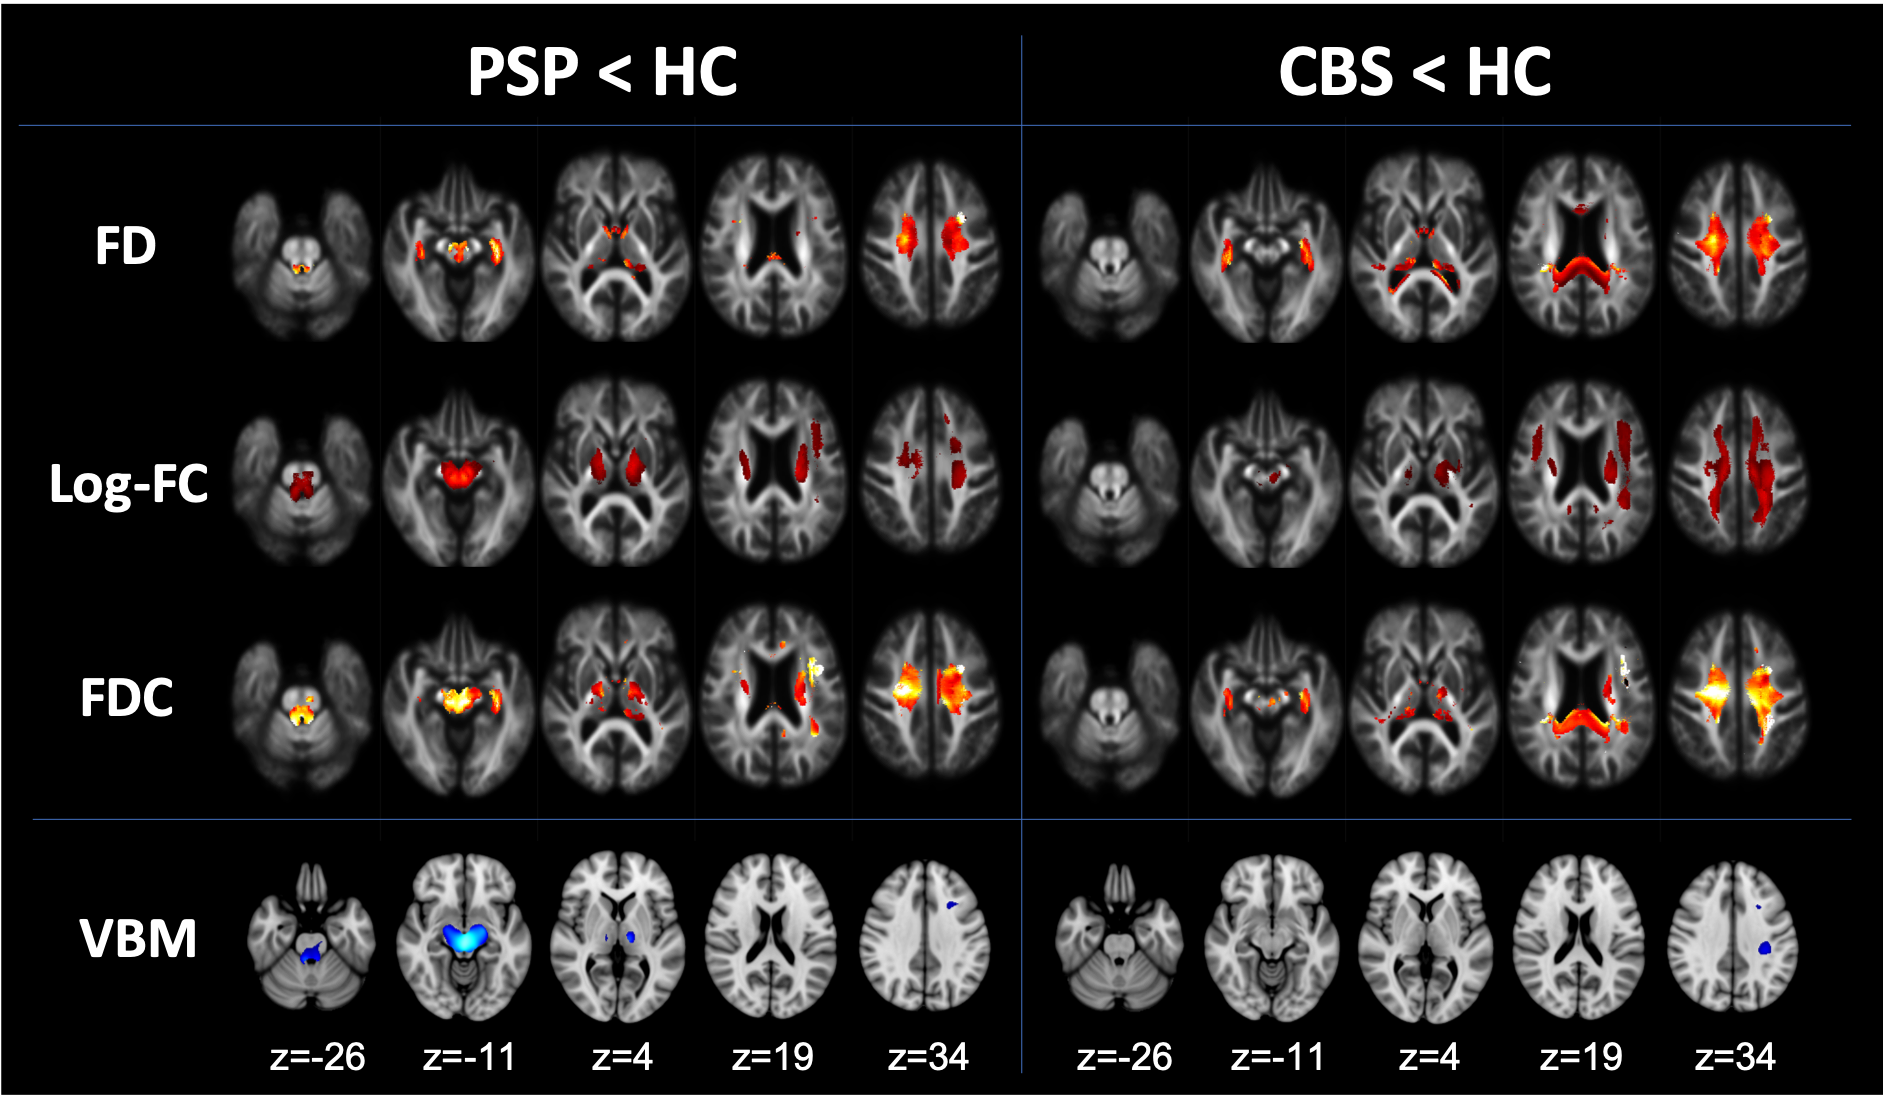
Figure 2. Comparison of fixel-based analysis between HC and diseases at baseline
Compared with HC, PSP showed decreased FD, Log-FC, and FDC in the SCP, midbrain, pons, internal capsule, superior longitudinal fasciculus, body of the corpus callosum, and cingulum. CBS showed decreased FD, Log-FC, and FDC in the corticospinal tract, superior longitudinal fasciculus, genu, body, and splenium of corpus callosum. VBM showed decreased white matter volume in SCP and midbrain in PSP compared with HC. CBS showed decreased white matter volume in the superior longitudinal fasciculus.
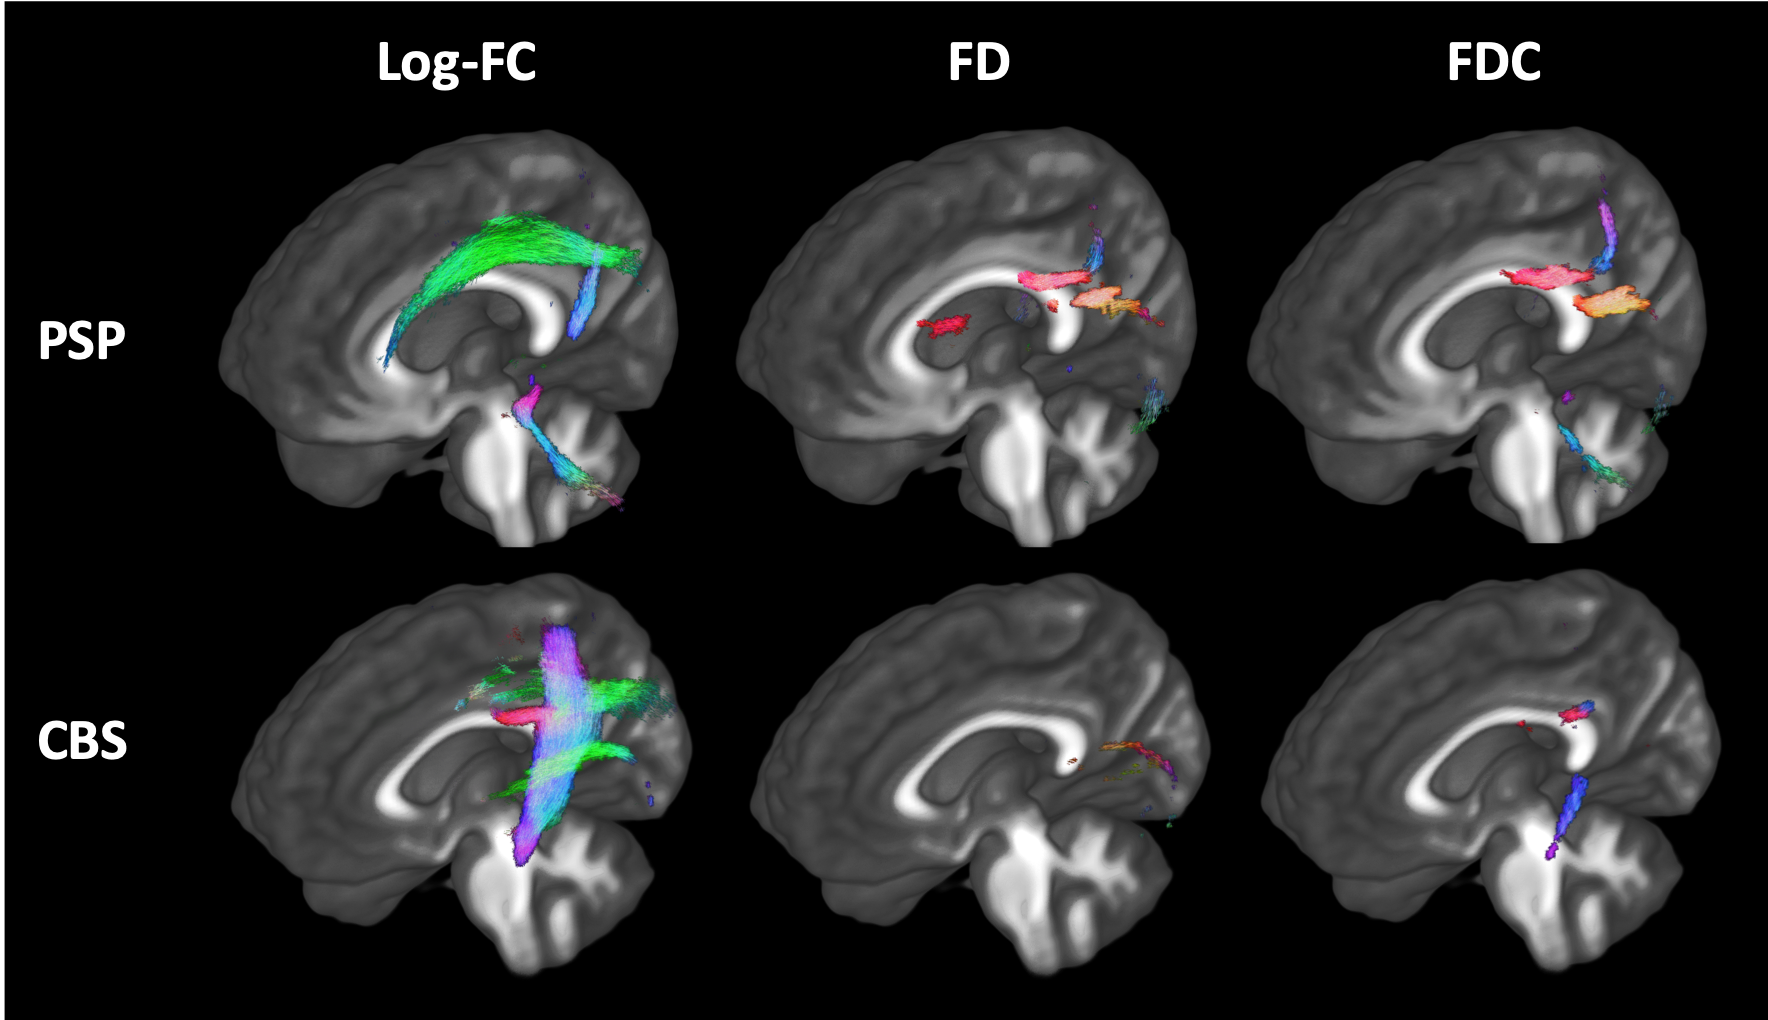
Figure 3. Longitudinal changes of fixel-based metrices in PSP and CBS in 1 year
Streamlines cropped from template tractogram passing significant fixels are shown (colored by direction red, left–right; green, anterior–posterior; blue, inferior–superior). PSP showed significantly decreased Log-FC in the SCP, CST, and SLF and FD, and FDC in the body and splenium of the corpus callosum. CBS showed significantly decreased Log-FC in CST, SLF, and body of the corpus callosum and FD and FDC in the splenium of the corpus callosum.
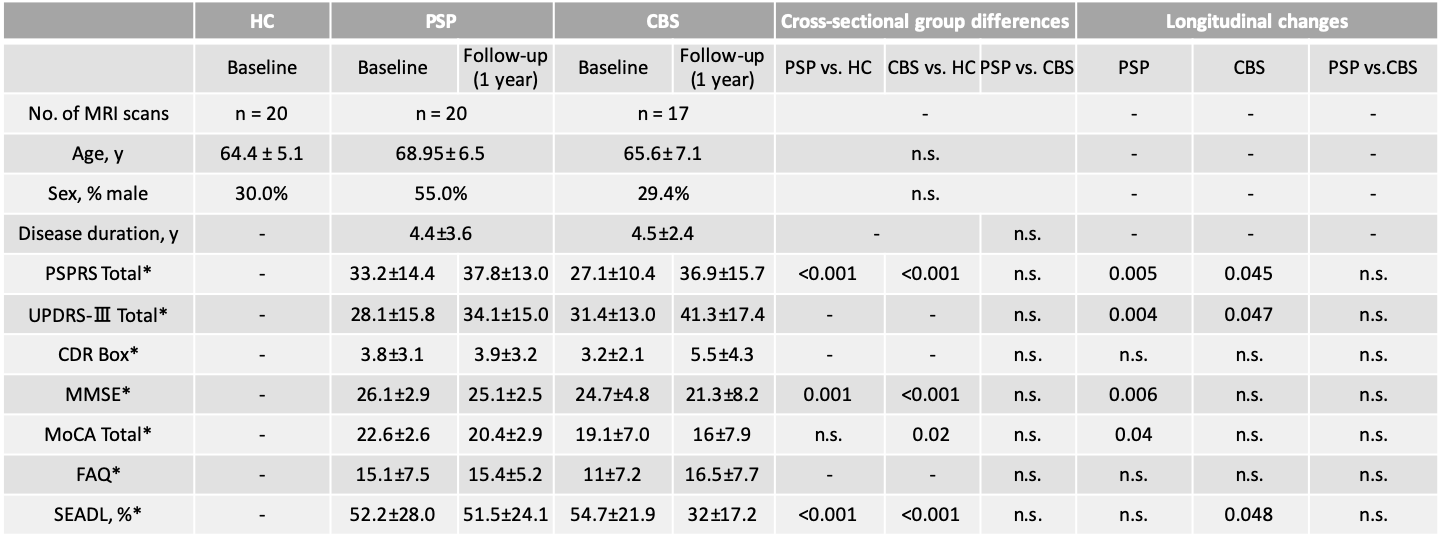
*Subject numbers of missing information: PSPRS_BL Total in 2 PSP and 1 CBS; CDR Box_BL in 16 HC; MMSE_BL in 2 CBS; MoCA_BL Total in 1HC, 5 PSP and 1 CBS; FAQ_BL in 20 HC and 3 PSP; SEADL_BL in 2 HC, 2 PSP, and 2 CBS subjects were missing. PSPRS_12 mo total in 7 PSP and 6 CBS; UPDRS-Ⅲ_12 mo total in 6 PSP and 7 CBS; CDR Box_12 mo in 5 PSP and 5 CBS; MMSE_12 mo in 6 PSP and 7 CBS; MoCA_12 mo in 7 PSP and 6 CBS; FAQ_12 mo in 10 6 PSP and 5 CBS; SEADL_12 mo in 7 PSP and 7 CBS subjects were missing.
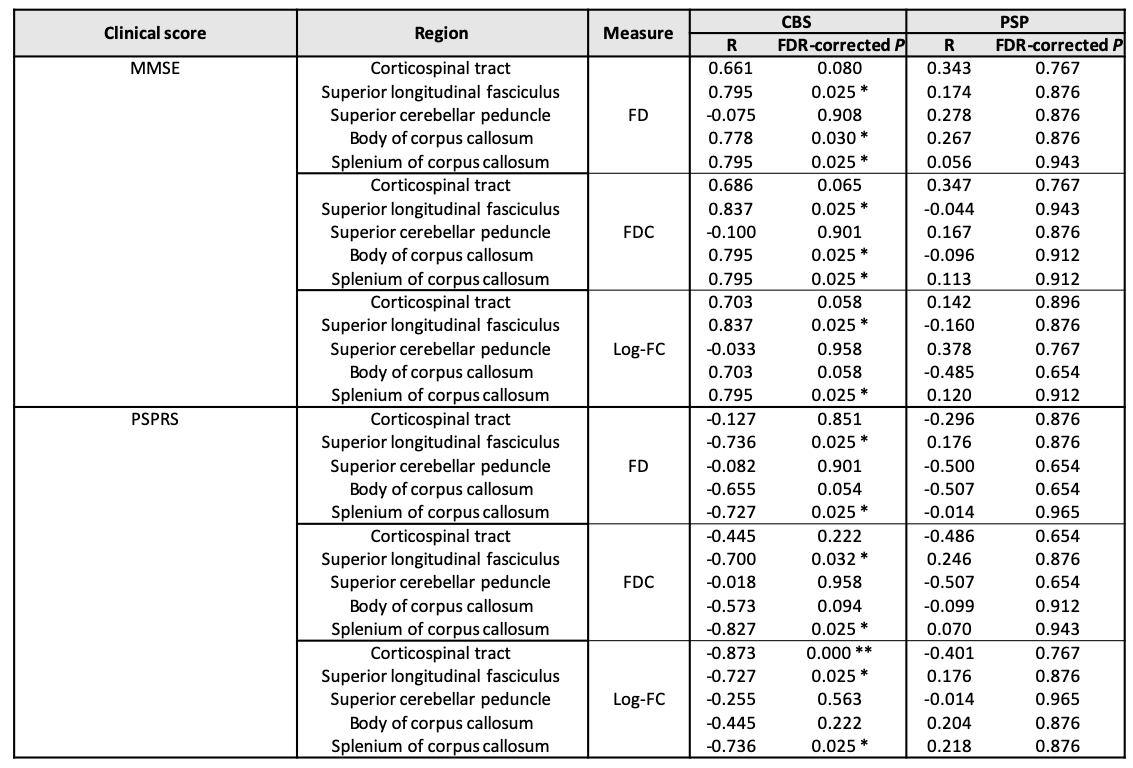
Table 2. Correlation analysis for the changes over 1-year of FBA measures and clinical scores
Spearman’s correlation coefficient (rs) and False Discovery Rate (FDR)-corrected P were showing associations between the alteration of FBA measures and the changes of clinical scores (i.e., MMSE and PSPRS) over 1-year in patients with PSP and CBS.