2965
WM integrity of right AF in predicting language recovery of chronic poststroke aphasia after LF-rTMS treatment1Department of Biomedical Imaging and Radiological Sciences, National Yang Ming Chiao Tung University, Taipei, Taiwan, Taipei, Taiwan, 2Department of Physical Medicine and Rehabilitation, Taipei Veterans General Hospital, Taipei, Taiwan, Taipei, Taiwan, 3School of Medicine, National Yang Ming Chiao Tung University, Taipei, Taiwan, Taipei, Taiwan
Synopsis
Low-frequency repetitive transcranial magnetic stimulation (LF-rTMS) provided promising results to facilitate the language recovery in stroke patients with non-fluent aphasia 1. The contralesional inhibitory LF-rTMS treatment can induce the functional reorganization within language networks and recovery of language function in chronic aphasic stroke 2, 3. This study evaluated the right microstructural integrity of the arcuate fasciculus before the intervention and its association with the language improvement after the LF-rTMS treatment.
Background and Purpose
Aphasia is often caused by either ischemic or hemorrhagic stroke when the brain language areas, such as the left inferior frontal gyrus (Broca’s area), left superior temporal gyrus (Wernicke’s area) and the basal ganglia, are damaged. Patients with nonfluent chronic aphasia suffer from difficulty in daily communication and hard to recovery to the normal condition. In addition to the speech therapy, several rTMS researches provided the evidences in functional neuroimaging to support the promising efficacy of rTMS. However, the association between the underlying microstructure of language circuits and language recovery after intervention was less explored 4. In this study, we hypothesized that the chronic aphasic patients with a higher degree of right white matter integrity of arcuate fasciculus after stroke may have a better response to neural modulation intervention resulting in a significant language improvement after the LF-rTMS treatment.Materials and Methods
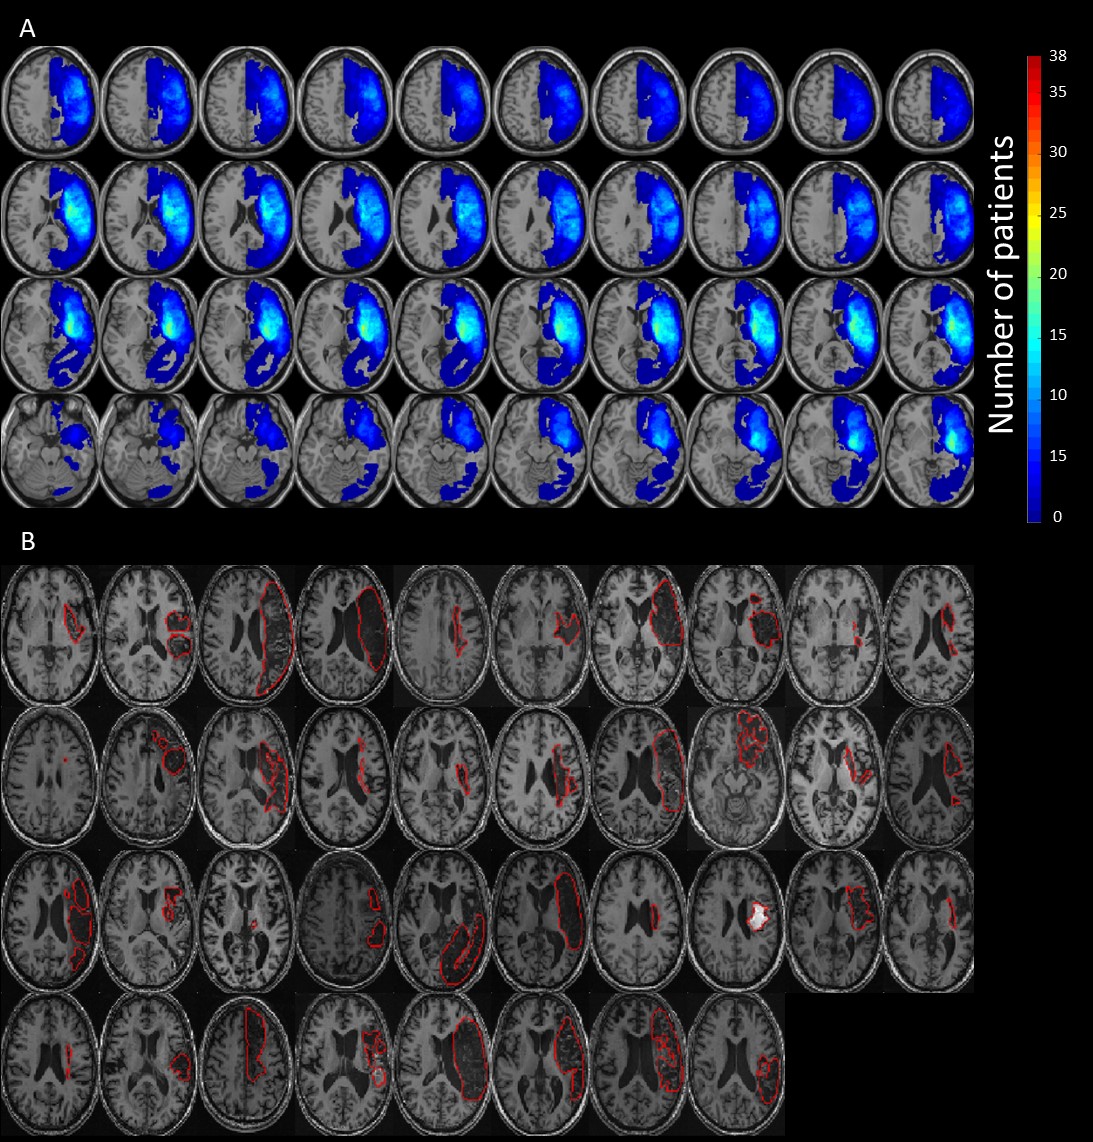
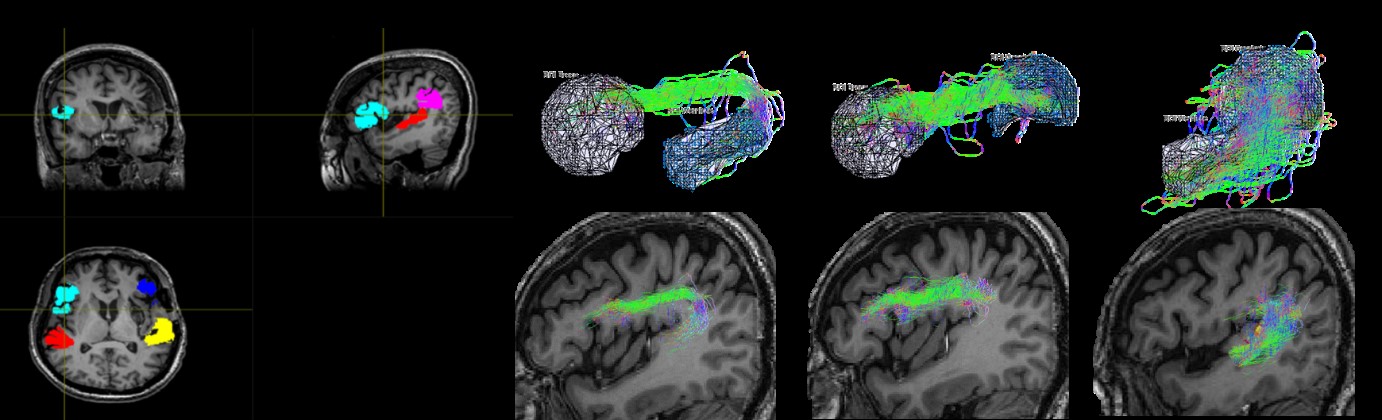
This study was approved by the local Institutional Review Board, and the written informed consent was provided by each participant. Thirty-eight patients with chronic stroke (at least 3 months after stroke) located in the left hemisphere and diagnosed as non-fluent aphasia were recruited. The enrolled patients were randomly assigned into one of the study groups, either treated with 1 Hz LF-rTMS on the contralesional pars triangularis (rTMS group) for 10 daily sessions or treated with sham stimulation (sham group). All the patients received additional language therapy twice a week. The Concise Chinese Aphasia Test (CCAT) with nine testing items, including simple response, expository speech, matching, auditory comprehension, naming, reading comprehension, repetition, copying, spontaneous writing, was used to assess the language functions 5. Three more composite scores, including the 4-expression (calculated as the sum score of simple response, expository speech, naming, and copying), 3-comprehension (calculated as the sum score of matching, auditory comprehension, and reading comprehension) and total score were also evaluated. MRI data including 3D-FSPGR T1-weighted images (TR/TE: 9.4/4.0 ms; voxel size: 1.0x1.0x1.0 mm3) and diffusion-tensor images (DTI, TR/TE: 10500/80 ms; voxel size: 1.0x1.0x2.0 mm3; b value: 1000 s/mm2; gradient directions: 60) were acquired on a 3T MRI scanner (GE Discovery MR750, 8-channel head coil) before the rTMS treatment. The co-registration between patients’ T1-weighted images and DTI was performed. The right arcuate fasciculus (contralesional side) was separated into three bi-directional segments, including the tracts between Broca’s and Wernicke's areas (BW and WB), Broca’s and Geschwind's areas (BG and GB), and Wernicke's and Geschwind's areas (WG and GW) (Figure 2). The probabilistic tractography was performed on the MRtrix3 software 6. Afterward, we further calculated the fractional anisotropy (FA), axial diffusivity (AD), radial diffusivity (RD), and apparent diffusion coefficient (ADC) of these three bi-directional pathways within the right arcuate fasciculus. The stepwise linear regression analysis between the right microstructural indices (FA, AD, RD, and ADC) of arcuate fasciculus and language improvement (chages of CCAT scores) was performed 7. The performance of linear regression models was evaluated by the goodness-of-fit (R-square, R2) and F statistic versus a constant model (with p < 0.05 as significance).Results and Discussion
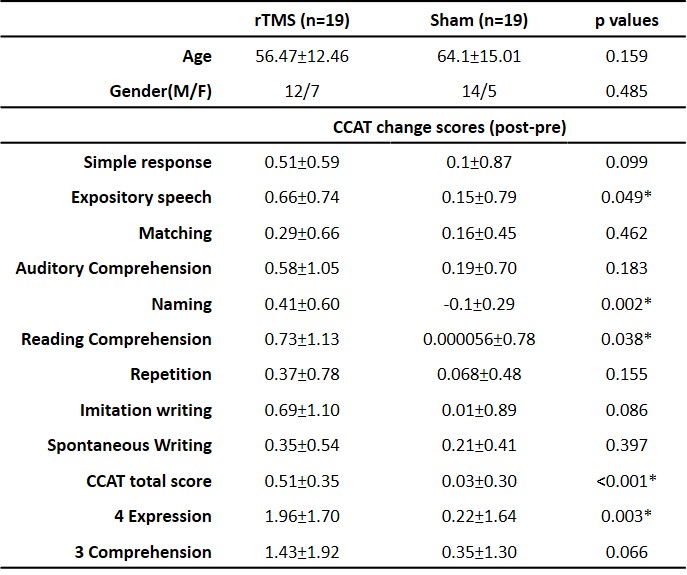
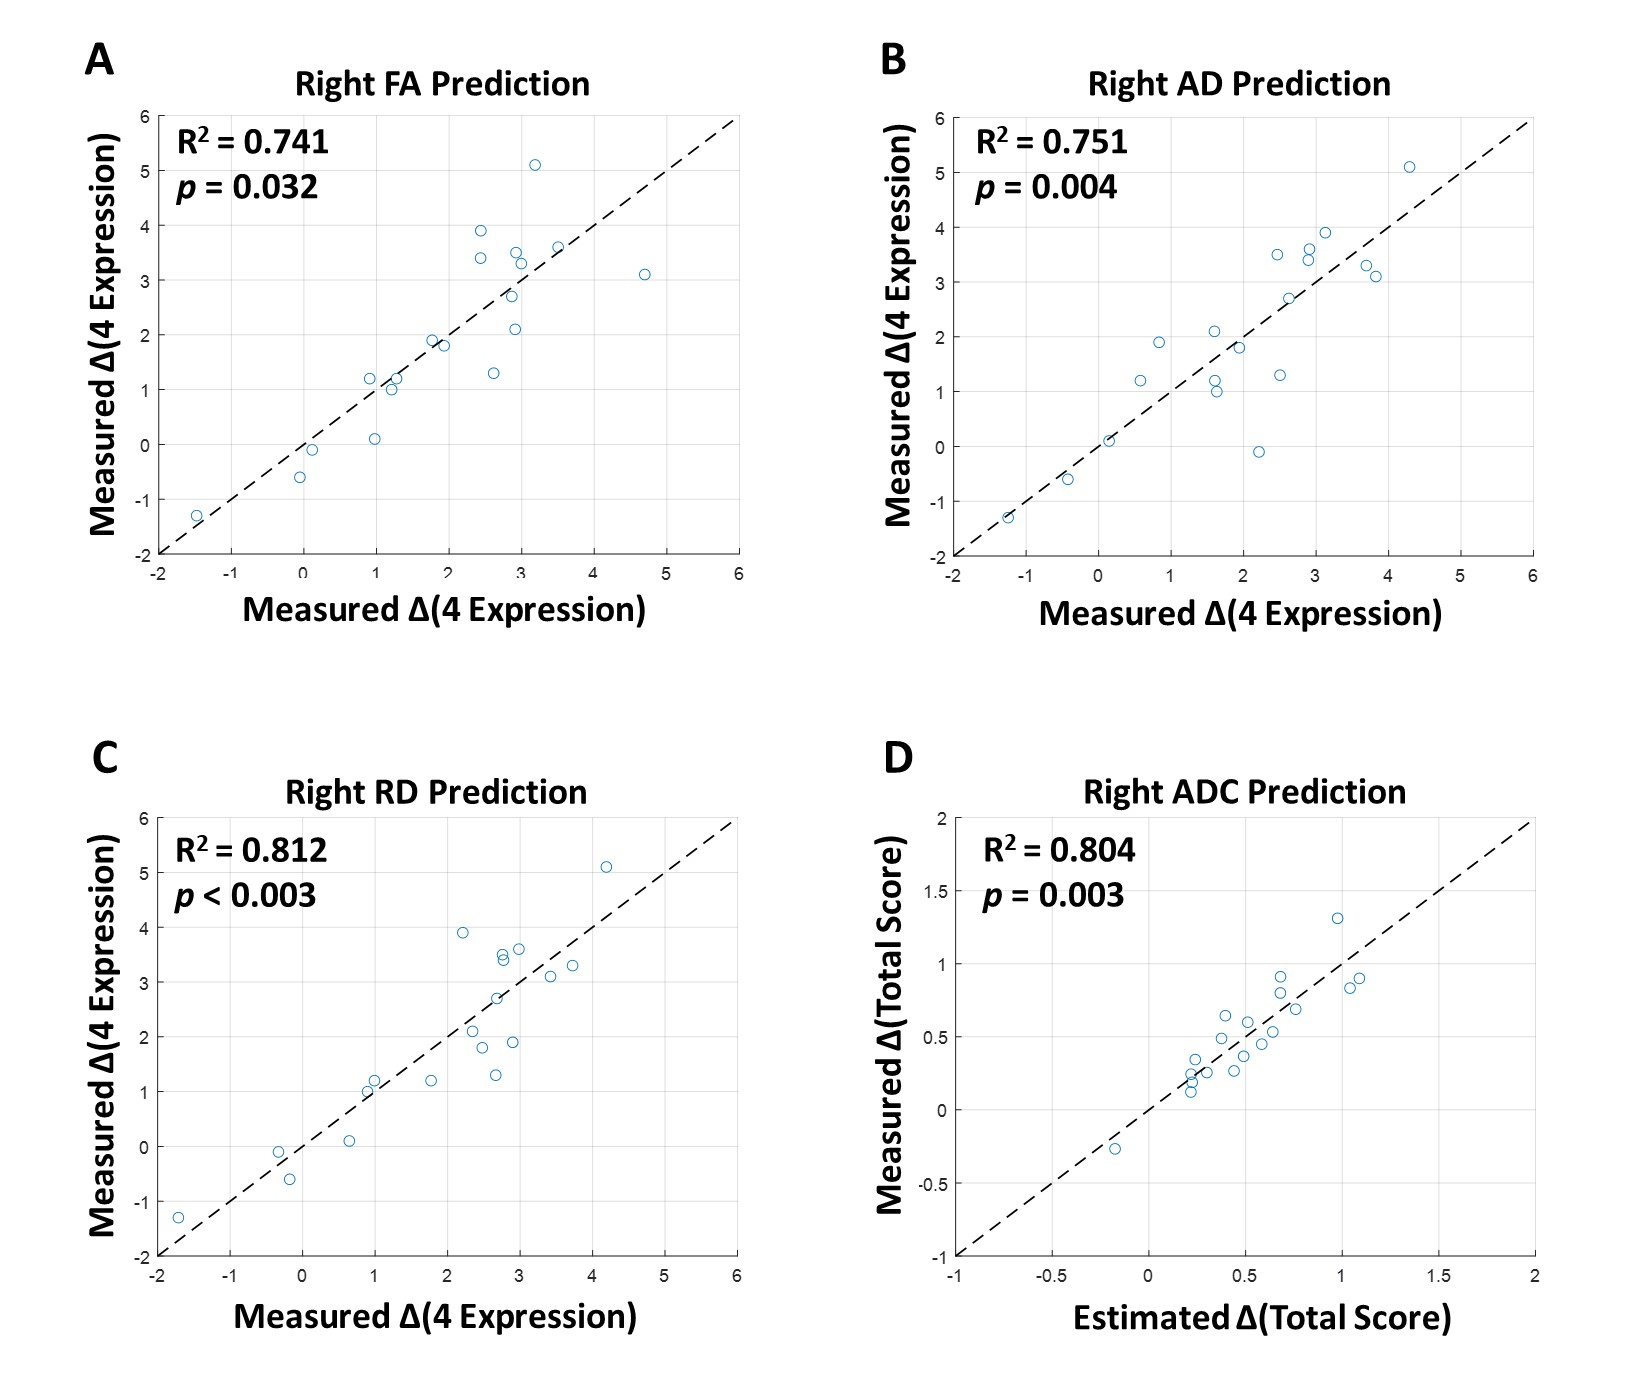
Table 1 lists the changes of language performance (each item of CCAT, total scores, 4-expression, and 3-comprehension) before and after LF-rTMS treatment. The recruited patients with rTMS treatment showed significant improvement (positive values of change score, p<0.05) of the total scores along with the items of expository speech, naming, reading comprehension, and 4-expression. Figure 3 showed that the 4-expression and total score, which exhibited significant improvement in rTMS group compared to the sham group (as listed in Table 2), could be predicted by the pre-treatment DTI indices of right articular fasciculus. The stepwise linear regression models using the FA, AD, and RD of articular fasciculus as predictors achieved an R2 > 0.741 and p < 0.032 in predicting the improvement of 4-expression after LF-rTMS treatment (Fig. 3A to 4C). For the prediction of total score, the constructed regression model achieved an R2 = 0.804 and p = 0.003 using the ADC values of articular fasciculus as predictors (Fig. 3D). It is noted that the predicted change scores of CCAT items (ΔCCAT) base on the pre-treatment microstructural indices (FA, AD, RD, and ADC) of right articular fasciculus are consist with the actually measured CCAT change scores (the data points fall along the dashed diagonal lines in Figure 3).Conclusions
This study reported that the language improvement induced by LF-rTMS can be predicted based on the pre-treatment microstructural indices of right arcuate fasciculus. The aphasic stroke patients with higher degree of right white matter integrity have better response to neural modulation effects of rTMS treatment.Acknowledgements
This work was supported by the Ministry of Science and Technology, Taiwan (MOST 109-2314-B-010-022-MY3) and the National Yang-Ming University (VGHUST110-G7-2-2).References
1. Hartwigsen, G. and D. Saur, Neuroimaging of stroke recovery from aphasia–Insights into plasticity of the human language network. Neuroimage, 2019. 190: p. 14-31.
2. Theoret, H., et al., Exploring paradoxical functional facilitation with TMS, in Supplements to Clinical neurophysiology. 2003, Elsevier. p. 211-219.
3. Schlaug, G., S. Marchina, and C.Y. Wan, The use of non-invasive brain stimulation techniques to facilitate recovery from post-stroke aphasia. Neuropsychology review, 2011. 21(3): p. 288.
4. Dijkhuizen, R.M., et al., Functional MRI and diffusion tensor imaging of brain reorganization after experimental stroke. Translational stroke research, 2012. 3(1): p. 36-43.
5. Chung, Y., et al., The concise Chinese aphasia test and its application. J Speech Lang Hearing Assoc, 1998. 13: p. 119-137.
6. Tournier, J.-D., et al., MRtrix3: A fast, flexible and open software framework for medical image processing and visualisation. Neuroimage, 2019. 202: p. 116137.
Figures