2964
Brain Dynamic Functional Connectivity are linked with Attention-Deficit/Hyperactivity Disorder Related Cognitive and Behavioral Dimensions
Lekai Luo1, Lizhou Chen1, Qian Li1, Ning He2, Yuanyuan Li2, Wanfang You1, Yuxia Wang1, Yaxuan Wang1, John A. Sweeney1,3, Lanting Guo2, Qiyong Gong1, and Fei Li1
1Huaxi MR Research Center (HMRRC), Department of Radiology, West China Hospital of Sichuan University, Chengdu, China, 2Department of Psychiatry, West China Hospital of Sichuan University, Chengdu, China, 3Department of Psychiatry and Behavioral Neuroscience, University of Cincinnati, Cincinnati, OH, United States
1Huaxi MR Research Center (HMRRC), Department of Radiology, West China Hospital of Sichuan University, Chengdu, China, 2Department of Psychiatry, West China Hospital of Sichuan University, Chengdu, China, 3Department of Psychiatry and Behavioral Neuroscience, University of Cincinnati, Cincinnati, OH, United States
Synopsis
Sparse canonical correlation analysis (sCCA) was used to delineate multivariate relationship between dynamic functional connectivity (dFC) and behavior or cognition scores in a cohort of children with and without Attention-Deficit/Hyperactivity Disorder (ADHD). We identified four distinct patterns of dFC, each corresponded to a specific dimension of behavior (inattention/hyperactivity, somatization) or cognitive function (inhibition and flexibility, fluency and memory). Altered dFC within the default mode network (DMN) and between DMN and sensorimotor network (SMN) were common to all dimensions.
Introduction
ADHD is a clinically heterogeneous neurodevelopmental disorder with characteristic behavioral and cognitive features. These problems are believed to be driven by atypical brain network organization1. Abnormal static functional connectivity (FC) within and between default-mode, cognitive control networks2, 3 have been identified in ADHD. In addition, the dynamic fluctuation of FC is a topic of developing interest. Some studies have found children with ADHD show abnormal dFC4-6. However, these studies of dFC in ADHD mainly rely on case-control study designs, which may not well capture the full spectrum of ADHD-related variation of brain function and its association with behavioral and cognitive features.Methods
A total of 122 right-handed children (63 with ADHD) participated in this study (Table 1). Clinical measures for all participants including behavior and cognition (Table 1). All participants underwent resting-state functional magnetic resonance imaging (rfMRI) by using a 3-T Siemens Trio MRI scanner (TR/TE=2000/30ms, flip angle=90°, slice thickness=5mm with no gap, voxel size=3.75×3.75×5mm3). After rfMRI data preprocessing, the dFC networks were built using sliding-window approach (window size=22TR, step=1TR)7 with Power atlas8, where brain regions were assigned to ten large-scale resting-state networks (Fig. 1A). Temporal variability of FC was estimated by the standard deviation across all sliding windows between each pair of brain regions (Fig. 1B). Then we performed sparse canonical correlation analysis (sCCA)9 to find multivariate relationships between brain imaging data and behavior or cognition, respectively (Fig. 1C). Permutation tests (1000 times) were used to assess the statistical significance of the canonical correlation, and false discovery rate (FDR) correction was used to preserve the Type I error at P<0.05. Finally, bootstrapping procedure was used to estimate mean and standard error for canonical correlation coefficients and to identify reliable features that consistently contributed to the correlation.Results
We identified four distinct patterns of dFC, each corresponding to a specific dimension of behavior (inattention/hyperactivity, somatization) or cognitive function (inhibition and flexibility, fluency and memory) (r=0.811 - 0.879, PFDR<0.05) (Fig. 2). Specially, the higher inattention/hyperactivity dimension scores mainly correlated with higher dFC within DMN and lower dFC between DMN and other networks (e.g. SMN, FPN). While the higher somatization dimension scores mainly correlated with higher dFC within DMN and lower dFC between SMN and other networks (e.g. DMN, VIS). Better cognitive functions for inhibition and flexibility as well as fluency and memory were correlated with a similar dFC pattern characterized by higher dFC between DMN and SMN/VIS as well as lower dFC between DMN and FPN (Fig. 3, Fig. 4A-B).While each dimension was comprised of unique patterns of dFC, there were several features shared across all dimensions. Shared dFCs were mainly located within and between DMN and other networks. At the link level, these dFCs could be mapped to specific nodes, and 16 brain regions consistently contributed to all of the four dimensions, in which most regions belonged to DMN (Fig. 4C-D).
Discussion
In this study, we applied dimensional approach and identified specific dFC patterns linked to four interpretable dimensions of behavior or cognitive function in a population including both typically developing children and children with ADHD. The inattention/hyperactivity dimension represents the core behavioral abnormalities of ADHD. The dFC pattern that was most strongly expressed by this dimension included positive loadings of dFC within DMN and negative loadings of dFC between DMN and task-positive networks. Mounting evidence indicates that ADHD can in part be regarded as a DMN disorder10, considering DMN dysfunctions as a primary cause of attention lapses2, 11, 12. The instability of DMN may reduce its temporal coherence with task-positive networks, as we observed less variable dynamic cross-network interaction between DMN and task-positive networks related with severer inattention/hyperactivity. The somatization dimension was composed of factors including psychosomatic problems, somatic complaints, and internalizing. Higher somatization dimension scores were related to higher dFC within DMN and lower dFC between SMN and other networks. Similarly, Ernst et al. found lower static connectivity of DMN predicted higher internalizing symptoms in adolescent population13. Moreover, previous studies have shown that connections between SMN and DMN are related to somatization14, 15. Therefore, we inferred abnormal dynamic interactions between DMN and SMN may induce endogenous feeling of bodily symptoms without sufficient explanatory peripheral pathology. For dFC-cognition sCCA, we found both of the significant cognitive dimensions correlated with a similar dFC pattern mainly characterized by dFC within SMN, VIS, and DMN, as well as among the three networks. In support of our findings, previous studies have found dynamic cooperation of these networks correlated with cognitive function16-18.While each behavior or cognitive dimension was associated with a unique pattern of dFC, dFCs within and between DMN and other networks (dominantly between DMN and SMN) were common to all dimensions. This finding provided evidence that behavior problems and cognition deficits in ADHD may have some shared neural bases.
Conclusion
In summary, we identified multivariate patterns of dFC that were highly correlated with four dimensions of behaviors and cognitive functions. Each identified multivariate dimension displayed specific dFC features, while altered dFC within and between DMN and other networks was common to all dimensions. Our findings present evidence of common and distinct alterations of brain dynamics linked to specific ADHD-related behavior or cognition dimensions.Acknowledgements
No acknowledgement found.References
- Cao, M., et al., Imaging functional and structural brain connectomics in attention-deficit/hyperactivity disorder. Mol Neurobiol. 50(3),1111-23 (2014).
- Castellanos, F.X. and Y. Aoki, Intrinsic Functional Connectivity in Attention-Deficit/Hyperactivity Disorder: A Science in Development. Biol Psychiatry Cogn Neurosci Neuroimaging. 1(3),253-261 (2016).
- Li, F., et al., Intrinsic brain abnormalities in attention deficit hyperactivity disorder: a resting-state functional MR imaging study. Radiology. 272(2),514-23 (2014).
- Mowinckel, A.M., et al., Increased default-mode variability is related to reduced task-performance and is evident in adults with ADHD. Neuroimage-Clinical. 16,369-382 (2017).
- Nomi, J.S., et al., Resting-State Brain Signal Variability in Prefrontal Cortex Is Associated With ADHD Symptom Severity in Children. Frontiers in Human Neuroscience. 122018).
- Scofield, J.E., et al., Latent resting-state network dynamics in boys and girls with attention-deficit/hyperactivity disorder. PLoS One. 14(6),e0218891 (2019).
- Allen, E.A., et al., Tracking whole-brain connectivity dynamics in the resting state. Cereb Cortex. 24(3),663-76 (2014).
- Power, J.D., et al., Functional network organization of the human brain. Neuron. 72(4),665-78 (2011).
- Witten, D.M., R. Tibshirani, and T. Hastie, A penalized matrix decomposition, with applications to sparse principal components and canonical correlation analysis. Biostatistics. 10(3),515-34 (2009).
- Kaboodvand, N., B. Iravani, and P. Fransson, Dynamic synergetic configurations of resting-state networks in ADHD. Neuroimage. 207,116347 (2020).
- Sonuga-Barke, E.J. and F.X. Castellanos, Spontaneous attentional fluctuations in impaired states and pathological conditions: a neurobiological hypothesis. Neurosci Biobehav Rev. 31(7),977-86 (2007).
- Weissman, D.H., et al., The neural bases of momentary lapses in attention. Nat Neurosci. 9(7),971-8 (2006).
- Ernst, M., et al., Pubertal maturation and sex effects on the default-mode network connectivity implicated in mood dysregulation. Transl Psychiatry. 9(1),103 (2019).
- Zhao, Z., et al., Altered resting-state intra- and inter- network functional connectivity in patients with persistent somatoform pain disorder. PLoS One. 12(4),e0176494 (2017).
- Otti, A., et al., Functional network connectivity of pain-related resting state networks in somatoform pain disorder: an exploratory fMRI study. J Psychiatry Neurosci. 38(1),57-65 (2013).
- Chadick, J.Z. and A. Gazzaley, Differential coupling of visual cortex with default or frontal-parietal network based on goals. Nat Neurosci. 14(7),830-2 (2011).
- Dajani, D.R. and L.Q. Uddin, Demystifying cognitive flexibility: Implications for clinical and developmental neuroscience. Trends Neurosci. 38(9),571-8 (2015).
- Vatansever, D., et al., Default mode network connectivity during task execution. Neuroimage. 122,96-104 (2015).
Figures
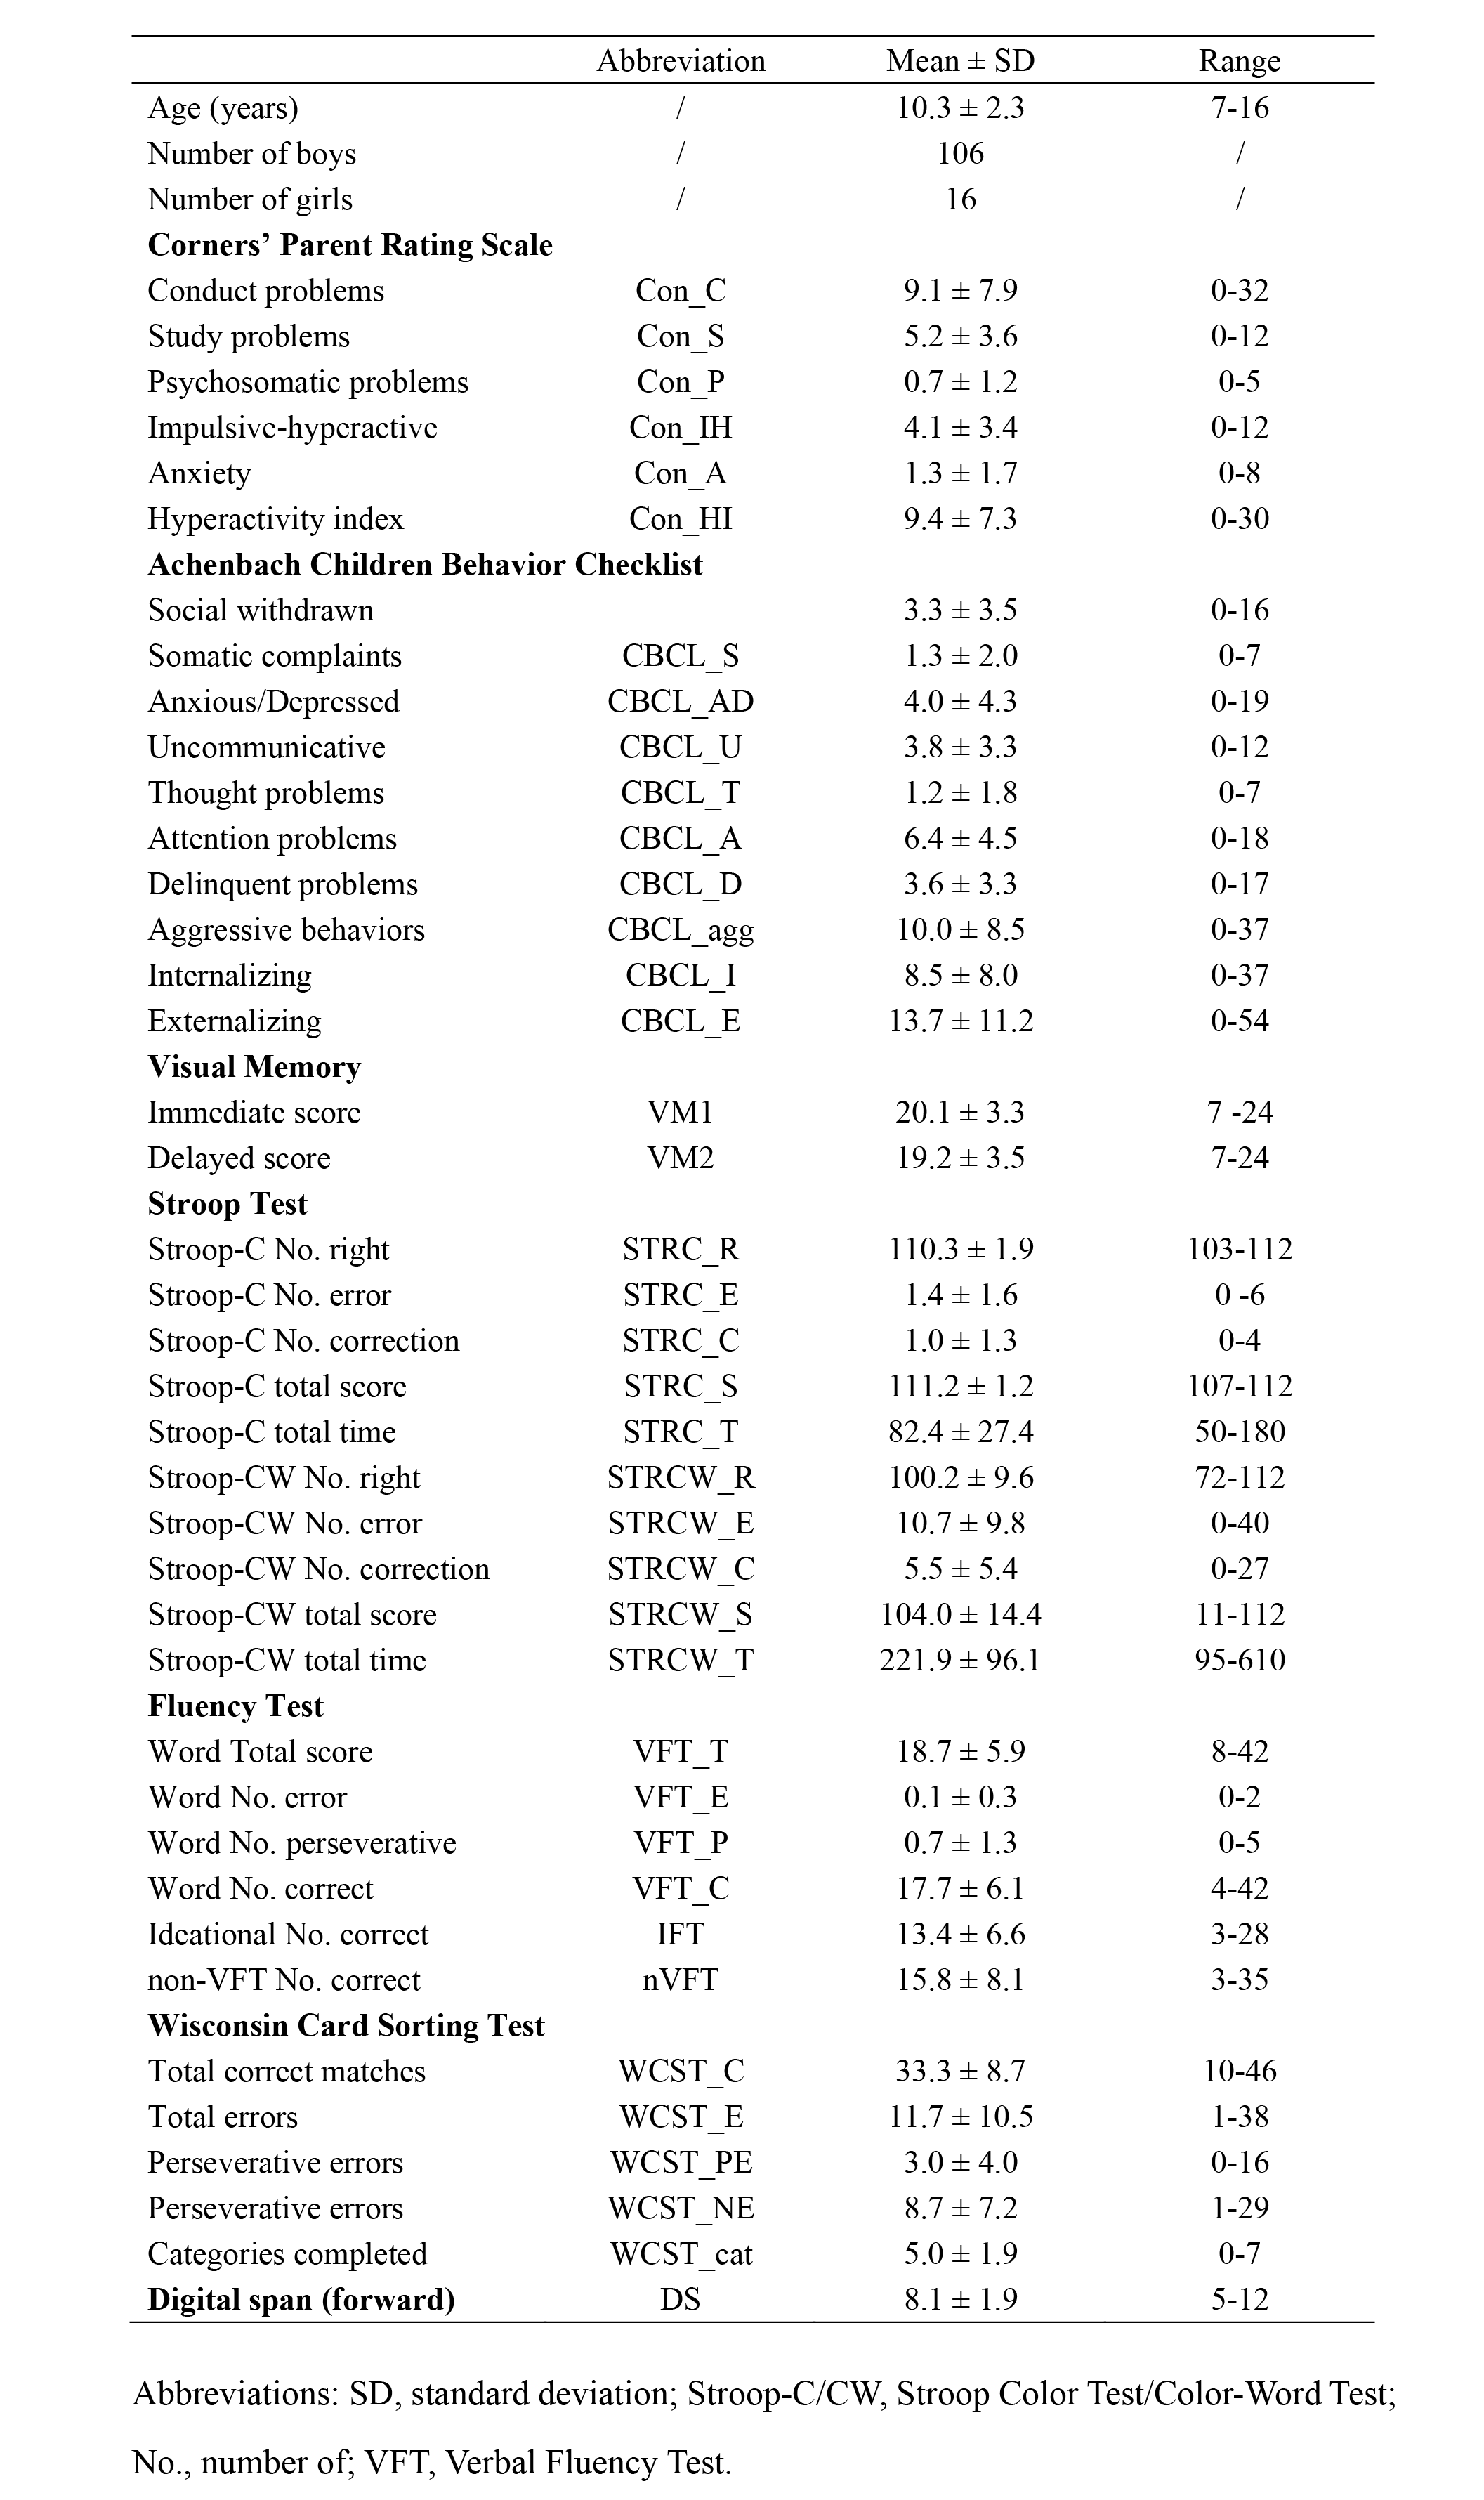
Table 1. Demographic
and clinical characteristics of all participants in the present study.
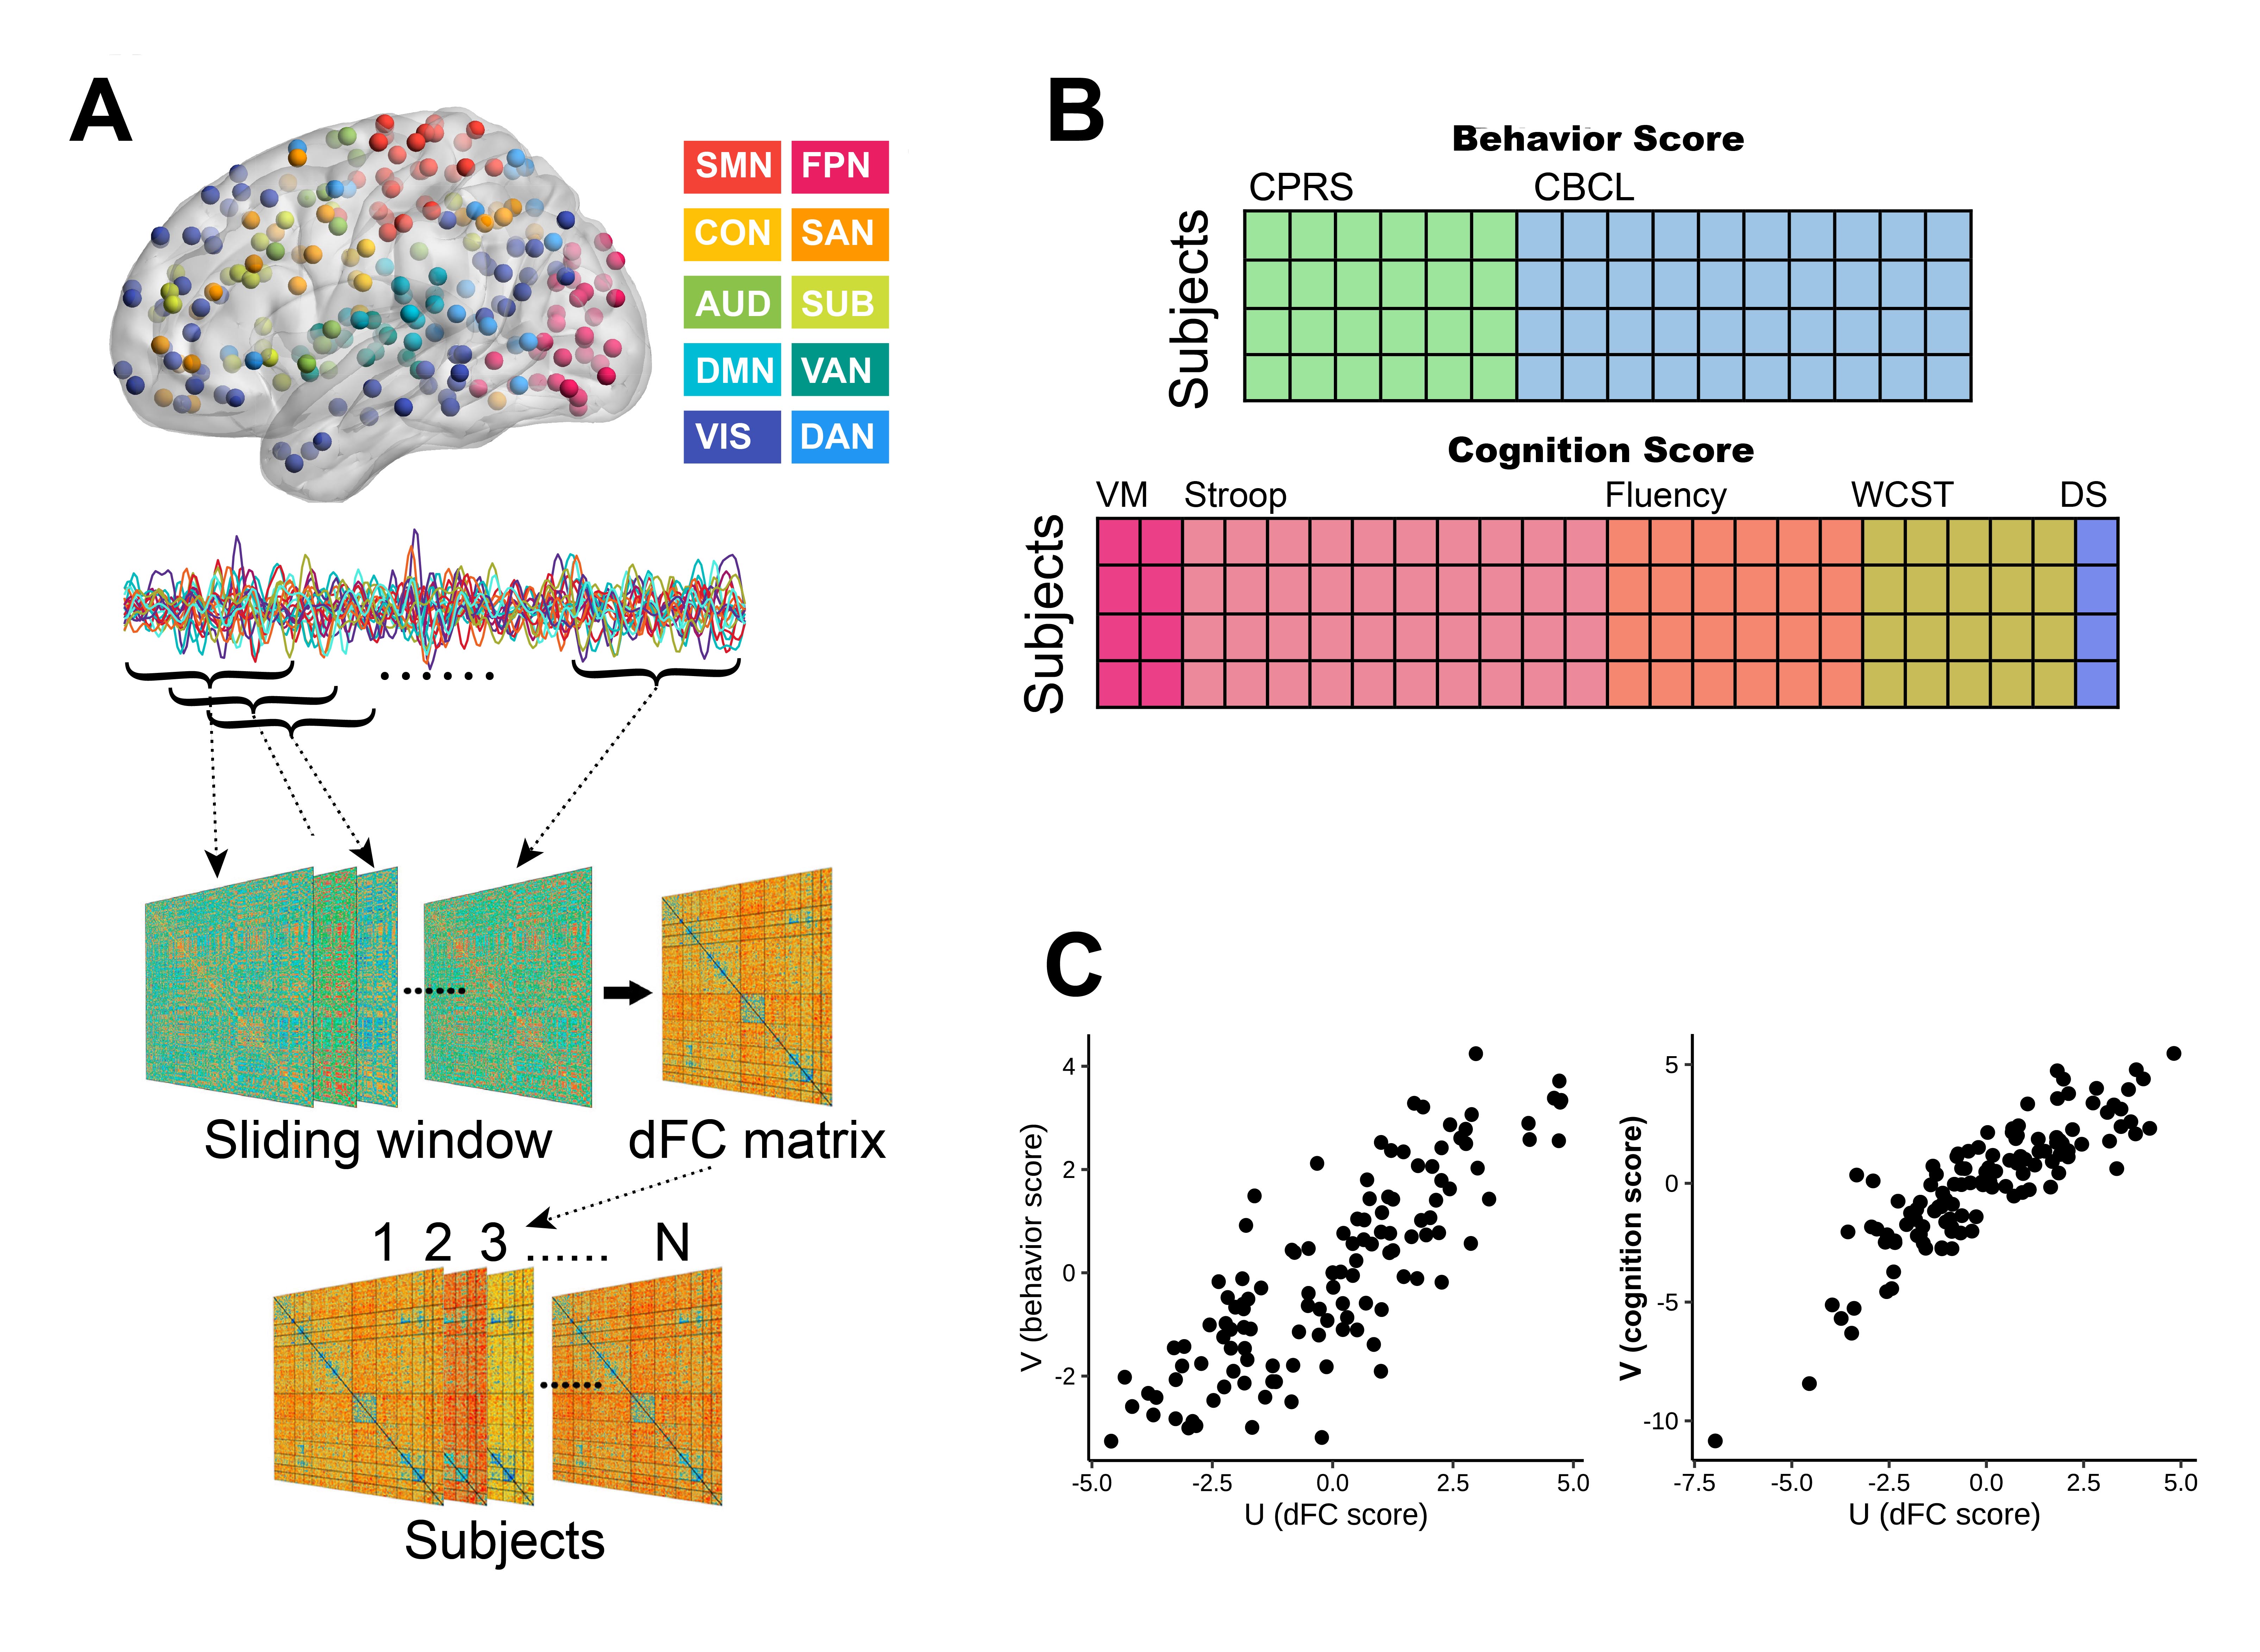
Fig. 1. A. Construction of dynamic FC (dFC) matrices. B. Behavior and cognition scores were entered into sCCA as clinical
features. C. sCCA seeks a linear
combination of dFC features and clinical features that maximize their
correlation. Abbreviations: SMN, sensorimotor network; CON, cingulo-opercular
network; AUD, auditory network; DMN, default mode network; VIS, visual network;
FPN, fronto-parietal network; SAN, salience network; SUB, subcortical network;
VAN, ventral attention network; DAN, dorsal attention network.
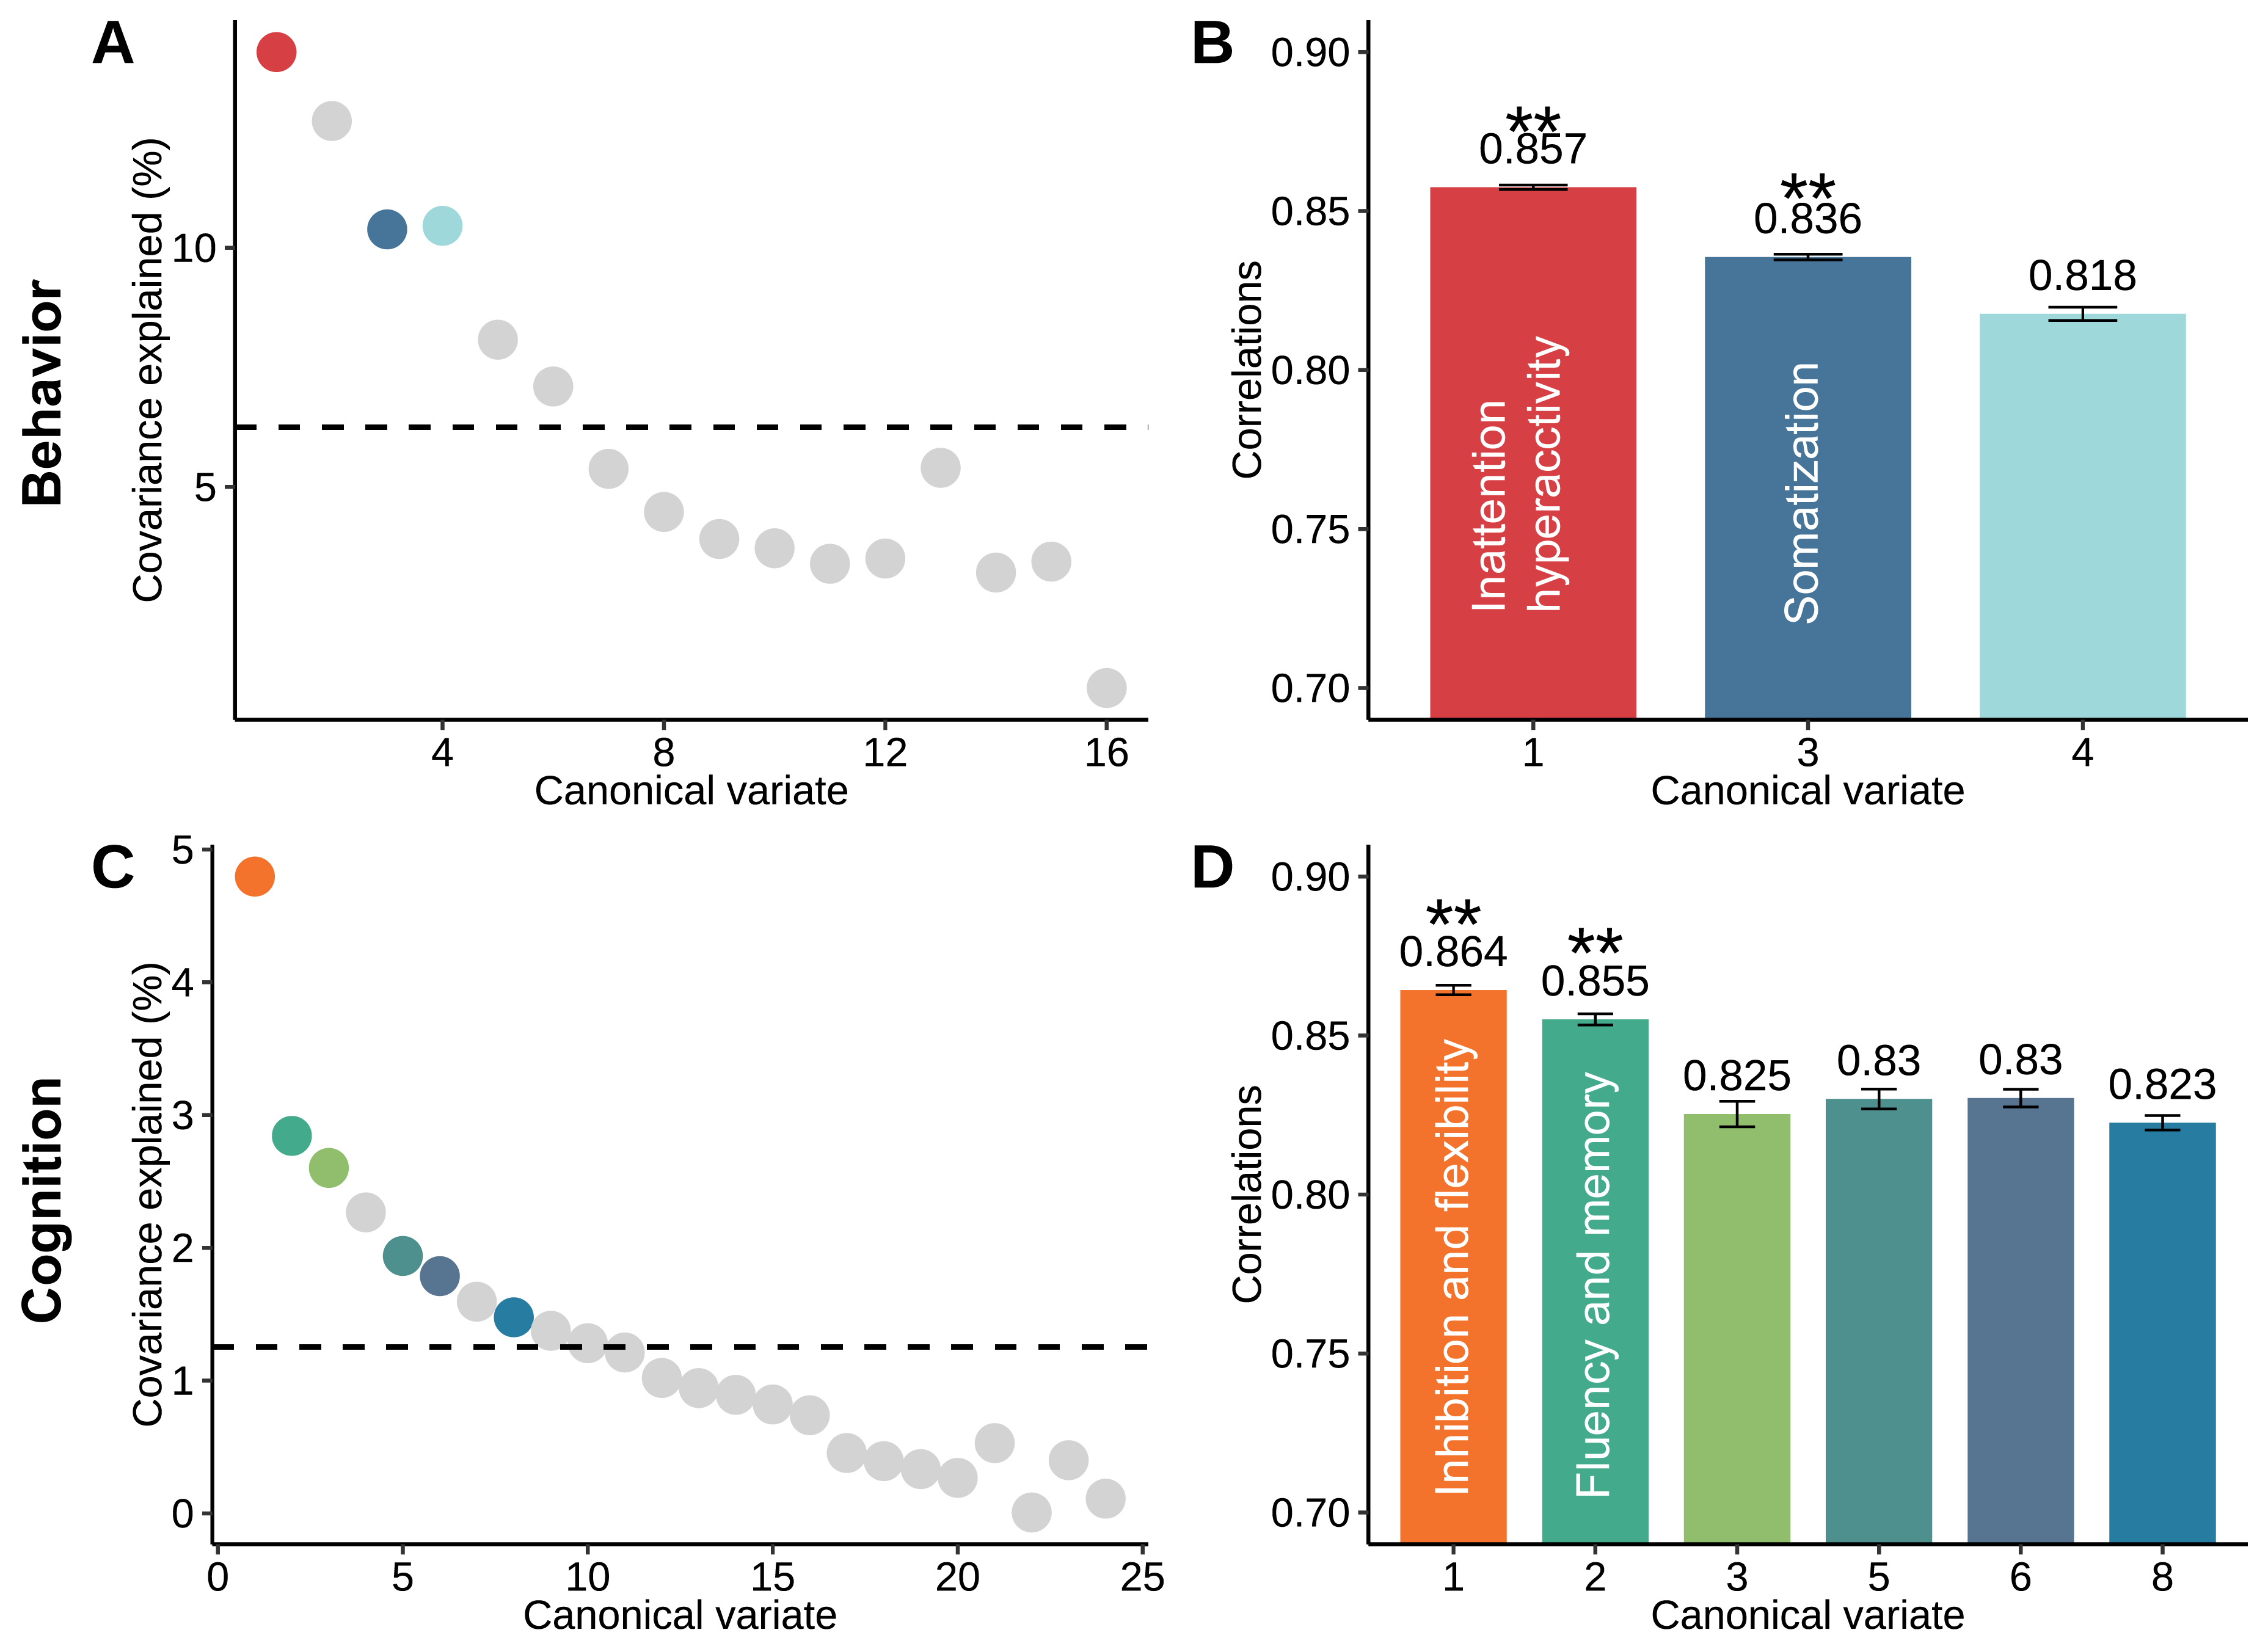
Fig.
2. A, C. The
covariance explained of each canonical variate. The colored dots represent the
significant canonical variates (uncorrected P<0.05). B, D. The canonical correlation coefficients of the significant
canonical variates in panel A and C. The colored dots represent the significant
canonical variates (uncorrected P<0.05). Dashed lines in panels A and C mark the average
covariance explained. Error bars in panels B and D denote standard error
obtained by the bootstrapping procedure. The ** represents the FDR corrected P<0.05.
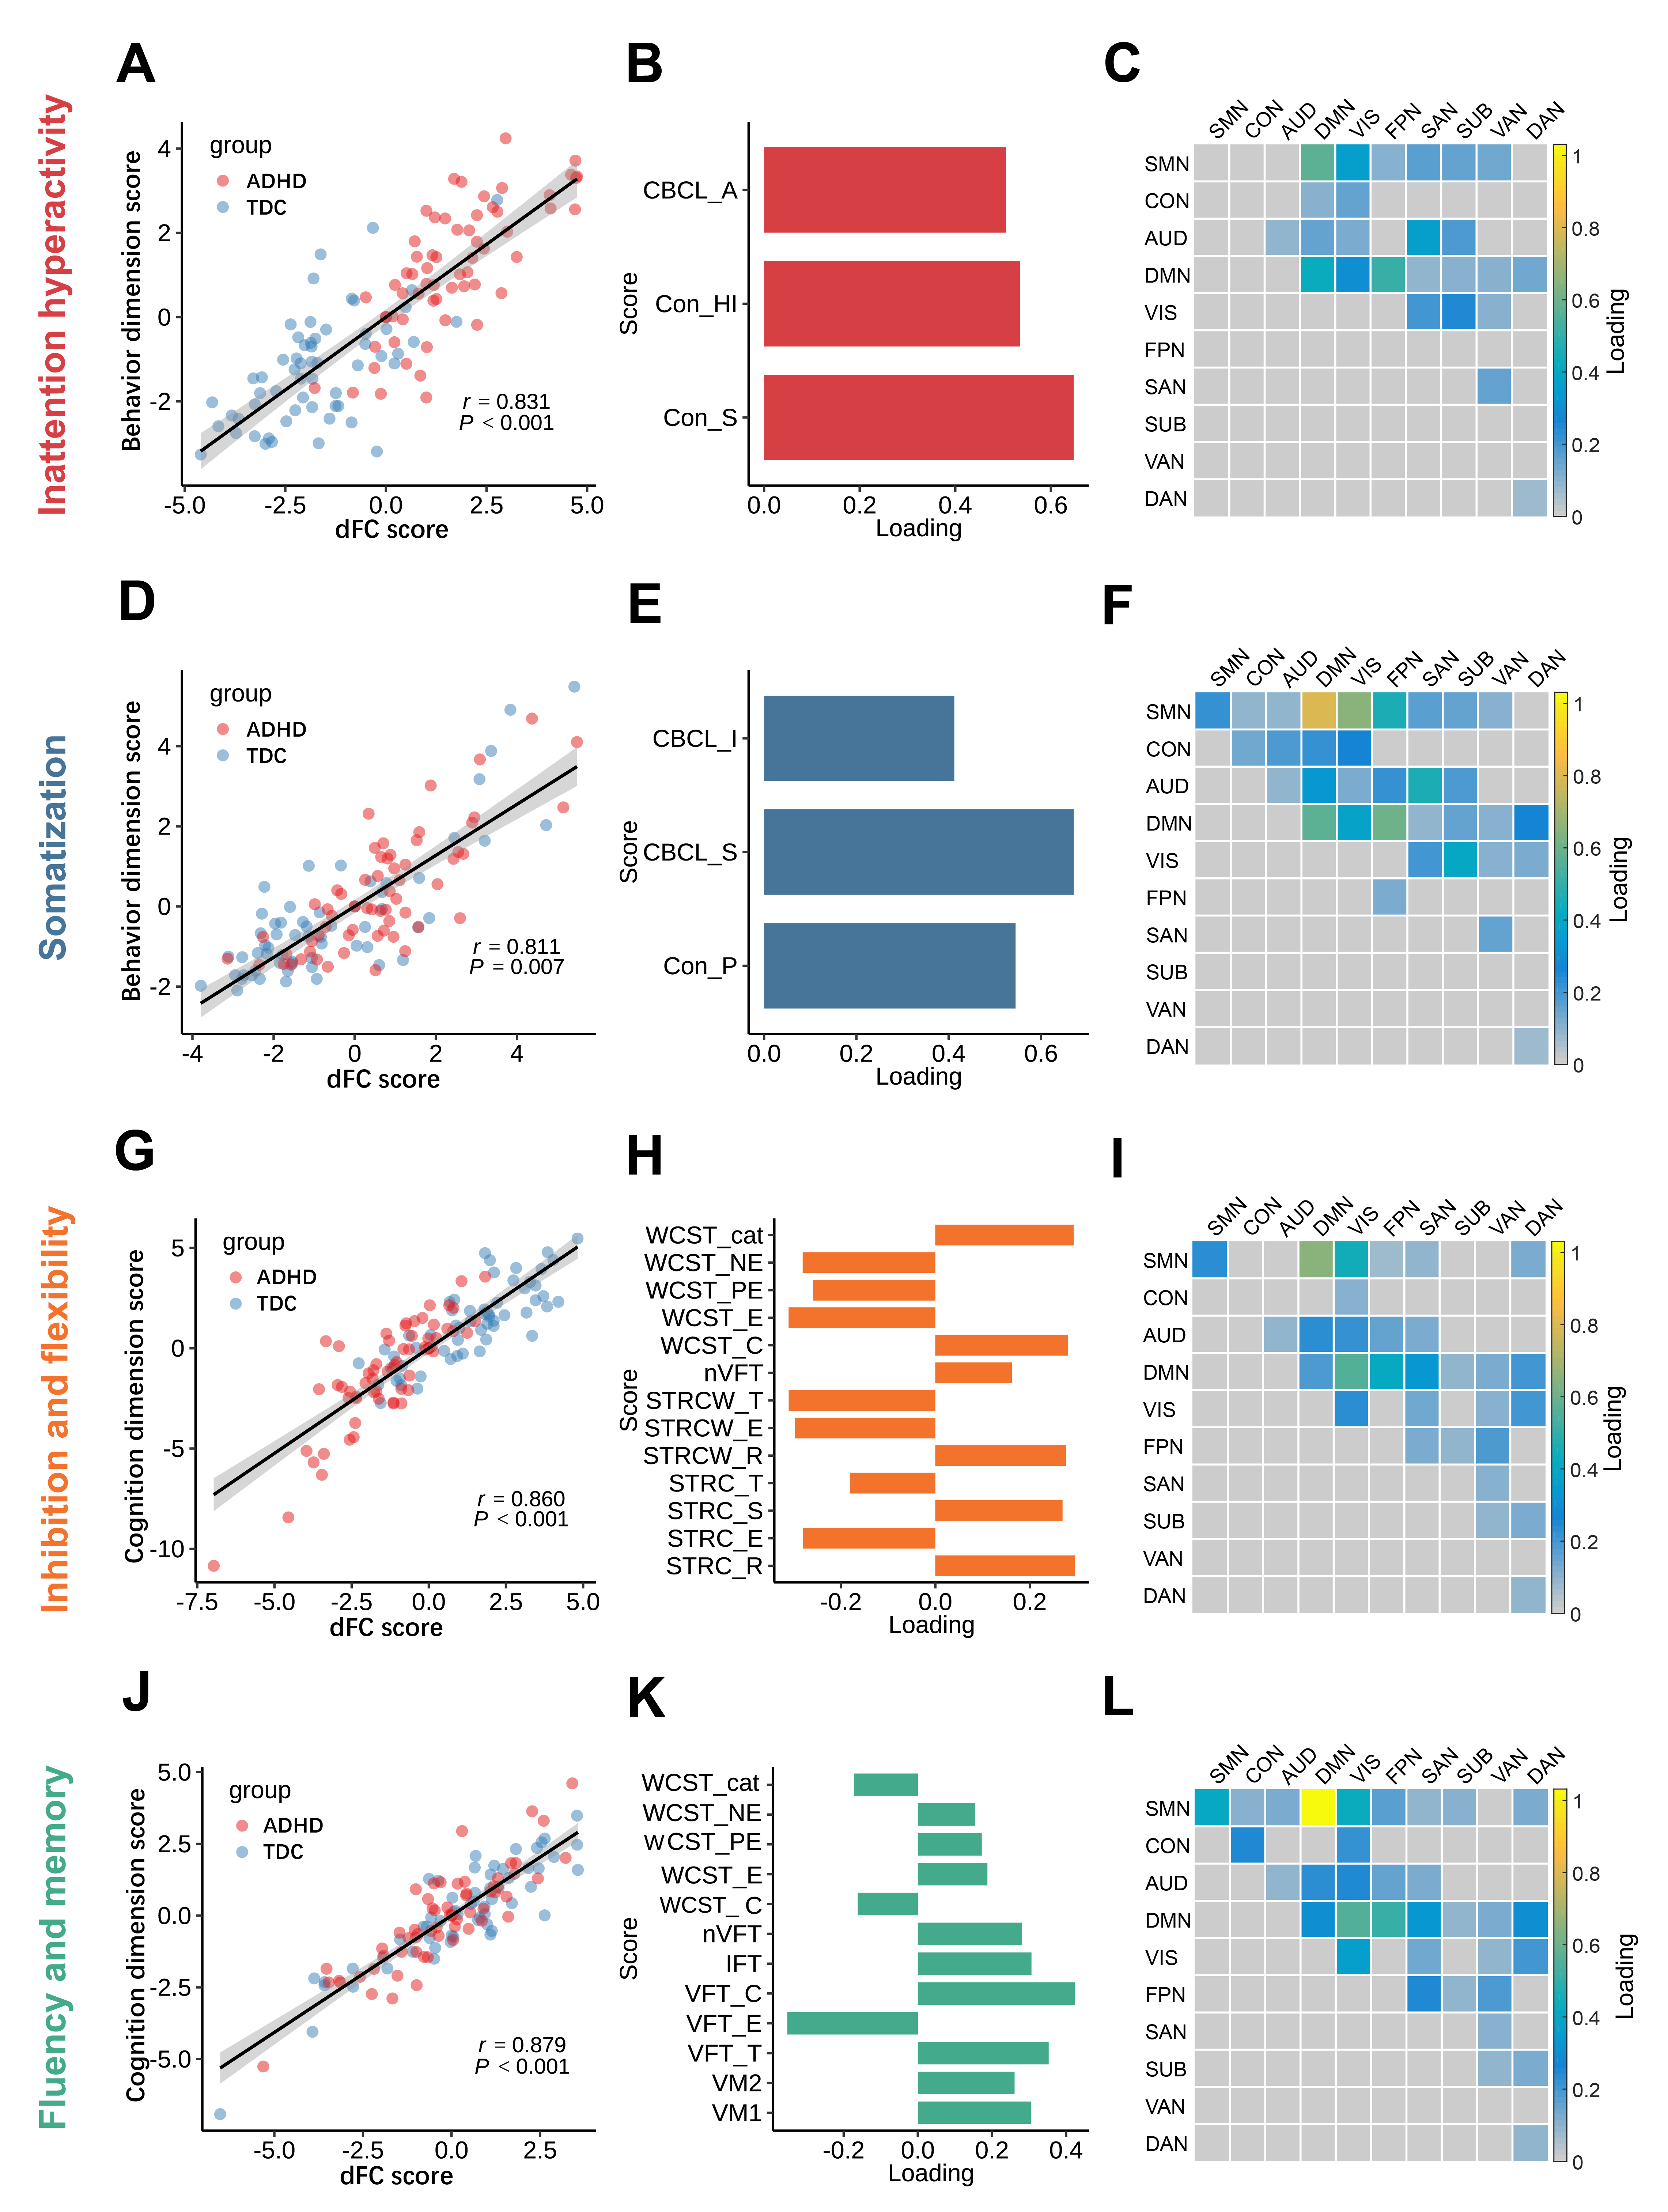
Fig. 3. Four significantly linked dimensions. (A, D, G, J). The scatter plots
of linear combinations of dFC and behavior/cognition scores, respectively,
demonstrate the correlated multivariate patterns of dFC and clinical variates.
(B, E, H, K). The loadings of clinical variates
for each dimension. (C, F, I, L).
The sum of the absolute values of loadings of dFC at the within- and
between-networks level. For the abbreviations of clinical measurements and
brain networks see Table 1 and Fig. 1, respectively.
Fig. 4.
A, B. Both positive and
negative loadings for specific dynamic functional connectivity (dFC) links
contributed to each behavior dimension and cognition dimension. C. Overlapped
nodes that significantly contributed to every dimension. The size of the
spheres denotes the sum of their absolute loadings. D. The colored grids
represent the sum of the absolute loadings of shared dFCs at the network level.
For the abbreviations of brain networks see Fig. 1.
DOI: https://doi.org/10.58530/2022/2964