2963
Multimodal imaging signatures of the epileptogenic zone1School of Biomedical Engineering, Shanghai Jiao Tong University, Shanghai, China, 2Department of Nuclear Medicine, Ruijin Hospital, Shanghai Jiao Tong University School of Medicine, Shanghai, China, 3Department of Neurosurgery, Ruijin Hospital, Shanghai Jiao Tong University School of Medicine, Shanghai, China, 4Department of Electrical and Computer Engineering, University of Illinois at Urbana Champaign, Urbana, IL, United States, 5Beckman Institute for Advanced Sciences and Technology, University of Illinois at Urbana Champaign, Urbana, IL, United States
Synopsis
Accurate detection of the epileptogenic zone for surgical planning often relies on stereo-electroencephalography, which is limited by low spatial sampling. Development of noninvasive brain high resolution imaging to better identify epileptogenic zone is of great value. This study aimed to investigate the imaging signature for detection of epileptogenic zones among features extracted from structural, functional, and metabolic imaging using hybrid PET/MR scanner. Our results highlighted the value of combination between metabolic and functional imaging features.
Introduction
Accurate localization of epileptogenic zone (EZ) is important for successful presurgical planning for drug-resistant epilepsy patients1. Stereo-electroencephalography (SEEG) remains mandatory to assess the network of epileptogenicity, especially when patients have negative MRI1, 2. Unfortunately, low spatial sampling of each electrode and/or misguided implantation may result in the resection of an insufficient brain area3. Therefore, development of noninvasive whole brain high resolution imaging to better identify EZ and to guide electrode implantation is of great clinical value. Reduced glucose metabolism, oxidative stress, neuronal loss, and reactive gliosis have been recognized as pathophysiological alterations in epileptogenicity4-7. In this study, with multimodal imaging capability of SPICE (SPectroscopic Imaging by exploiting spatiospectral CorrElation)8 along with fMRI, and simultaneous 18F-FDG PET on a PET/MR scanner, we investigated the correlations between these modalities and epileptogenicity, and whether the combination of important features could provide more information for detection of EZ.Method
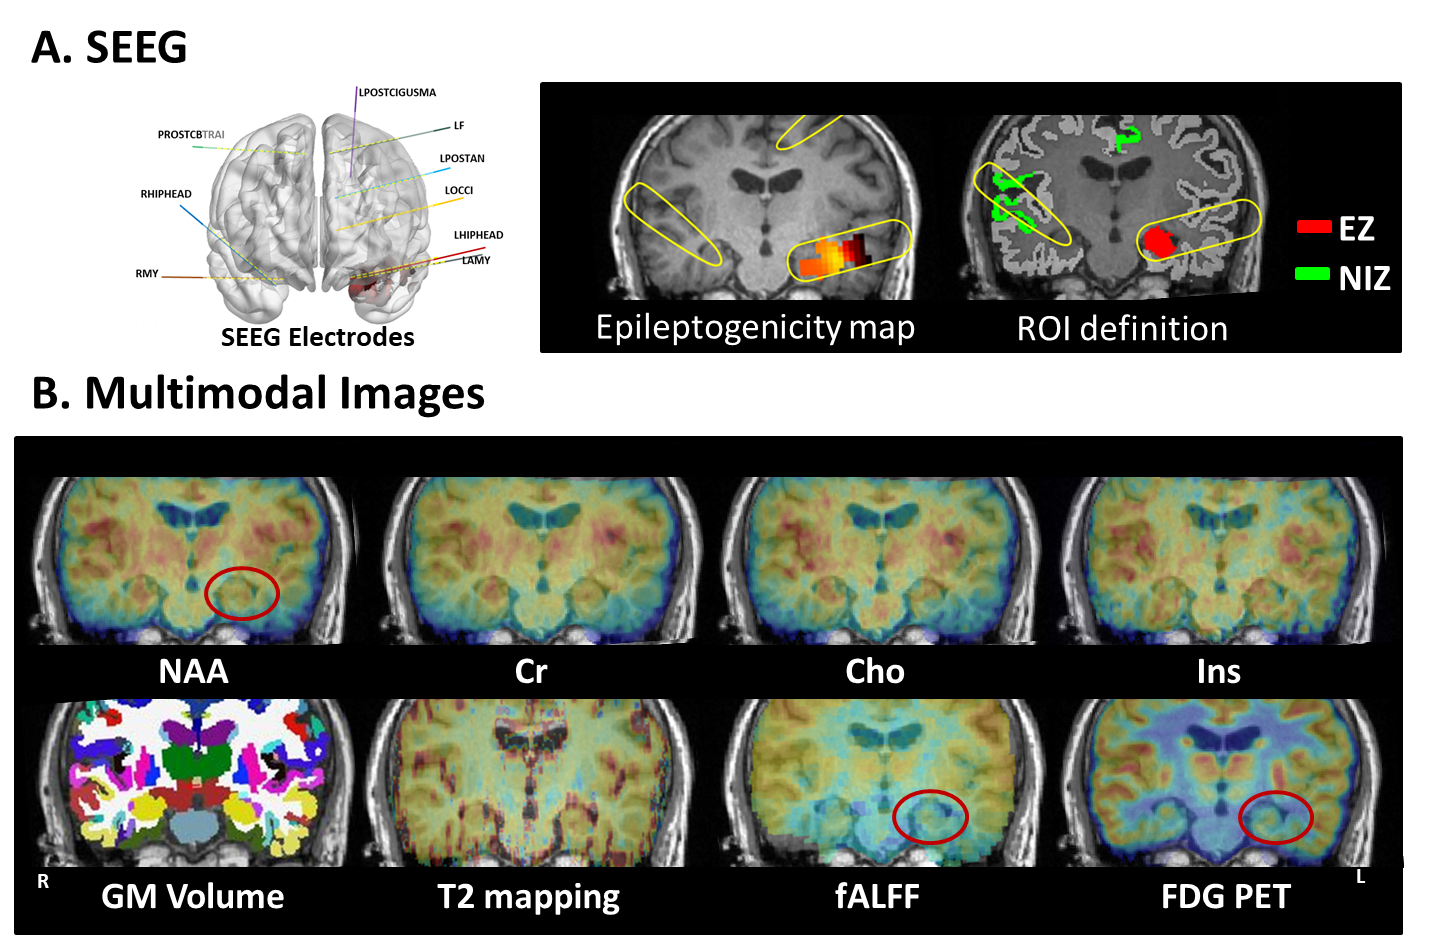
Data acquisition: In this IRB-approved study, eleven epilepsy patients were recruited, with demographics listed in Table 1. In addition, fifteen healthy volunteers were recruited. The scans were performed on a PET/MR scanner (Biograph mMR; Siemens Healthcare, Erlangen, Germany) at Ruijin Hospital, Shanghai, China. The PET images were obtained at 15 minutes post a bolus injection of 18F-FDG (mean dose of 3.7 MBq/kg, matrix size 344×344, voxel size 2.0×2.0×2.0 mm3, 127 slices). The MR experimental protocols included high-resolution MRSI scans using SPICE (2.0×2.4×3.0 mm3, FOV 240×240×72 mm3, TR/TE: 160/1.6 ms, 7 minutes); Resting-state fMRI (3.0×3.0×3.0 mm3, TR/TE: 3000/30 ms, 200 time points), T2 mapping (multi-echo spin echo T2 mapping sequence with 0.4×0.4×5.0 mm3, FOV 230×230 mm2, 21 slices, TR/TEs 2000/(10.5, 21.0, 31.5, 42.0, 52.5 and 63.0) ms), and T1-weighted MPRAGE (1.0×1.0×1.0 mm3, FOV 256×256 mm2, 192 slices, TR/TE: 1900/2.44 ms). Long-term video-SEEG monitoring was performed as part of their clinical requirement to record the patients’ usual seizures, using intracerebral multiple-contact electrodes (Dixi Medical or Alcis), consisting of 8–16 contacts with length 2 mm, diameter 0.8 mm, spaced by 1.5 mm.Data processing: Reconstruction of the MRSI spatiospectral functions was performed using a union-of-subspaces model, incorporating pre-learned spectral basis functions as described in previous publications8-10. Then, spectral quantification was done using an improved LCModel-based algorithm that incorporated both spatial and spectral priors11, which generated metabolite maps of NAA, Cho, Cr, and mI. The FDG uptakes (SUVRs) were obtained using intensity normalization by cerebellar scaling of 18F-FDG PET images. Normalized gray matter volumes were extracted from the T1-MPRAGE using FreeSurfer v7.0 package. T2 maps were obtained using a monoexponential nonnegative least-squares fitting of the multi-echo signals, removing voxels with T2 > 170 ms to minimize CSF contaminations12. fMRI images were preprocessed using DPARSFA toolbox13, 14, obtaining maps of the amplitude of low frequency fluctuations (ALFFs) and fractional ALFF (fALFF) in the bandpass 0.01 to 0.1 Hz15, 16, as well as regional homogeneity (ReHo, a measure of local connectivity)17. Epileptogenicity map, a statistical parametric three-dimensional (3D) map quantifying high-frequency oscillations (HFOs) in SEEG signal at seizure onset, which is described in full details in previous study18. Briefly, brain areas whose high-frequency activity of seizure was significantly greater than baseline within distance of 10 mm from SEEG electrodes were defined as EZ; all other regions without high-frequency activity were defined as non-involved zone (NIZ).
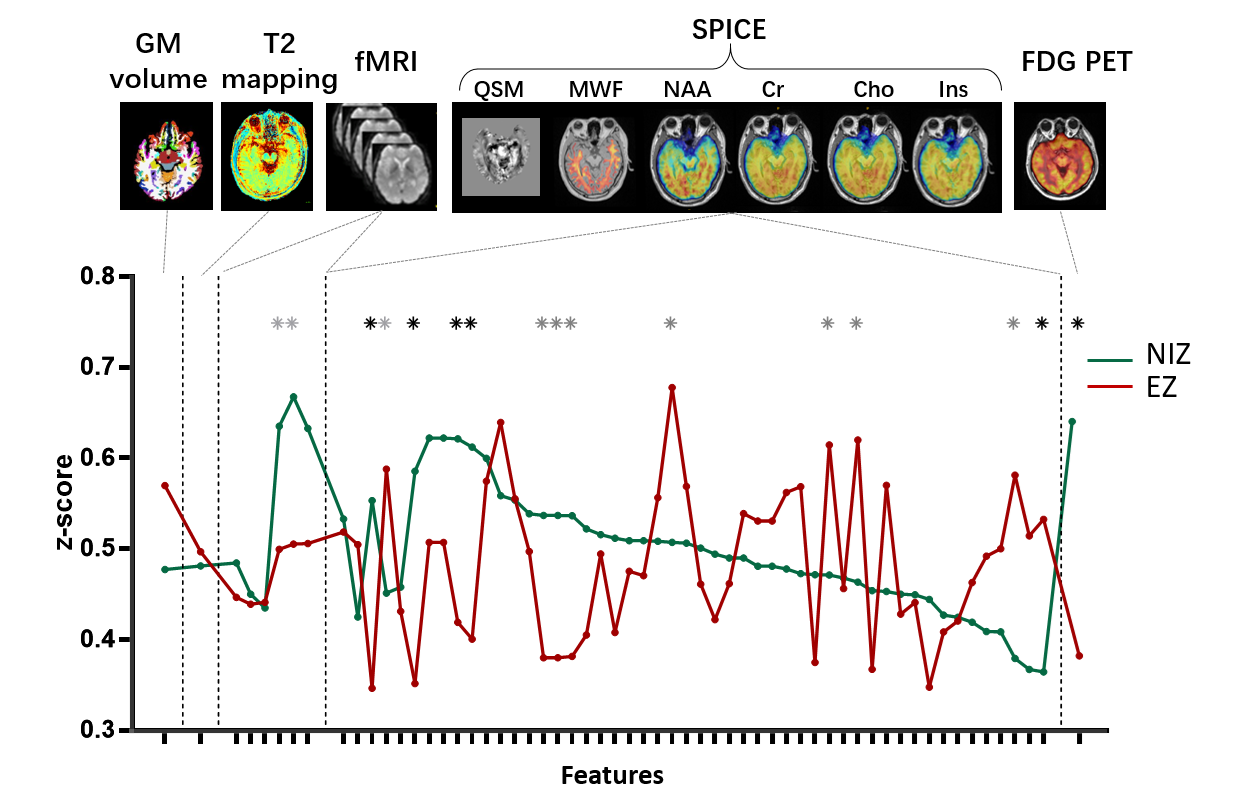
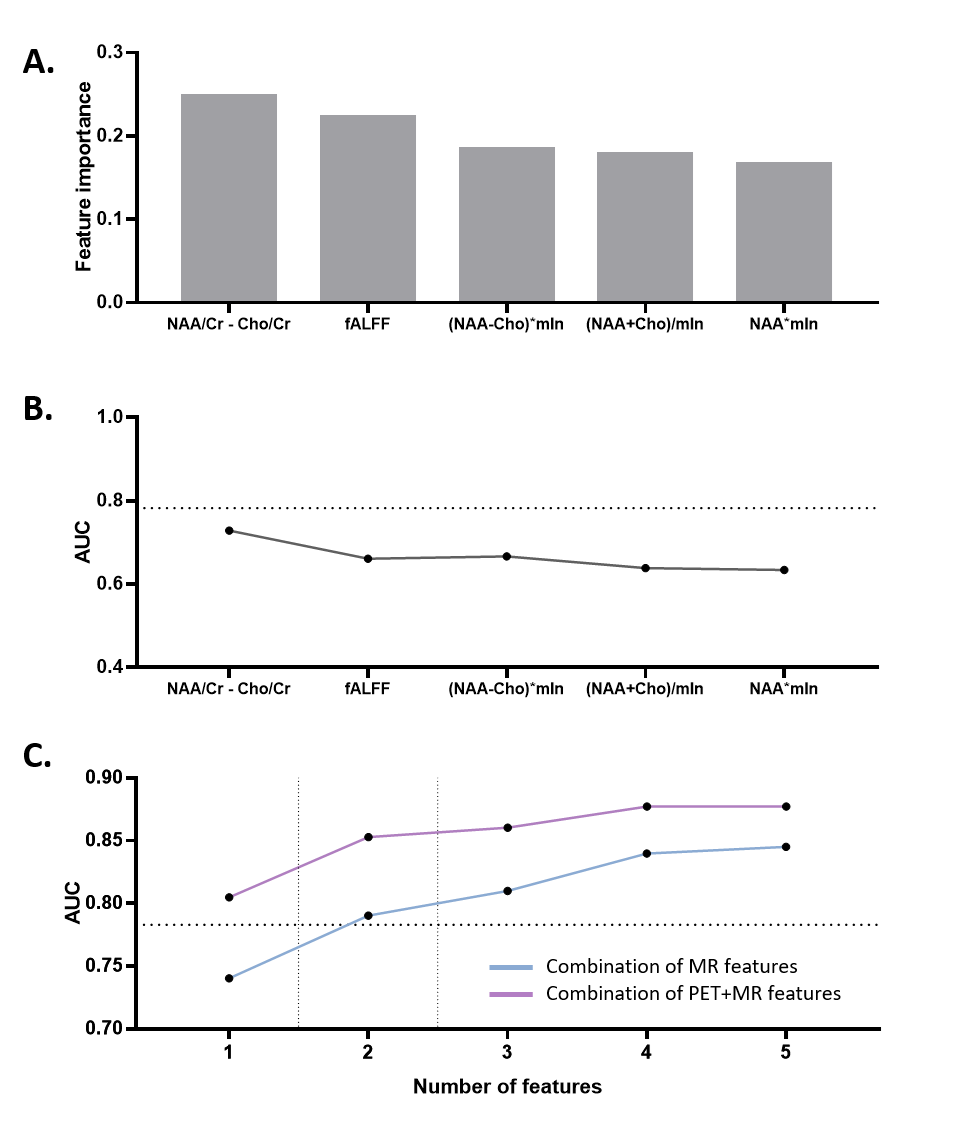
Statistical analysis: Region-of-interest based imaging features were extracted for EZ and NIZ regions in each modality. Combined metabolic features were generated based on permutation and combination of arithmetic operations on NAA, Cho and mIn. The Mann-Whitney tests were applied to screen features that show significant differences between EZ and NIZ. We trained a random forest classifier to carry out feature importance measurements by calculating the reduction in Gini impurity. Subsequently, top five of the above features were used to discriminate EZ and NIZ using logistic regression.
Results and discussions
In a temporal lobe epilepsy patient, the epileptogenicity map revealed EZ involving left hippocampus, where the reduction of NAA, fALFF, and low FDG uptake can be found in the same region from multimodal images (Figure 1). The features that show statistical difference between EZ and NIZ are (NAA-Cho)/Cr, NAA/Cr, NAA/(Cho+Cr), (NAA+mIn)/Cr, (Cho-mIn)·NAA, and PET SUVR (Figure 2). After eliminating feature redundancy based on similarity measure between features, we selected a feature subset for localization of EZ based on Gini impurity (Figure 3A). The performance of these MR based features in differentiating EZ from NIZ are displayed in comparison to that of FDG PET (Figure 3B). The (NAA-Cho)/Cr is the most important feature with an AUC of 0.74, followed by fALFF (AUC=0.66). Though none of single MR features exceeded that of PET (AUC=0.78), the combination of the top two important MR features resulted in AUC of 0.79, and the combination of top 5 most important MR features showed substantial improvement (AUC=0.84) (Figure 3C). Furthermore, the best performance was the multivariable MR+PET models with the highest AUC of 0.87.Conclusion
Our findings suggest that the combination of spectroscopic and functional MR features may provide promising imaging markers for the detection of the epileptogenic zone. Larger sample size and further investigations are needed to fully assess their potential and clinical value in presurgical planning for epilepsy.Acknowledgements
This work is supported partially by NSFC 62101321.References
- Spencer DD, Gerrard JL, Zaveri HP. The roles of surgery and technology in understanding focal epilepsy and its comorbidities. Lancet Neurol. 2018 Apr;17:373-382.
- Zijlmans M, Zweiphenning W, van Klink N. Changing concepts in presurgical assessment for epilepsy surgery. Nat Rev Neurol. 2019 Oct;15:594-606.
- Bartolomei F, Lagarde S, Wendling F, McGonigal A, Jirsa V, Guye M, et al. Defining epileptogenic networks: Contribution of SEEG and signal analysis. Epilepsia. 2017 Jul;58:1131-1147.
- Tenney JR, Rozhkov L, Horn P, Miles L, Miles MV. Cerebral glucose hypometabolism is associated with mitochondrial dysfunction in patients with intractable epilepsy and cortical dysplasia. Epilepsia. 2014 Sep;55:1415-1422.
- Vezzani A, Balosso S, Ravizza T. Neuroinflammatory pathways as treatment targets and biomarkers in epilepsy. Nat Rev Neurol. 2019 Aug;15:459-472.
- Pitkänen A, Ekolle Ndode-Ekane X, Lapinlampi N, Puhakka N. Epilepsy biomarkers - Toward etiology and pathology specificity. Neurobiol Dis. 2019 Mar;123:42-58.
- Patel DC, Tewari BP, Chaunsali L, Sontheimer H. Neuron-glia interactions in the pathophysiology of epilepsy. Nat Rev Neurosci. 2019 May;20:282-297.
- Lam F, Liang ZP. A subspace approach to high-resolution spectroscopic imaging. Magn Reson Med. 2014 Apr;71:1349-1357.
- Lam F, Ma C, Clifford B, Johnson CL, Liang ZP. High-resolution (1) H-MRSI of the brain using SPICE: Data acquisition and image reconstruction. Magn Reson Med. 2016 Oct;76:1059-1070.
- Ma C, Lam F, Johnson CL, Liang ZP. Removal of nuisance signals from limited and sparse 1H MRSI data using a union-of-subspaces model. Magn Reson Med. 2016 Feb;75:488-497.
- Li Y, Lam F, Clifford B, Liang ZP. A Subspace Approach to Spectral Quantification for MR Spectroscopic Imaging. IEEE Trans Biomed Eng. 2017 Oct;64:2486-2489.
- Winston GP, Vos SB, Burdett JL, Cardoso MJ, Ourselin S, Duncan JS. Automated T2 relaxometry of the hippocampus for temporal lobe epilepsy. Epilepsia. 2017 Sep;58:1645-1652.
- Chao-Gan Y, Yu-Feng Z. DPARSF: A MATLAB Toolbox for "Pipeline" Data Analysis of Resting-State fMRI. Front Syst Neurosci. 2010;4:13.
- Gargouri F, Gallea C, Mongin M, Pyatigorskaya N, Valabregue R, Ewenczyk C, et al. Multimodal magnetic resonance imaging investigation of basal forebrain damage and cognitive deficits in Parkinson's disease. Mov Disord. 2019 Apr;34:516-525.
- Zang YF, He Y, Zhu CZ, Cao QJ, Sui MQ, Liang M, et al. Altered baseline brain activity in children with ADHD revealed by resting-state functional MRI. Brain Dev. 2007 Mar;29:83-91.
- Zou QH, Zhu CZ, Yang Y, Zuo XN, Long XY, Cao QJ, et al. An improved approach to detection of amplitude of low-frequency fluctuation (ALFF) for resting-state fMRI: fractional ALFF. J Neurosci Methods. 2008 Jul 15;172:137-141.
- Zang Y, Jiang T, Lu Y, He Y, Tian L. Regional homogeneity approach to fMRI data analysis. Neuroimage. 2004 May;22:394-400.
- David O, Blauwblomme T, Job AS, Chabardès S, Hoffmann D, Minotti L, et al. Imaging the seizure onset zone with stereo-electroencephalography. Brain. 2011 Oct;134:2898-2911.
Figures

Table 1. Patient Demographics.
Abbreviation: L, left; R, right; HIP,hippocampus; AMYG, amygdala; SMG, supramarginal; MTL middletemporal lobe; STL, superiortemporal lobe; OL, occipital lobe; PL, parietal lobe.