2962
Early disturbance of dynamic synchronization and neurovascular coupling in cognitively normal Parkinson’s disease: an integrated MRI study1Nanjing First Hospital, Nanjing Medical University, Nanjing, China, 2GE Healthcare, MR Research China, Beijing, China, 3Clinical Medical College, Yangzhou University, Yangzhou, China
Synopsis
For Parkinson’s disease (PD), the time-varying properties of functional coherence and their coupling to regional perfusion are rarely elucidated. We aimed to investigate early disruption of dynamic regional homogeneity (dReho) pattern and neurovascular coupling (NC) in PD patients before onset of cognitive impairment and their classification performance. PD patients at early stage exhibited an impaired dynamic pattern of neuronal synchronization and disrupted NC. The features of CBF/dReho provided robust performance in differentiating PD from healthy controls. With this findings, the insights into early pathophysiological mechanism underlying PD from regional dynamic pattern and NC were reinforced.
Introduction
Pathological process in Parkinson’s disease (PD) is accompanied with functional and metabolic alterations. Recent PD investigations have focused on dynamic functional connectivity patterns and large-scale networks1, 2. However, studies are lacking on temporal signature of regional neural activity. Although neural substrates theoretically influence neurovascular coupling as vasoactive mediators in PD, the union of information from neuronal activity and cerebral perfusion needs further investigation to depict the dysregulating mechanism in PD with comprehensive in vivo insights. Consequently, by enrolling PD patients in early-stage with normal global cognition, the current study thus aimed to investigate the time-varying synchrony of regional neuronal activity captured from dynamic regional homogeneity (dReHo) and further detect neurovascular coupling at whole GM and regional level.Materials and Methods
SubjectsA final sample consisted of 62 (35 male and 27 female) patients with PD, and 60 (30 male and 30 female) matched healthy controls (HCs) were recruited. The Unified Parkinson’s Disease Rating Scale part III (UPDRS-III) and Hoehn-Yahr (H-Y) scale were scored for disease severity and stage of PD.
MRI experiment
MRI experiments were performed using a 3.0-tesla MRI scanner (Discovery MR750, GE, USA) with an 8-channel phased array head coil. Resting-state functional MRI data of the whole brain were acquired as follows: TR, 2,000 ms; TE, 30 ms; FA, 90°; slice thickness, 4 mm without gap; FOV, 240 × 240 mm2; matrix size, 64 × 64; voxel size, 4.0 × 4.0 × 4.0 mm3; 240 time points; total scan time, 480 s. 3D pseudo-continuous arterial-spin-labeling (ASL) sequence with the following parameters was applied: TR 10.5 ms, TE 4.9 ms, FA 111°, slice thickness 4 mm without gap, FOV 240 × 240 mm2, matrix size 128 × 128, post-label-delay 2025 ms, NEX 3, 36 slices. Total scan time was 284 s.
Data analysis
Functional and perfusion data were preprocessed in SPM 12 embedded in the MATLAB 2018a platform. dReho was processed by Dynamic Brain Connectome toolbox on the theory of sliding window approach3. Neurovascular coupling was quantitatively assessed by calculating the correlation coefficient between the z-ReHo map and z-CBF map across voxels at the whole-brain grey matter (GM) level. Regional neurovascular coupling was further analyzed by dividing the whole-brain GM into 90 independent functional sub-regions based on the automated anatomical labeling atlas. In addition, CBF/ReHo ratios across voxels within the GM mask were calculated with the original values of the metrics.
Statistical analysis
Mann-Whitney U test was applied for the comparisons between two groups in scores of clinical scales. The differences of correlation coefficients between two groups were compared using independent-samples T test. SPSS 19.0 software was utilized and P value < 0.05 was defined as statistically significance. The inter-group differences of metrics were analyzed in a voxel-wise manner within GM mask by using SPM 12 software and assessed with a cluster-defining threshold of P < 0.001 and a following familywise error (FWE) corrected cluster significance of P < 0.05. Spearman correlation test using SPSS 19.0 software was applied to explore the potential associations between cluster values and clinical assessments. The classification performances of aberrant metrics in distinguishing PD patients from HC subjects were identified by step-wised multivariate pattern analysis4.
Results
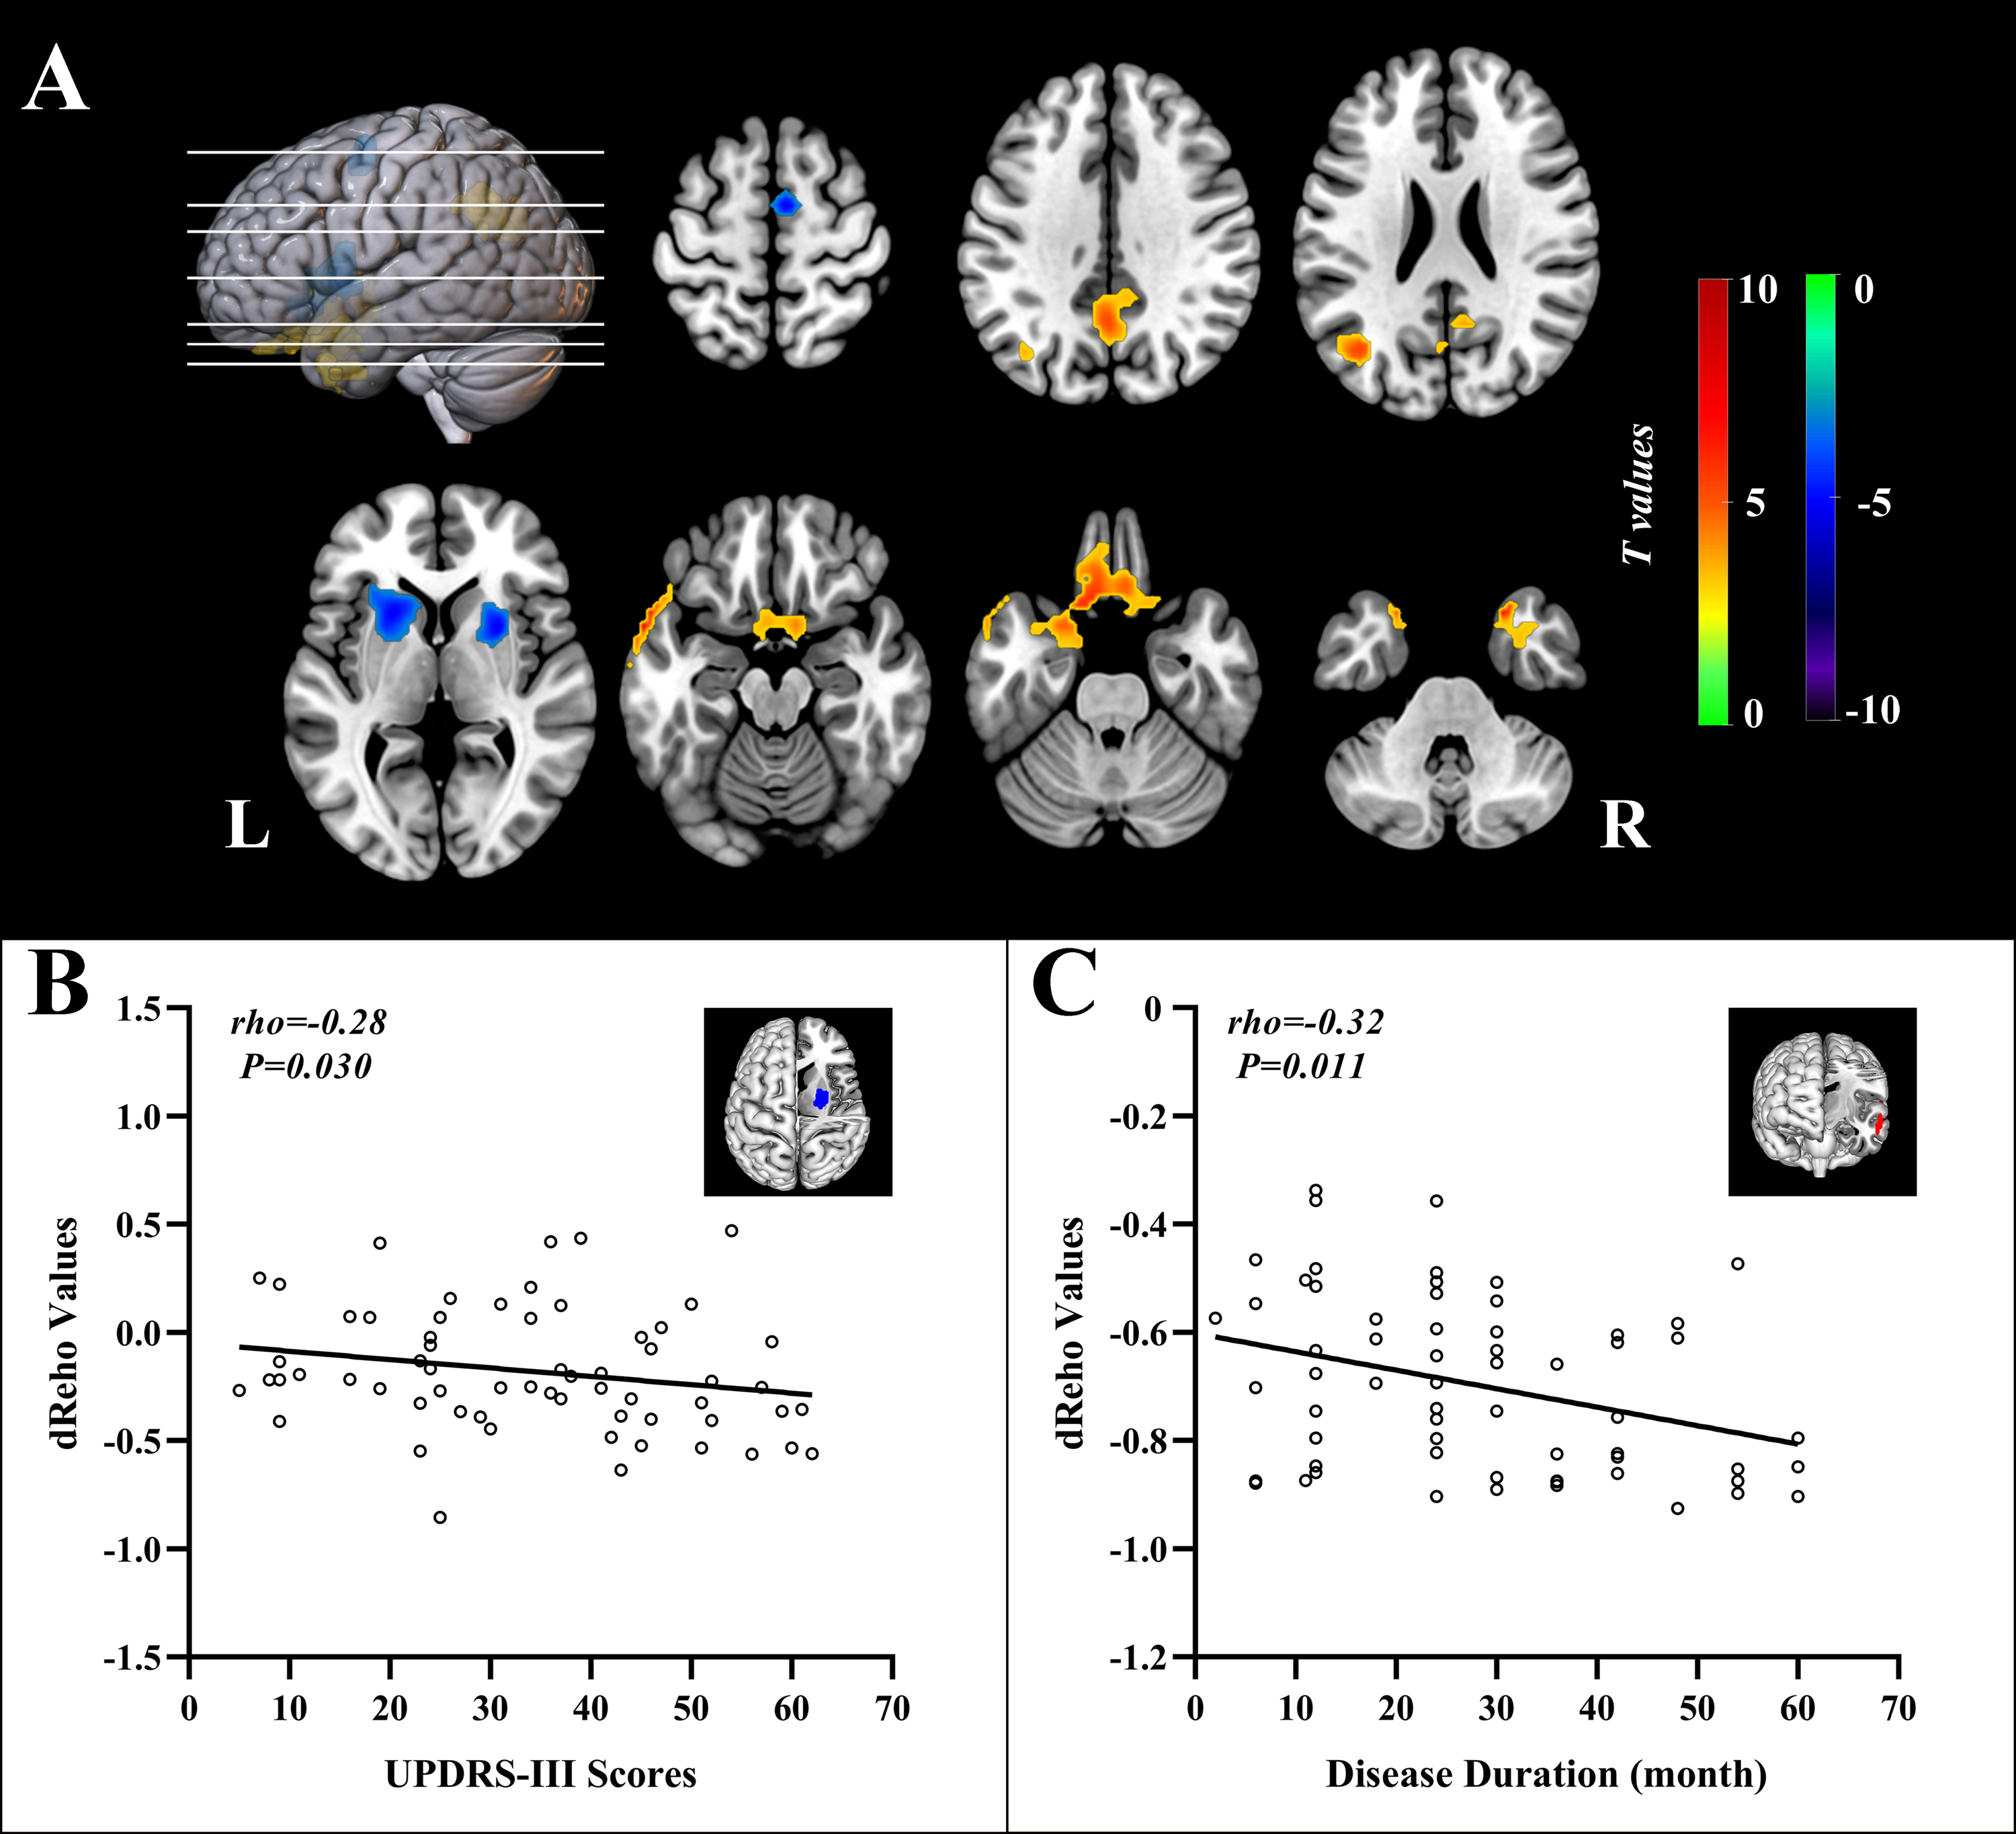
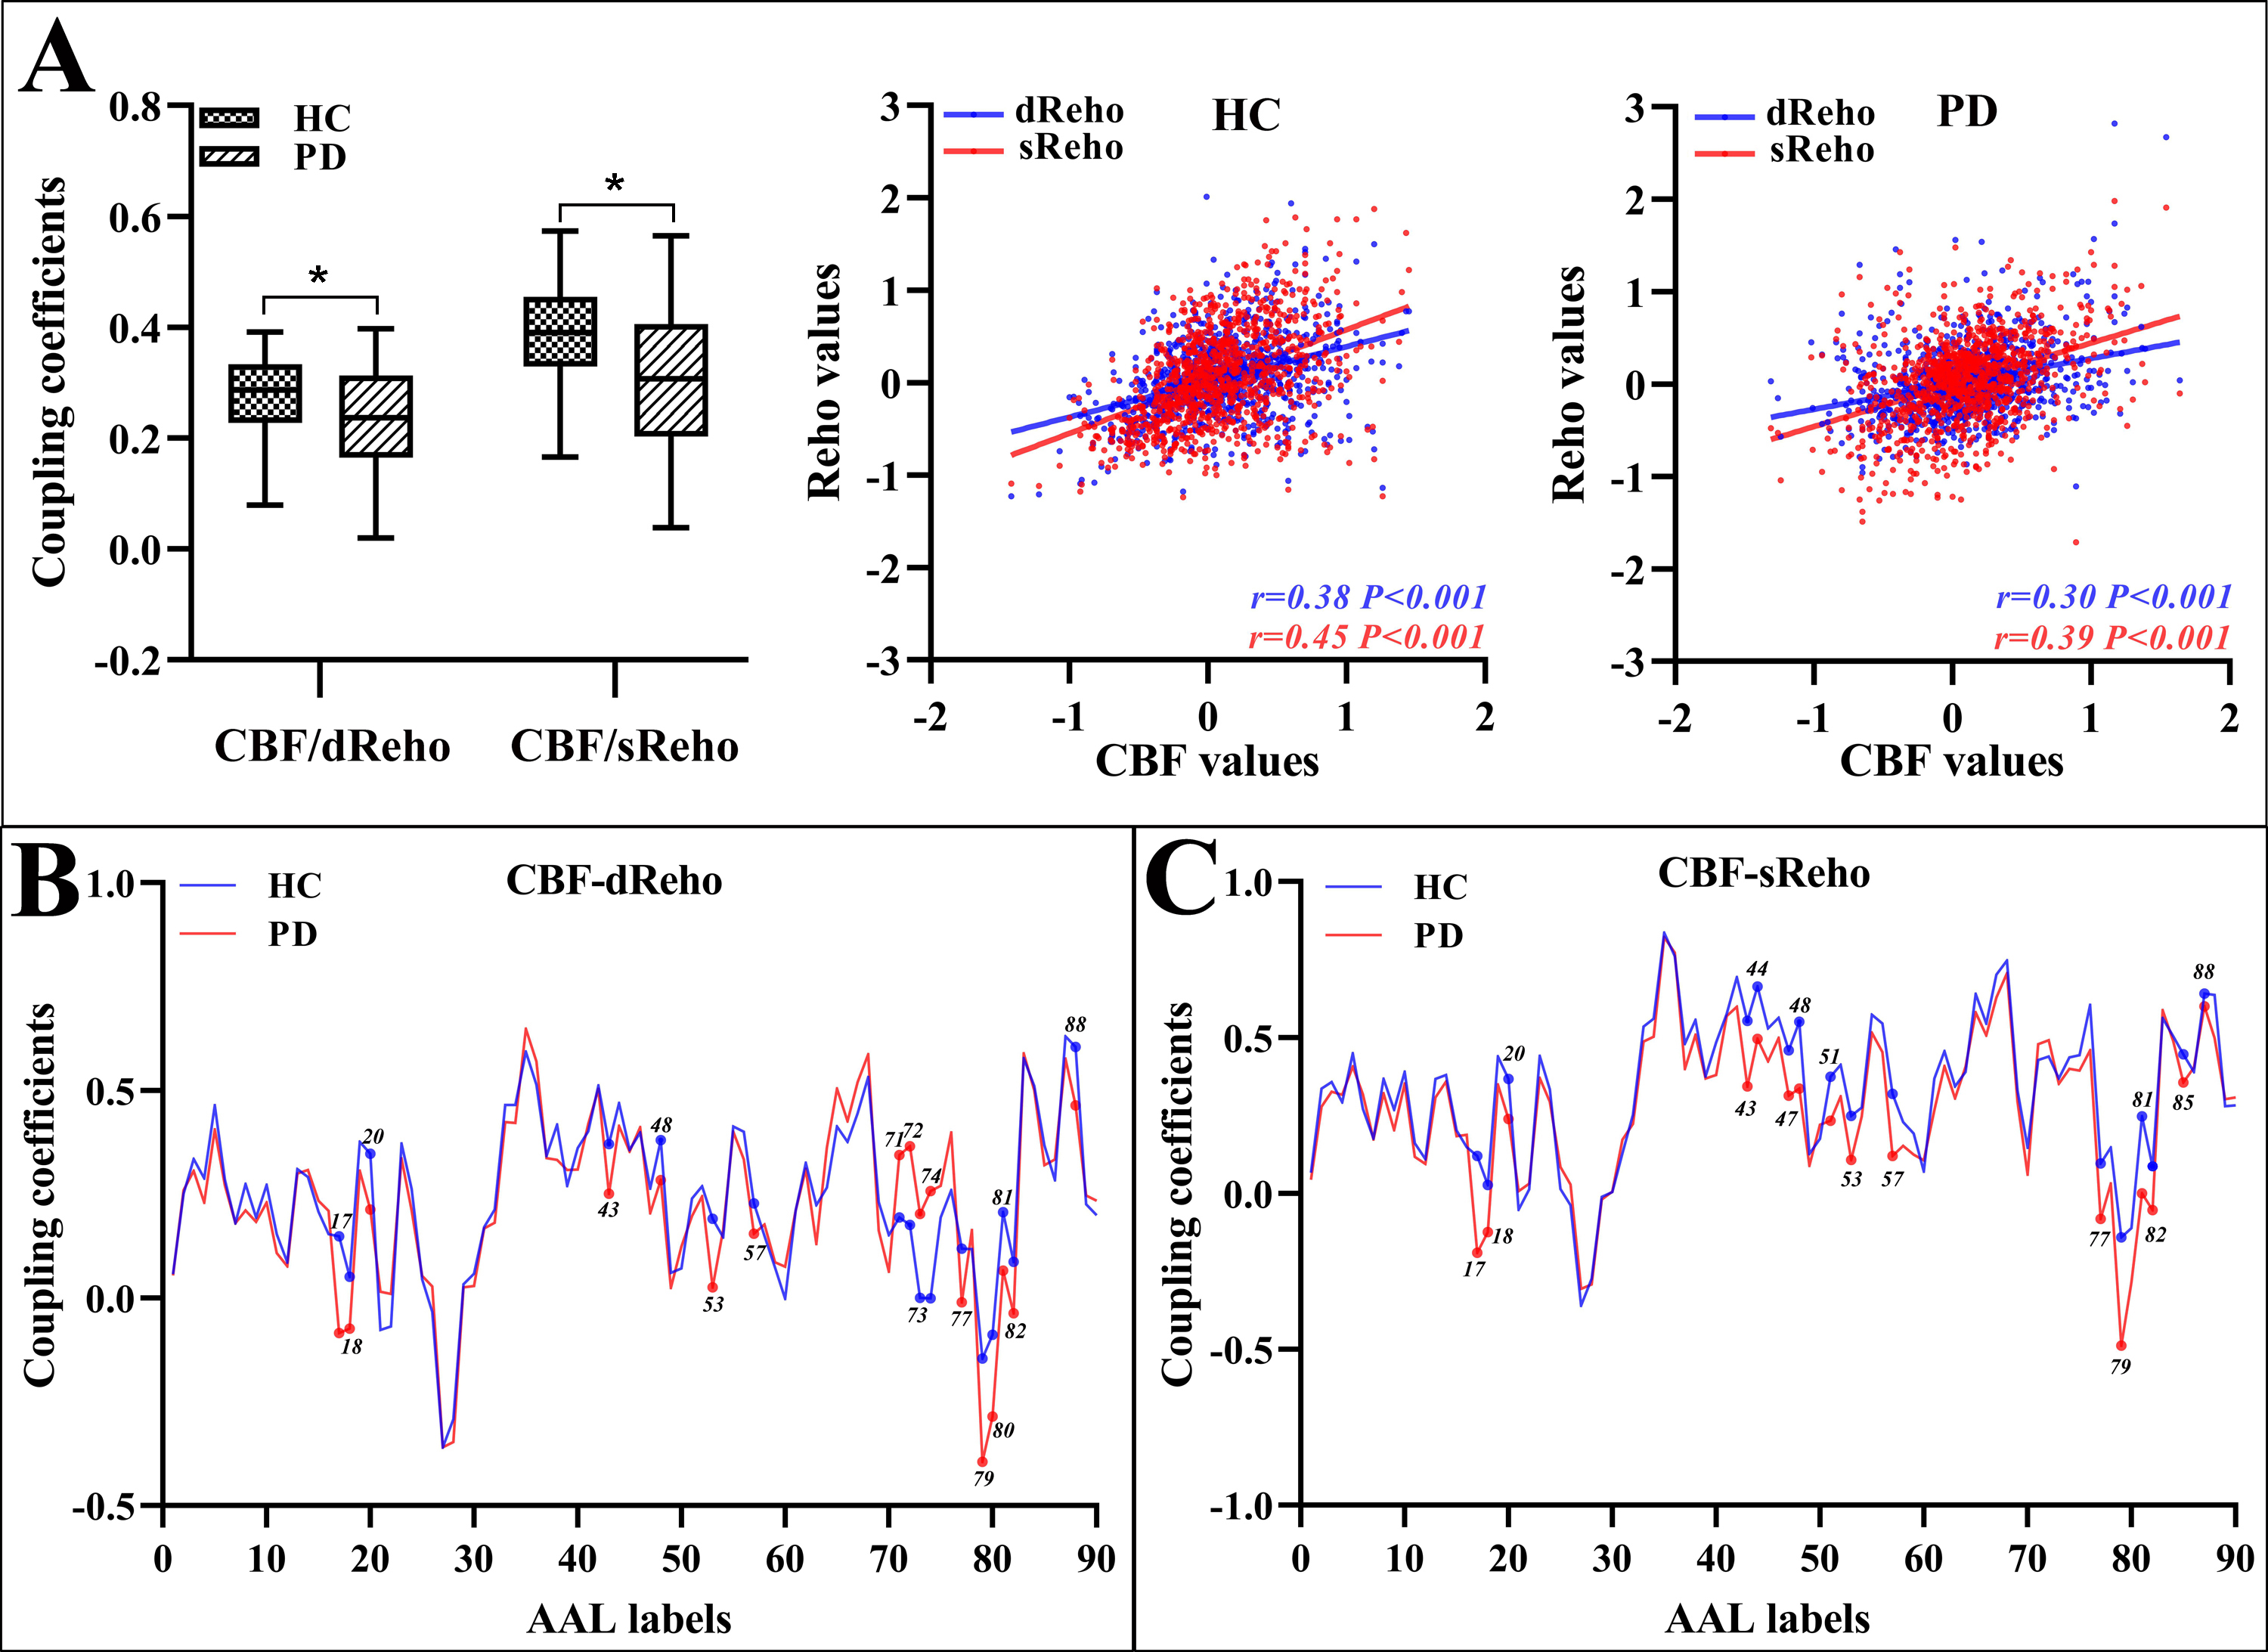
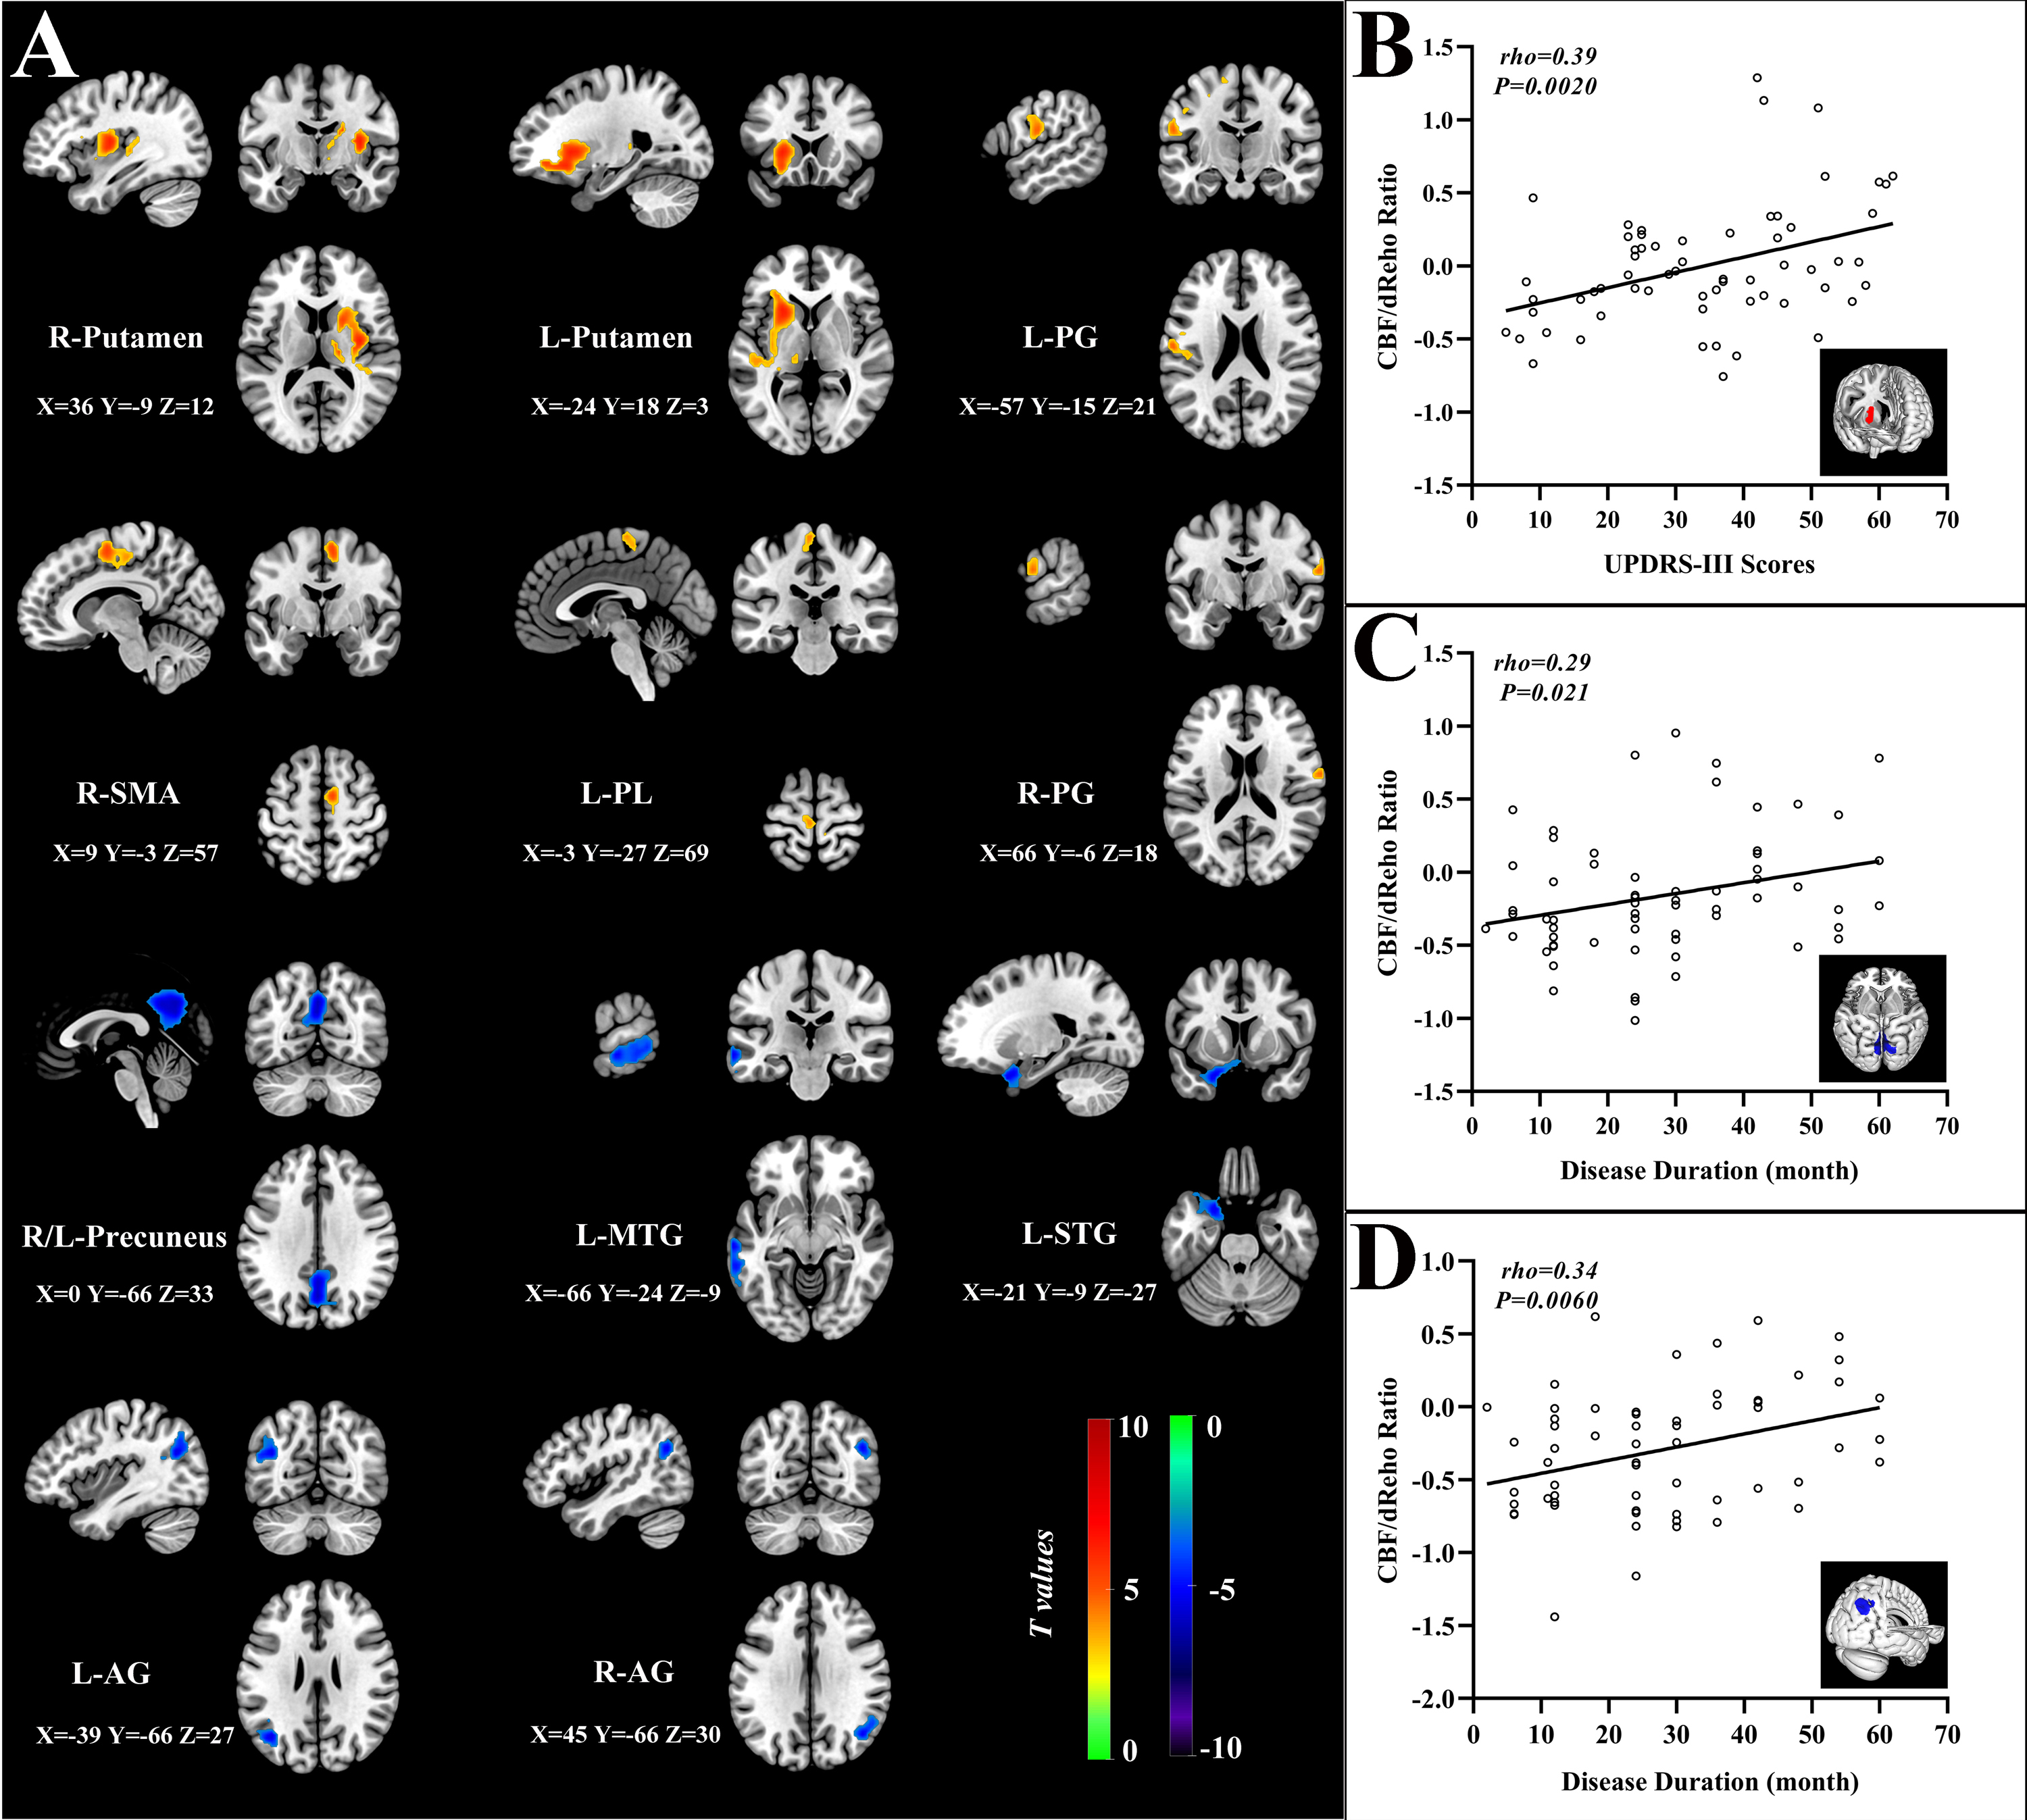
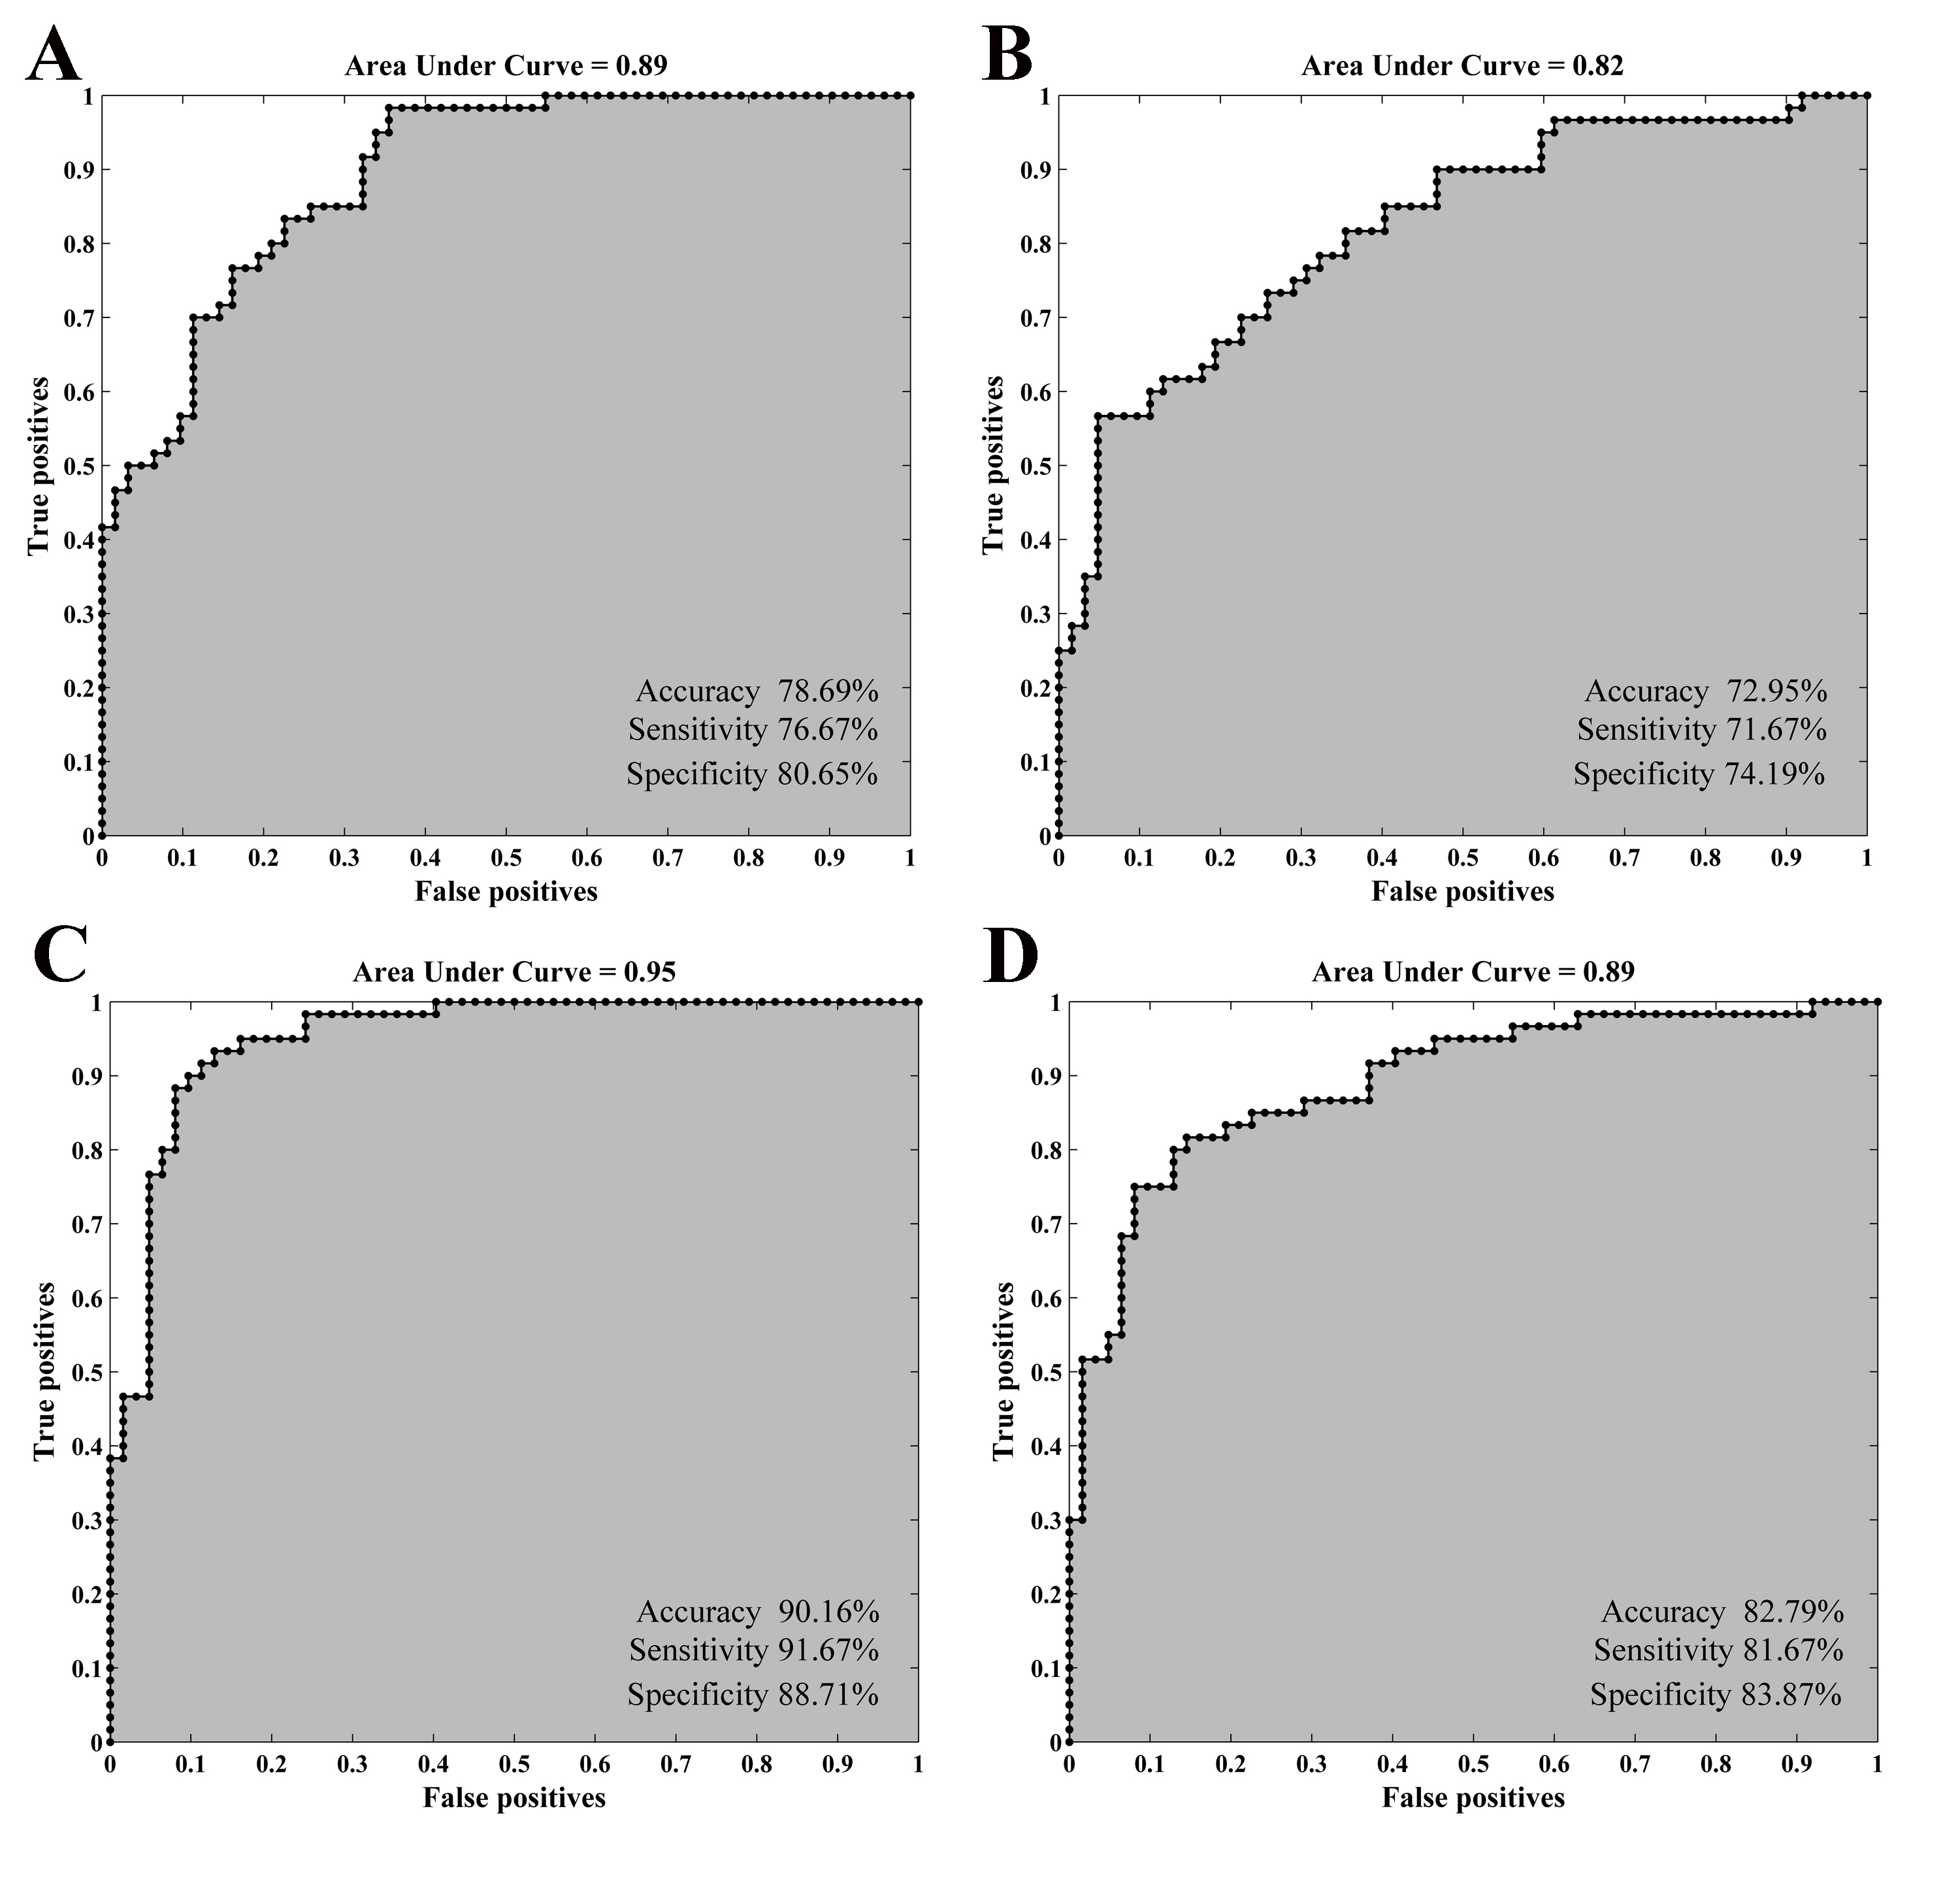
Relative to HC subjects, statistically higher dReho variability in PD patients were distributed in bilateral middle temporal gyrus (MTG), left rectus gyrus, left middle occipital gyrus, and left precuneus. Their statistically lower dReho variability was found in bilateral putamen and right supplementary motor area (SMA) (Fig.1). PD patients had significantly reduced global coupling of CBF-dReHo and CBF-sReHo compared with HC subjects. Significant intergroup differences of regional correlations were found with downstream trend in thalamus, motor and somatosensory cortex, and temporal and occipital cortex. Meanwhile, upregulated correlations in striatum regions were observed in regional CBF-dReHo analysis (Fig.2). For PD patients, statistical differences were found for higher CBF/dReho ratio in bilateral putamen, bilateral PG, right SMA, and left paracentral lobule (PL) and lower CBF/dReho ratio in left superior temporal gyrus (STG), left MTG, bilateral precuneus, and bilateral angular gyrus (AG). The ratios in right putamen were significantly linked to UPDRS-Ⅲ scores. The ratios in right AG and precuneus were significantly linked to disease duration (Fig.3). With the statistically different Reho values as features, the clustering results revealed the superiority of dReho over sReho. Classification analysis also showed that CBF/Reho ratio features were better than any separated metrics of Reho and CBF. The features of CBF/dReho ratio achieved more powerful performance than those of CBF/sReho ratio (Fig.4).Discussion and conclusion
PD patients at early stage exhibit an impaired dynamic pattern of neuronal synchronization and disrupted neurovascular coupling before the onset of global cognitive impairment. These conditions are characteristically linked to motor dysfunction and disease duration. With the integrated blood oxygen level-dependent and ASL approaches, the features of CBF/Reho achieved powerful classification performance with improved accuracy for differentiating PD patients from HC subjects. In conclusion, this research provided a new avenue to probe into the early functional abnormalities in PD, thus emphasizing the importance of temporal features in complementally investigating pathophysiological processes and the potential role of neurovascular decoupling on the neurodegenerative mechanism underlying PD.Acknowledgements
No acknowledgement found.References
1. Zhu H, Huang J, Deng L et al. Abnormal Dynamic Functional Connectivity Associated With Subcortical Networks in Parkinson's Disease: A Temporal Variability Perspective. Front Neurosci 2019;13:80.
2. Gan C, Ma K, Wang L et al. Dynamic functional connectivity changes in Parkinson's disease patients with REM sleep behavior disorder. Brain Res 2021;1764:147477.
3. Liao W, Wu GR, Xu Q et al. DynamicBC: a MATLAB toolbox for dynamic brain connectome analysis. Brain Connect 2014;4:780-790.
4. Cui Q, Sheng W, Chen Y et al. Dynamic changes of amplitude of low-frequency fluctuations in patients with generalized anxiety disorder. Hum Brain Mapp 2020;41:1667-1676.
Figures