2961
Optimization of TE and Postprocessing for Nigrosome-1 Imaging using Wave-CAIPI Susceptibility Weighted Imaging at 3T1MR Application Development, Siemens Shenzhen Magnetic Resonance Ltd., Shenzhen, China, 2Department of Radiology, Ruijin Hospital, Shanghai Jiao Tong University School of Medicine, Shanghai, China, 3MR Collaborations, Siemens Healthineers Ltd., Shanghai, China, 4MR Application Predevelopment, Siemens Healthcare GmbH, Erlangen, Germany, 5Department of Radiology, Wayne State University, Detroit, MI, United States
Synopsis
In this work, Wave-CAIPI accelerated 3D SWI has been used to achieve whole brain imaging in about 3min 30s. Both short-TE and long-TE protocols were compared for the detection of the Nigrosome-1(N1) sign. The phase-mask formula and number of phase mask multiplications were adjusted to explorer their influence on the contrast-to-noise (CNR) of the N1 sign relative to adjacent tissues. The result showed that long-TE protocol had better CNR and made it easier to recognize the N1 sign. The adjusted phase-mask formula with an increased number of phase mask multiplications also helped to improve the CNR of the N1 sign.
Introduction
MRI plays an important role in studying Parkinson’s disease (PD) [1]. Recent evidence suggests that the disappearance of the Nigrosome-1(N1) sign reflects an early change of dopamine neuronal cell density and an increase in local iron deposition [2-3]. Several variants based on SWI [4] have been proposed and showed their ability to detect the N1 sign [5-6]. However, the scan time of the conventional 3D GRE acquisition accelerated with the usual GRAPPA or SENSE techniques is still rather long, making them sensitive to head movement. Wave-CAIPI has been proposed for accelerated 3D imaging by factors of 4-8 in practical situations [7]. In this study, we applied Wave-CAIPI to 1) accelerate the acquisition of 3D SWI images by a factor of 4, 2) study the impact of echo time (TE) on the visualization of the N1 sign and 3) optimize the conventional SWI processing to enhance the contrast of the N1 sign to the adjacent tissues.Methods
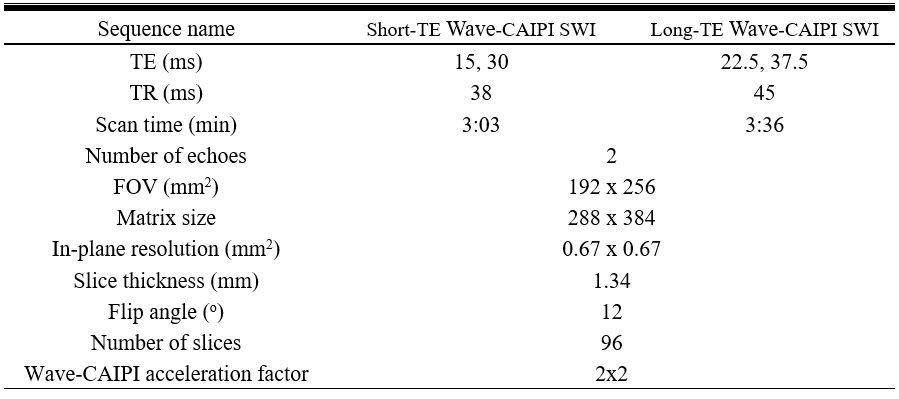
Nine volunteers were enrolled and underwent head MRI on a 3T system (MAGNETOM Prisma; Siemens Healthcare, Erlangen, Siemens) with a 64-channel head-neck receiver coil. The prototype 2-echo 3D GRE sequence with a Wave-CAIPI acceleration factor of 2x2 was performed twice with short and long TE sets respectively. Other imaging parameters have been listed in table 1. The combination of the 2 echoes, along with the resulting magnitude and filtered phase and the default SWI processing were all performed inline.As the first step after all data were collected, the N1 sign was identified visually for each case on both short-TE and long-TE default SWI and their visibility was compared. In the 2nd step, one case with a clear N1 sign on the default SWI was selected for the postprocessing optimization. The combined-echo magnitude and the filtered phase images were imported to an in-house developed program based on MATLAB (MathWorks, Natick, MA, USA) for offline SWI processing. Based on the mask formula proposed by Haacke et al [4], we introduced a Δφ to the denominator and generated an adapted mask formula: $$f(x) = \begin{cases} \frac{\varphi (x)}{1+ \Delta \varphi }, & 0<\varphi (x)<1+\Delta \varphi \\ 1, & otherwise \\ \end{cases}$$ where φ(x) is the normalized phase value ranging from 0 to 2, calculated from the filtered phase images (range: -π~π). To generate the offline SWI images, the mask was multiplied into the magnitude by m times [4]. Firstly, a series of Δφ (-0.1~0.1, step: 0.01) and a constant m=4 were applied to create a series of SWI datasets. The contrast-noise-ratio (CNR) was calculated using CNR=(IN1-ISN)/std(WM) for each SWI dataset, where IN1 and ISN are the signal intensity of the N1 and its surrounding substantia nigra (SN) tissue respectively, std(WM) is the signal standard deviation from a regions-of-interest (ROI) drawn in a uniform area of white matter. Then the CNR-Δφ curve was generated. In the third step, the Δφ providing the highest CNR in the 2nd step together with a series of m (1~10, step: 1) were applied to generate another series of SWI datasets. The CNR of the N1 in these datasets was calculated to generate the CNR-m curve.
Results
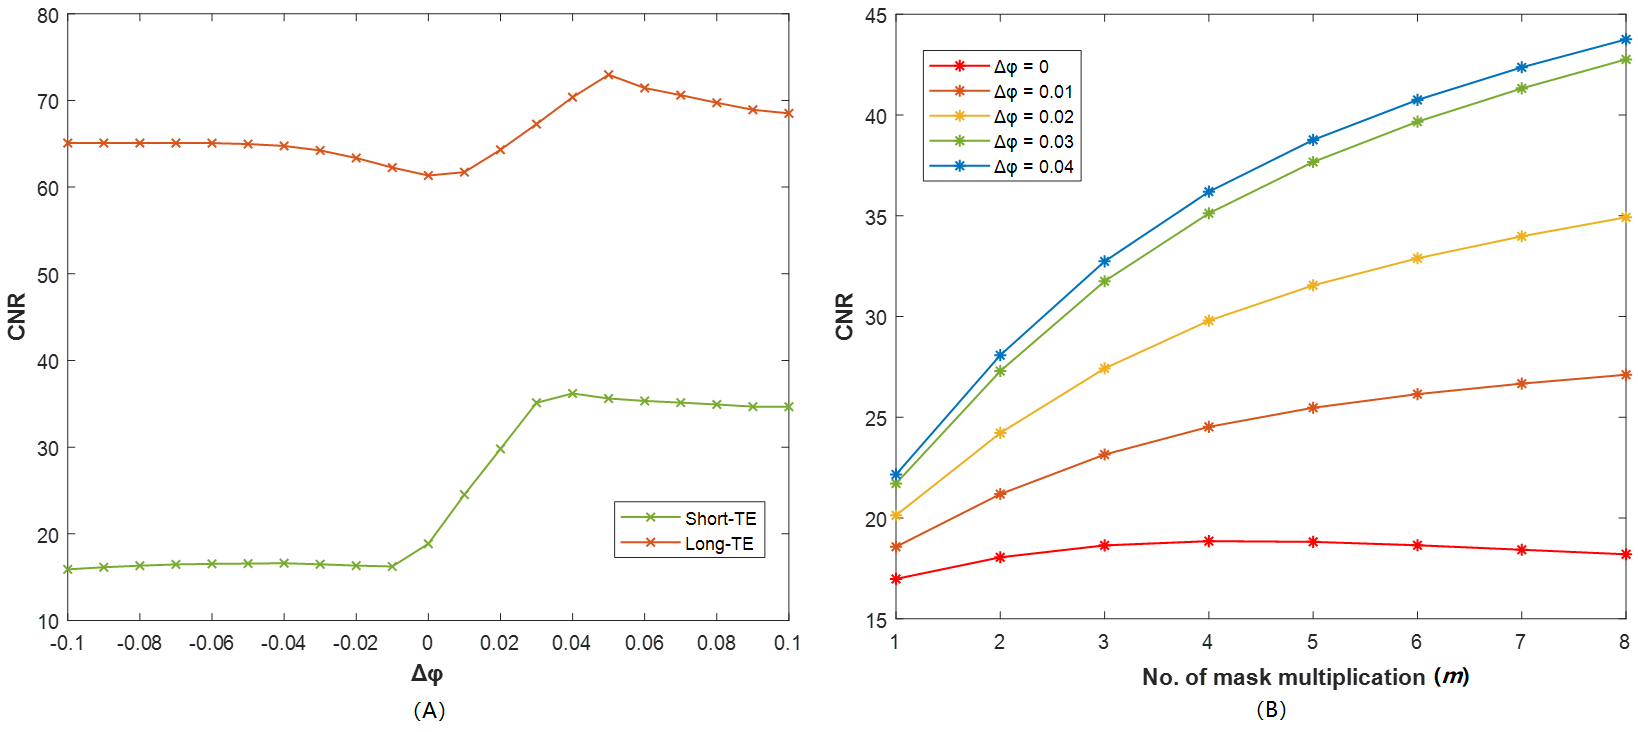
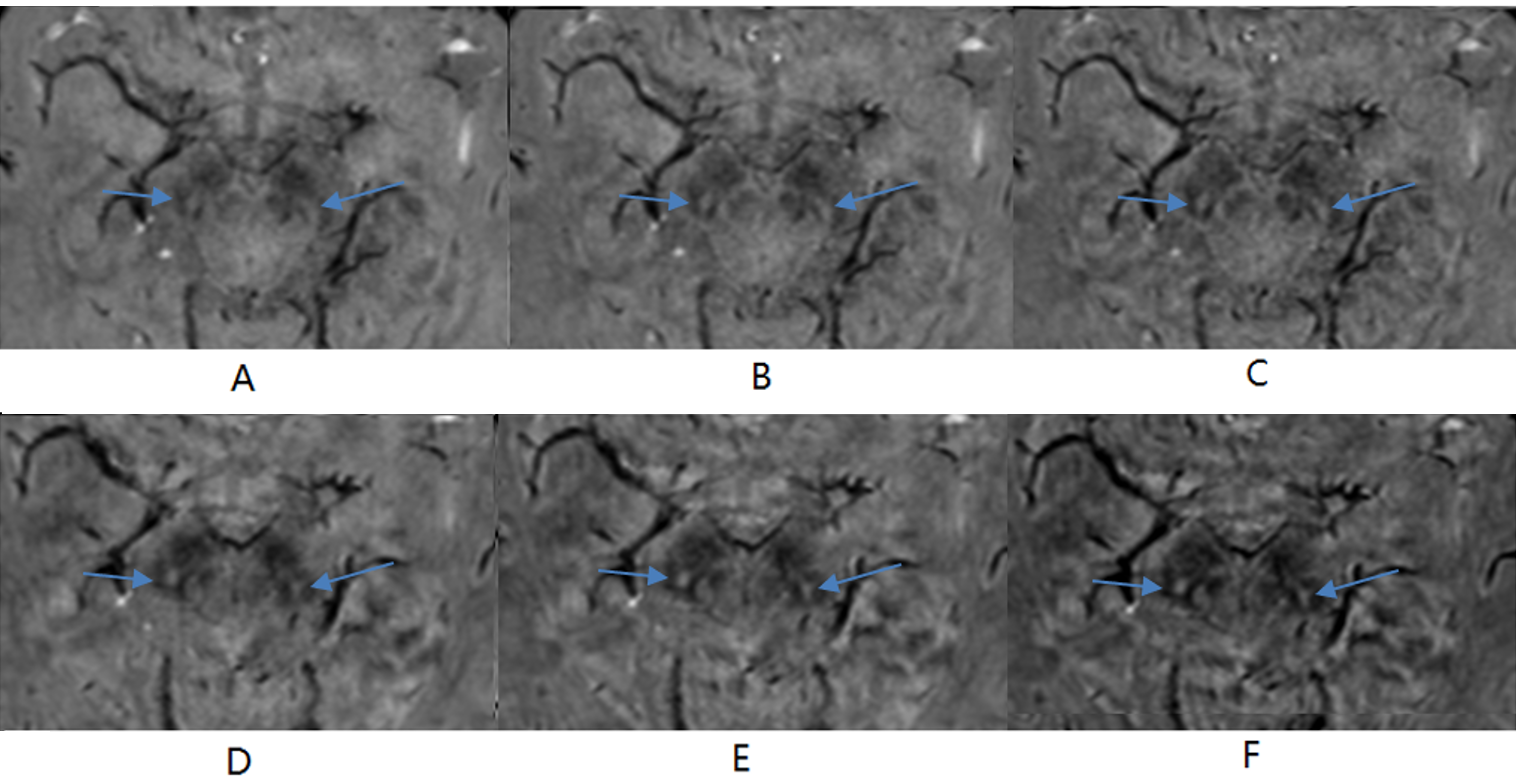
Of the 9 cases, one was excluded due to motion artifacts. For the remaining 8 cases (5 males and 3 females, mean age 52.3 years; age range 44-66 years), the N1 sign could be identified in 5 cases on the short-TE default SWI, while it could be seen for all 8 cases on the long-TE default SWI. Fig.1 illustrates the CNR-Δφ curve (1A) of a short-TE and the corresponding long-TE dataset, and the CNR-m curve (1B) of the short-TE dataset. Fig.1A demonstrates that, with m=4, the CNR of the N1 sign reaches the highest value at Δφ=0.04 for short-TE SWI and at Δφ=0.05 for the long TE. While Fig.1B shows the CNR increases with m for Δφ=0.01,0.02, 0.03 and 0.04 respectively. Fig.2 shows some exemplar SWI images for a 52-year-old healthy volunteer generated with the different settings. The N1 appears clearer on the long-TE SWI than on the short TE when Fig.2A and Fig.2D are compared. Using Δφ=0.04 with m=4 (Fig.2B, 2E) and m=6 (Fig.2C, 2F) improved the CNR for the N1 relative to the SN tissue.Discussion and Conclusion
We applied the Wave-CAIPI technique to whole brain 3D SWI in about 3min30s. We demonstrated that long-TE Wave-CAIPI SWI detected the N1 clearer than the short TE for all cases. By adjusting the phase-mask formula of the conventional SWI, and increasing the number of the mask multiplications, we could enhance the contrast of the N1 to the SN. However, although the CNR of the N1 continuously increased with the number of the mask multiplications according to Fig.1B, an m=4 appears to have the best visualization of the entire image for the long TE and an m of 4-6 for the short-TE dataset since a higher number of the mask multiplications decreases the overall SNR of the SWI images, which can degrade the visibility of other objects of interest, such as veins for example. In conclusion, Wave-CAIPI SWI with a long average TE of 30ms and/or adjusted phase mask help to improve the visibility and recognition of the N1 sign.Acknowledgements
No acknowledgement found.References
[1] Stoessl AJ, Lehericy S, Strafella AP. Imaging insights into basal ganglia function, Parkinson's disease, and dystonia. Lancet. 2014 Aug 9;384(9942):532-44. doi: 10.1016/S0140-6736(14)60041-6.
[2] Blazejewska AI, Schwarz ST, Pitiot A, Stephenson MC, Lowe J, Bajaj N, Bowtell RW, Auer DP, Gowland PA. Visualization of nigrosome 1 and its loss in PD: pathoanatomical correlation and in vivo 7 T MRI. Neurology. 2013 Aug 6;81(6):534-40. doi: 10.1212/WNL.0b013e31829e6fd2.
[3] Schwarz ST, Mougin O, Xing Y, Blazejewska A, Bajaj N, Auer DP, Gowland P. Parkinson's disease related signal change in the nigrosomes 1-5 and the substantia nigra using T2* weighted 7T MRI. Neuroimage Clin. 2018 May 24;19:683-689. doi: 10.1016/j.nicl.2018.05.027.
[4]. Haacke EM, Xu Y, Cheng YC, Reichenbach JR (2004) Susceptibility weighted imaging (SWI). Magn Reson Med 52:612618.
[5] Nam Y, Gho SM, Kim DH, Kim EY, Lee J. Imaging of nigrosome 1 in substantia nigra at 3T using multiecho susceptibility map-weighted imaging (SMWI). J Magn Reson Imaging. 2017 Aug;46(2):528-536. doi: 10.1002/jmri.25553.
[6] Cheng Z, He N, Huang P, Li Y, Tang R, Sethi SK, Ghassaban K, Yerramsetty KK, Palutla VK, Chen S, Yan F, Haacke EM. Imaging the Nigrosome 1 in the substantia nigra using susceptibility weighted imaging and quantitative susceptibility mapping: An application to Parkinson's disease. Neuroimage Clin. 2020;25:102103. doi: 10.1016/j.nicl.2019.102103.
[7] Bilgic B, Gagoski BA, Cauley SF, Fan AP, Polimeni JR, Grant PE, Wald LL, Setsompop K. Wave-CAIPI for highly accelerated 3D imaging. Magn Reson Med. 2015 Jun;73(6):2152-62. doi: 10.1002/mrm.25347.
Figures