2960
Parkinson’s disease state modulates the effect of nigral iron deposition on the large-scale brain networks.1Department of Radiology, The Second Affiliated Hospital, Zhejiang University School of Medicine, Hangzhou, China, 2GE Healthcare, Shanghai, China, Shanghai, China, 3Department of Neurology, The Second Affiliated Hospital, Zhejiang University School of Medicine, Hangzhou, China
Synopsis
In Parkinson’s disease (PD), nigral iron deposition exacerbates a-synuclein aggregation. In our study, we divided PD and normal controls (NC) into high iron group and normal iron group according to the median of nigral magnetic susceptibility of NC, respectively. ICA method was applied to separate brain large-scale networks. The PD*iron interaction effect on brain functional networks were investigated by mixed effect analysis. We found that PD disease status specifically moderates the effect of nigral iron deposition on the function of some regions in BGN and VN, which partially mediates the relationship between nigral iron deposition and disease severity.
Introduction
Parkinson's disease (PD) is one of the most common neurodegenerative diseases1. The death of dopaminergic neurons in the substantia nigra (SN) and aberrant aggregation of α-synuclein are the core pathological changes of PD2,3. Iron deposition in the substantia nigra (SN) exacerbates oxidative stress and a-synuclein aggregation, leading to neuronal death in PD4,5. Our aim was to investigate whether PD disease status modulates the effect of nigral iron deposition on brain function using multimodal magnetic resonance.Methods
85 PD patients and 140 normal controls (NC) underwent structural T1 magnetic resonance imaging, resting-state functional magnetic resonance imaging and susceptibility weighted imaging scans, as well as motor and non-motor symptoms assessments. According to the median of nigral magnetic susceptibility of NC (0.191ppm), PD and NC were divided into high iron group and normal iron group, respectively. And then ICA method was applied to separate brain large-scale networks.The specific effects of nigral iron deposition on the brain functional networks in PD were investigated by voxel-based interaction analysis.Results
Mixed effect analysis: Disease* iron interaction effect on brain network functionBased on voxel-based mixed effect analysis, significant interaction effect of disease and nigral iron were observed in several networks: (1) BGN: left inferior frontal gyrus and left insular lobe (peak MNI coordinate: X = -41.5/-33.5, Y = 21.5/3.5, Z = -2.5/13.5; F = 15.8/16.5, respectively) (Figure 1A-B); (2) VN: right middle occipital gyrus, right superior temporal gyrus and bilateral cuneus (peak MNI coordinate: X = 42.5/66.5/4.5, Y = -86.5/-38.5/-82.5, Z = 11.5/13.5/33.5; F = 18.6/22.0/14.4, respectively) (Figure 1C-E).
Post hoc analysis about the FC of PD*iron interaction effect clusters in BGN and VN
Through further post-hoc analysis, we found that the FC of interaction effect brain cluster1 in BGN (left inferior frontal gyrus) in PD-SNhigh was higher than that in PD-SNnormal (P = 0.001), while the FC of these brain clusters were not significantly different between NC-SNhigh and NC-SNnormal (P = 0.396) (Figure 2A). And the FC of interaction effect brain cluster2 in BGN (left insular lobe) in PD-SNhigh was lower than that in PD-SNnormal (P = 0.001), while the FC of these brain clusters was not significantly different between NC-SNhigh and NC-SNnormal (P = 0.227) (Figure 2B). Furthermore, the FC of clusters with significant interaction effect in VN was increased in PD-SNhigh compared with PD-SNnormal (P = 0.001), while that was decreased in NC-SNhigh compared with NC-SNnormal (P < 0.001) (Figure 2C).
Correlations between nigral iron content, network function, and UPDRS II score
Through partial correlation analysis (controlling for gender, age, and education), nigral iron content was significantly positively correlated with UPDRS Ⅱ score in PD (r = 0.366; P = 0.001) (Figure 3D). For BGN, nigral iron content was significantly negatively correlated with the FC of interaction effect brain cluster 2 in BGN (left insular lobe) (r = -0.301; P = 0.006) (Figure 3A), and the FC of interaction effect brain cluster 2 in BGN was negatively correlated with UPDRS Ⅱ score (r = -0.223; P = 0.044) (Figure 3E). For VN, nigral iron content was significantly positively correlated with the FC of interaction effect brain clusters in VN (r = 0.272; P = 0.013) (Figure 3B). Furthermore, there was a significant negative correlation between the FC of interaction effect brain clusters in BGN and VN in PD patients (r = -0.320; P = 0.003) (Figure 3C).
Multiple mediating effect of FC of interaction effect clusters on the relationship between nigral iron and UPDRS Ⅱ score
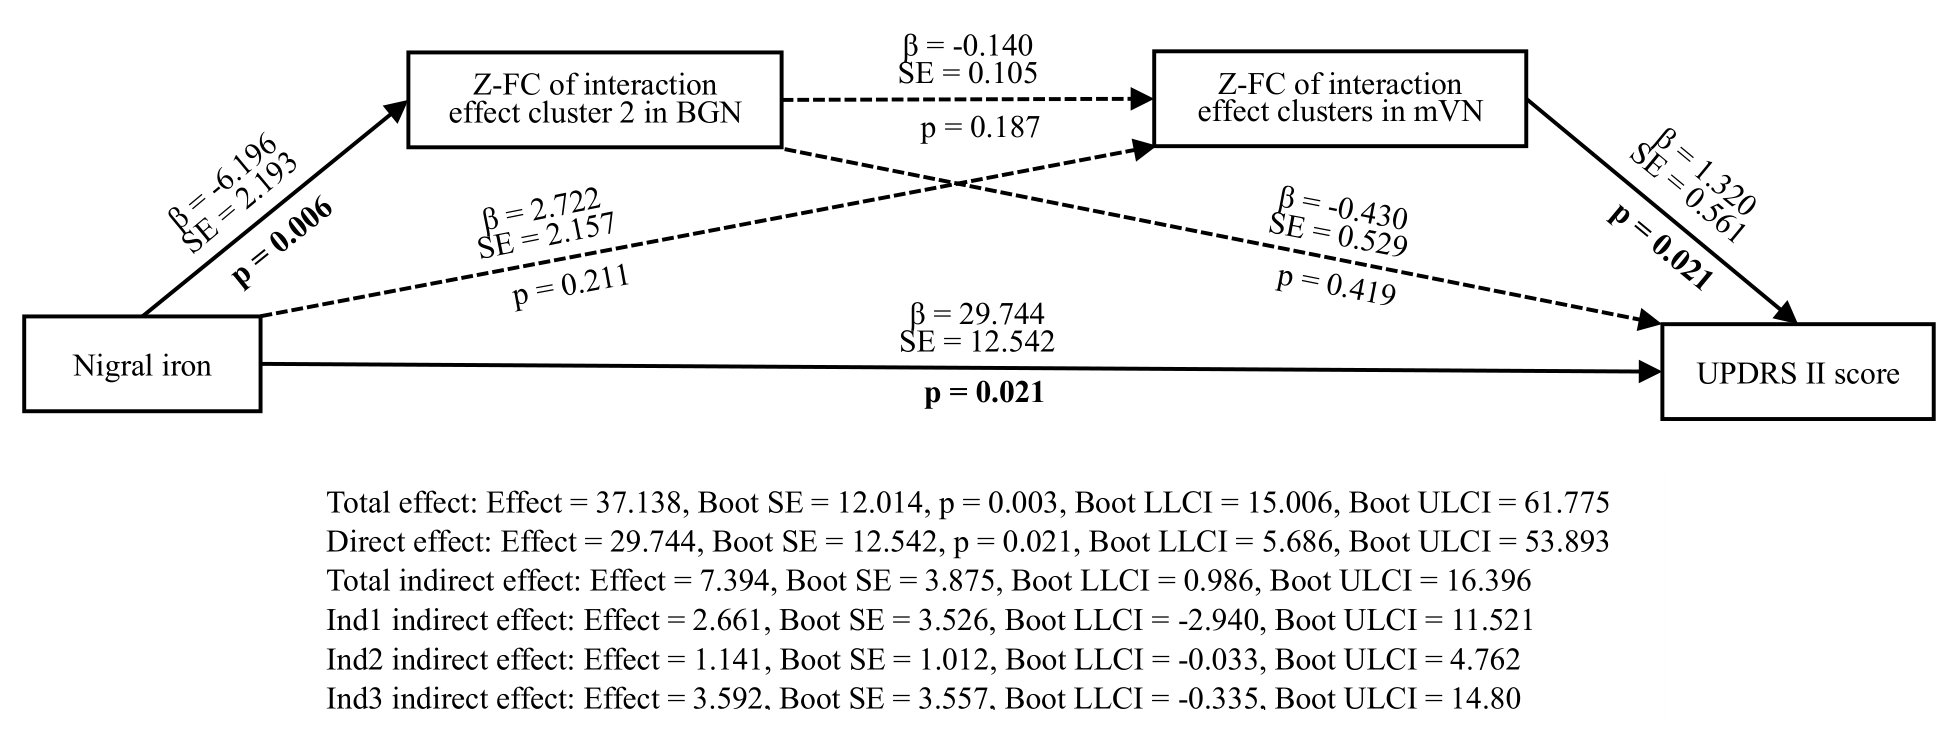
Multiple mediating analysis revealed that the FC of interaction effect clusters in BGN and mVN partially mediated the association between nigral iron content and UPDRS Ⅱ score (Total indirect effect: Effect = 7.394, Boot SE = 3.875, Boot LLCI = 0.986, Boot ULCI = 16.396). In other words, under separate conditions, neither the FC of interaction effect brain clusters in BGN nor mVN mediated the relationship between nigral iron and UPDRS Ⅱ score (Ind1 indirect effect: Effect = 2.661, Boot SE = 3.526, Boot LLCI = -2.940, Boot ULCI = 11.521; Ind2 indirect effect: Effect = 1.141, Boot SE = 1.012, Boot LLCI = -0.033, Boot ULCI = 4.762, respectively). And the direct effect was significant (Direct effect: Effect = 29.744, Boot SE = 12.542, p = 0.021, Boot LLCI = 5.686, Boot ULCI = 53.893), which indicated that nigral iron deposition could cause disease to worsen directly. Moreover, the FC of interaction effect clusters in BGN and mVN did not serve as chain mediators for the relationship between nigral iron and UPDRS Ⅱ score (Ind3 indirect effect: Effect = 3.592, Boot SE = 3.557, Boot LLCI = -0.335, Boot ULCI = 14.80). This suggested that FC of BGN and mVN play an important role in mediating between nigral iron deposition and disease severity, and neither was indispensable. (Figure 4)
Conclusion
PD disease status specifically moderates the effect of nigral iron deposition on the function of some brain regions in BGN and VN, which partially mediates the relationship between nigral iron deposition and disease severity. Our study provides imaging basis for understanding circuit mechanism of the occurrence and development of PD related to nigral iron deposition.Acknowledgements
We wish to thank all the participants including patients with Parkinson’s disease and normal volunteers. We also thank the assistance from Department of Neurology in the Second Affiliated Hospital of Zhejiang University School of Medicine.References
1. Lees, A., J. Hardy, and T. Revesz, Parkinson's disease. Lancet, 2009. 373(9680): p. 2055-66.
2. Braak, H., et al., Staging of brain pathology related to sporadic Parkinson's disease. Neurobiology of aging, 2003. 24(2): p. 197-211.
3. Spillantini, M., et al., Alpha-synuclein in Lewy bodies. Nature, 1997. 388(6645): p. 839-40.
4. Ostrerova-Golts, N., et al., The A53T alpha-synuclein mutation increases iron-dependent aggregation and toxicity. Journal of neuroscience, 2000. 20(16): p. 6048-54.
5. Wan, W., et al., Iron Deposition Leads to Neuronal α-Synuclein Pathology by Inducing Autophagy Dysfunction. Frontiers in neurology, 2017. 8: p. 1.
Figures
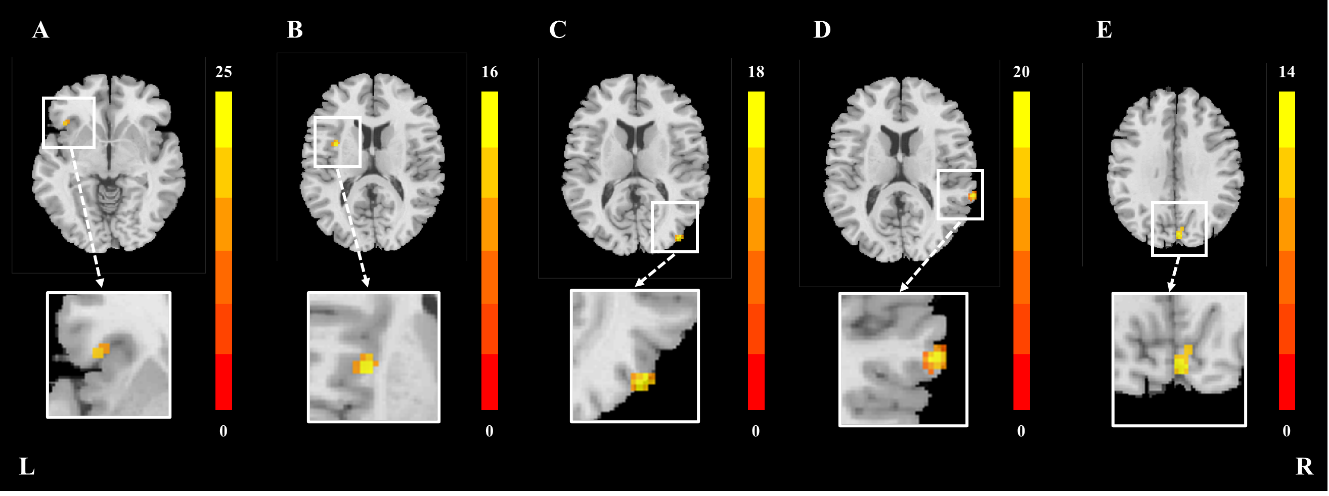
Figure 1 Disease*iron interaction effect clusters in BGN and VN. (A) left inferior frontal gyrus in BGN; (B) left insular lobe in BGN; (C) right middle occipital gyrus lVN; (D) right superior temporal gyrus in lVN; (E) bilateral cuneusin in mVN. All results are displayed at GRF correction (voxel level p < 0.005, cluster level p < 0.05). Color bars were proportional to F values.
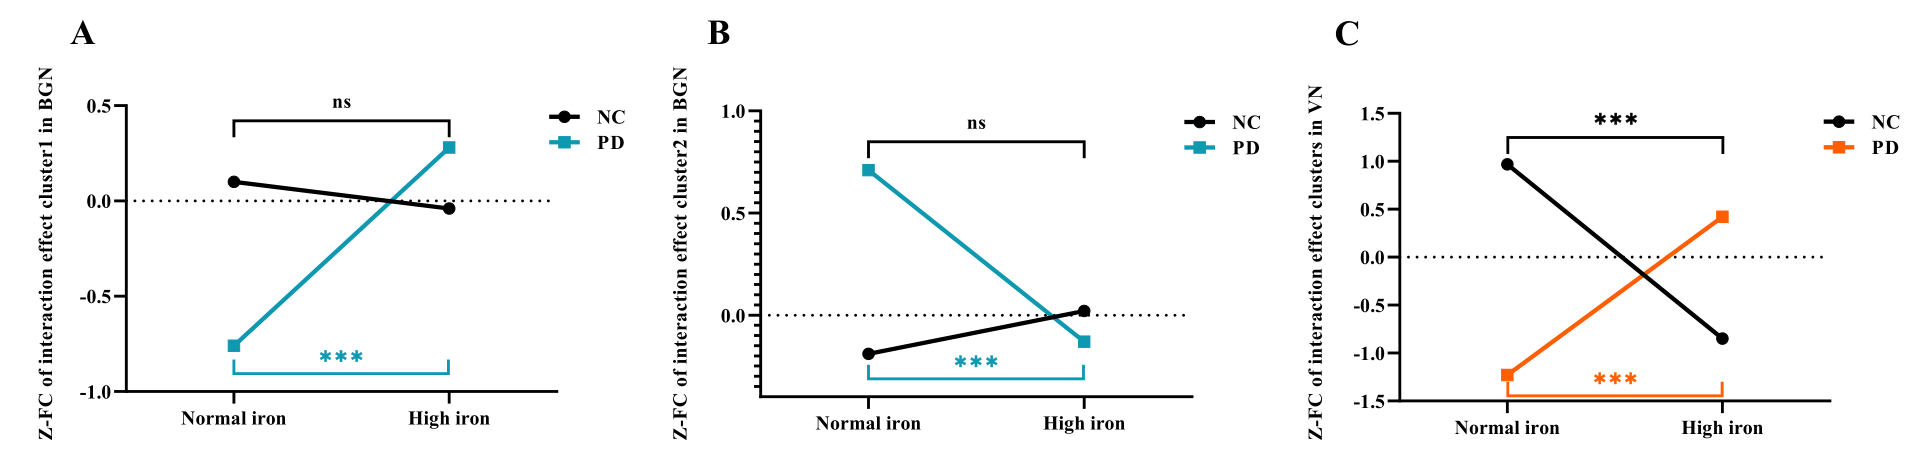
Figure 2 The FC of disease*iron interaction effect and main effect of disease clusters in BGN and VN. (A) the FC of interaction effect cluster1 in BGN; (B) the FC of interaction effect cluster2 in BGN; (C) the FC of interaction effect clusters in VN. FC: functional connectivity; Z: Z transformation; ns: p > 0.05; ***: P ≤ 0.001. In BGN, PD patients are depicted in blue and NC in black; In VN, PD patients are depicted in orange and NC in black.
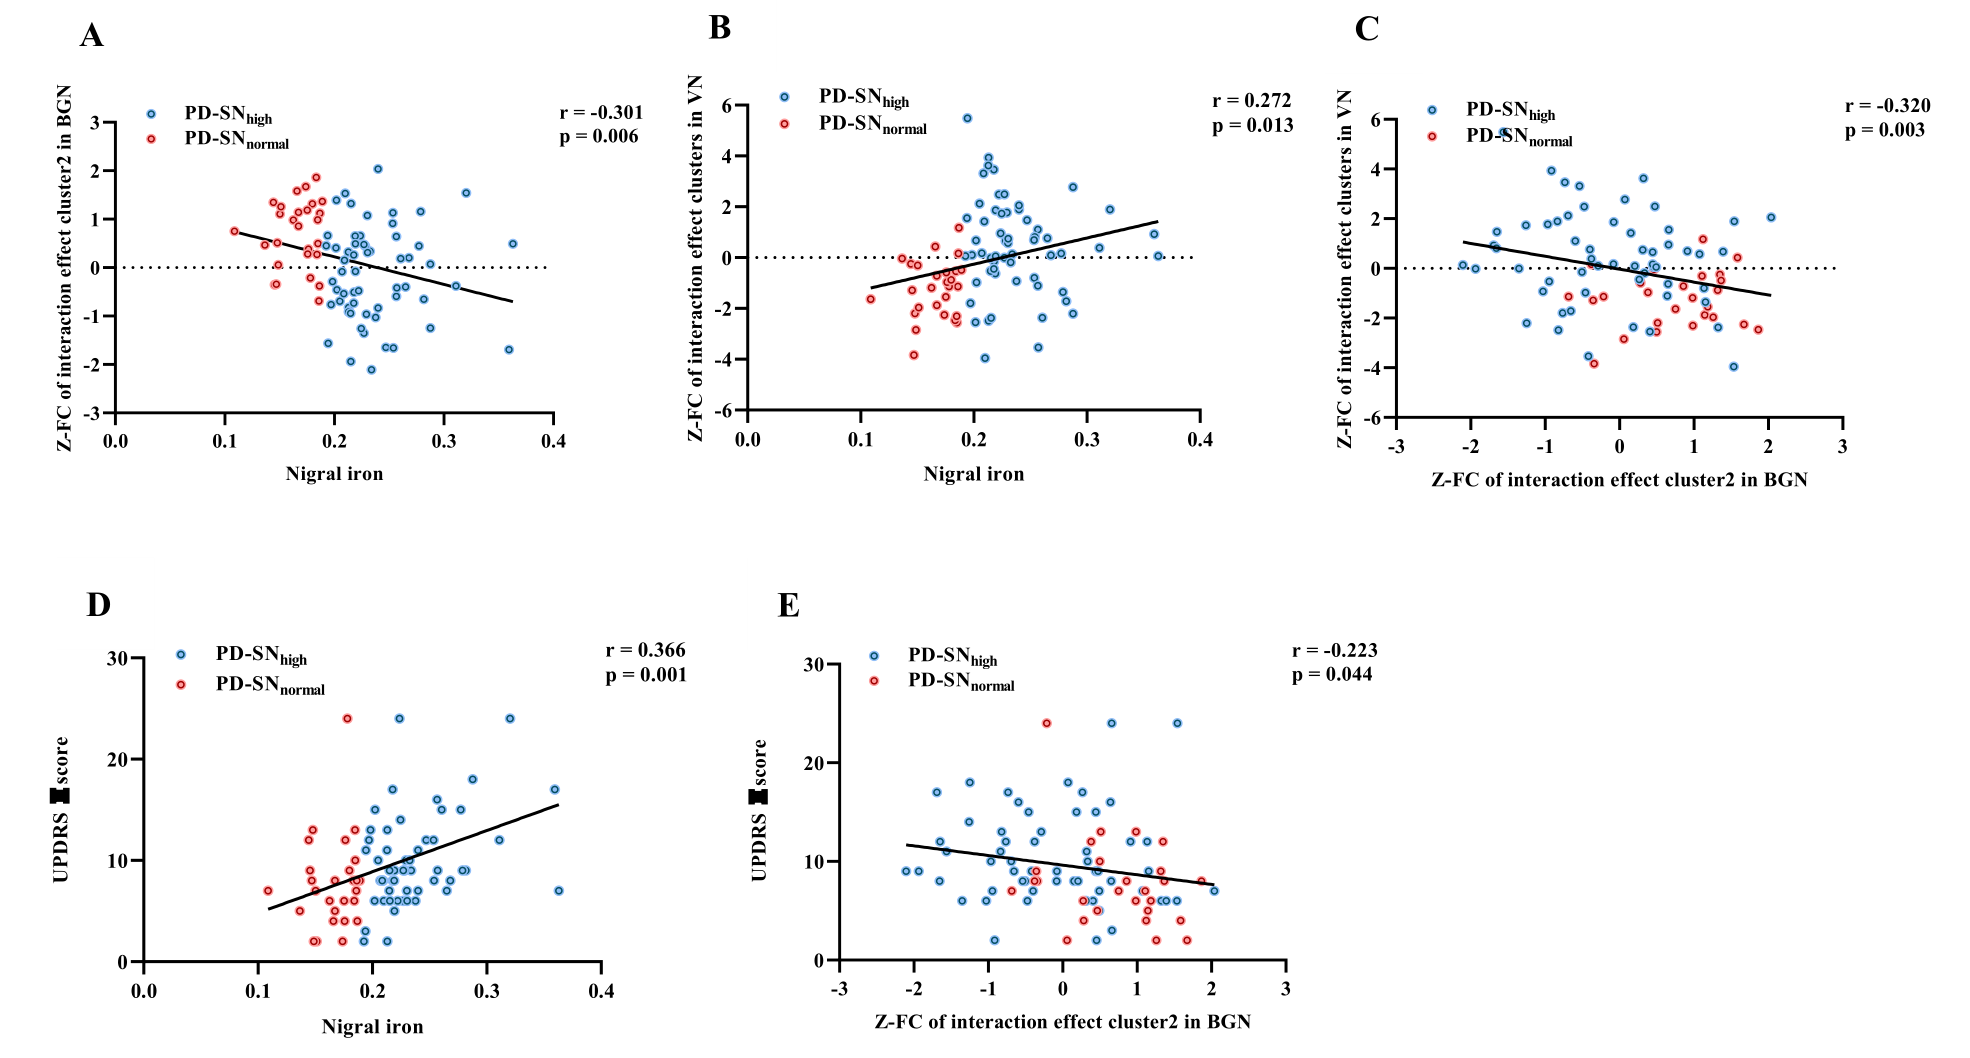
Figure 3 Correlations among nigral iron content, the FC of interaction effect clusters and UPDRS Ⅱ score in PD. (A) Nigral iron was correlated with the FC of interaction effect cluster 2 in BGN. (B) Nigral iron was correlated with the FC of interaction effect clusters in VN. (C) The FC of interaction effect cluster 2 in BGN was correlated with the FC of interaction effect clusters in VN. (D) Nigral iron was correlated with UPDRS Ⅱ score. (E) The FC of interaction effect cluster 2 in BGN was correlated with UPDRS Ⅱ score. FC: Functional connectivity; Z: Z transformation.