2955
Distinct patterns of tremor network microstructure for essential tremor and Parkinson’s disease1National Neuroscience Institute, Singapore, Singapore, 2Duke-NUS Graduate Medical School, Singapore, Singapore, 3Diagnostic Radiology, Singapore General Hospital, Singapore, Singapore, 4Graduate Institute of Medicine, Yuan Ze University, Taiwan, Taiwan, 5Neurology, Singapore General Hospital, Singapore, Singapore
Synopsis
Differential diagnosis of essential tremor and Parkinson’s disease can be challenging due to overlapping clinical presentations, but these diseases differ in neuropathological features, which may be detected using diffusion spectrum imaging. We identified parts of a tremor-related cerebello-thalamo-cortical network based on diffusion spectrum imaging that differed among a cohort comprising essential tremor and Parkinson’s patients, and healthy-controls. The patient groups had minimally-overlapping areas of abnormal microstructure in the tremor-network, and these were significantly correlated with clinical and kinetic measures of tremor severity. A future DSI-based marker of tremor-network microstructure may aid in differential diagnosis of essential tremor and Parkinson’s disease.
Introduction
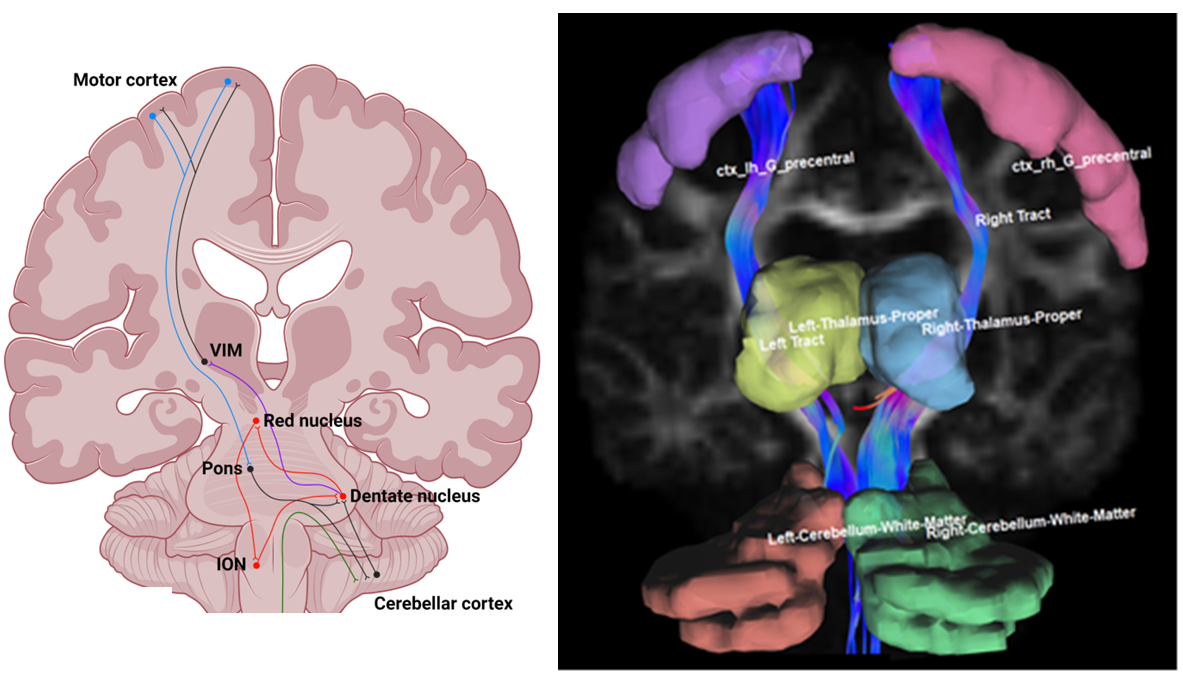
Essential tremor (ET) is characterized by upper limb action tremor in the absence of other neurological signs1, while Parkinson’s disease (PD) is characterized by rest tremor and bradykinesia. Clinical differentiation of ET from PD can be challenging, especially in patients who display no evidence of dopaminergic deficit.While both ET and PD are associated with dysfunctional oscillation of a common “tremor network” (Fig. 1), they have contrasting neuropathological profiles. ET is not regarded as neurodegenerative, but shows cerebellar morphological changes in some patients1. On the other hand, PD is neurodegenerative and is associated with Lewy body inclusions.
Diffusion spectrum imaging (DSI) is an MRI technique that can model complex intravoxel fiber orientation distributions, allowing more detailed assessments of microstructure than conventional diffusion tensor imaging2.
We aimed to identify differential patterns of aberrant tremor network microstructure using DSI among the following groups: (1) ET, (2) PD, (3) healthy controls and (4) patients who were initially diagnosed with ET but whose diagnosis was later changed to PD.
Methods
Subjects were recruited from neurology clinics at Singapore General Hospital between September 2018 and February 2020.Tremor severity was scored using The ET Rating Assessment Scale (TETRAS), the Unified PD Rating Scale (UPDRS) and Kinesia One (Great Lakes NeuroTechnologies, Cleveland, OH), a wearable motion sensor device providing quantitative real-time motion data3.
DSI data were acquired on a 3T Siemens PRISMA scanner (Siemens Healthineers, Erlangen, Germany) using a 32-channel head coil with the following parameters: simultaneous multislice factor = 2, TR = 3943ms, TE = 110ms, flip angle = 60°, 129 diffusion weighted volumes, 13 shells, scan time= 9 minutes 24 seconds, max b-value = 3000, matrix = 120 x 120, FOV = 240 x 240, number of slices = 81, slice thickness = 2mm.
DSI data were reconstructed using the generalized q-sampling approach in DSI Studio (version 2021 May)4. Tremor network regions (motor cortex, thalamus and cerebellum) were mapped to the diffusion data. Fiber tract connections between the motor cortex and cerebellum were generated. From each tremor network region and generated tract, we extracted the following metrics: fractional anisotropy (FA), mean diffusivity (MD), normalized quantitative anisotropy (NQA), isotropic diffusion component (ISO), restricted diffusion index (RDI) and non-restricted diffusion index (NRDI).
We first compared the patient groups to the control group on each combination of the DSI metrics and tremor network regions while controlling the false discovery rate (α=0.1). We then used principal components analysis to extract the dominant pattern of disease-specific tremor network microstructure within the ET and PD groups. Using this, we tested how strongly each pattern was expressed in the other groups, and whether it correlated with tremor severity.
Results
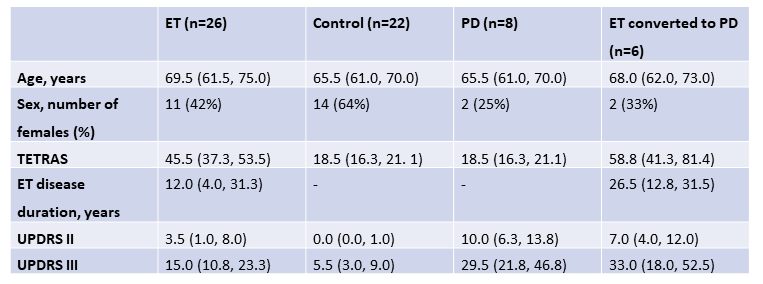
We included 26 ET, 22 healthy controls, 8 PD, and 6 ET-to-PD patients (Table 1). The groups did not differ on age (one-way ANOVA, p=0.22). Fig. 1 shows an example subject with regions and generated tracts overlaid.Both PD and ET groups had significant differences from controls, which only minimally overlapped. ET patients had higher MD in the right cerebellum and right precentral gyrus, lower FA in the left thalamus and right precentral gyrus, and lower RDI in the right thalamus (p-values: 0.008, 0.003, 0.006, 0.002, 0.008). PD patients had higher MD in the right thalamus, lower FA in the left and right thalamus, lower ISO in the left precentral gyrus, lower NRDI in the right precentral gyrus and right motor tract (p-values: 0.007, 0.005, 0.006, 0018, 0.003, 0.009).
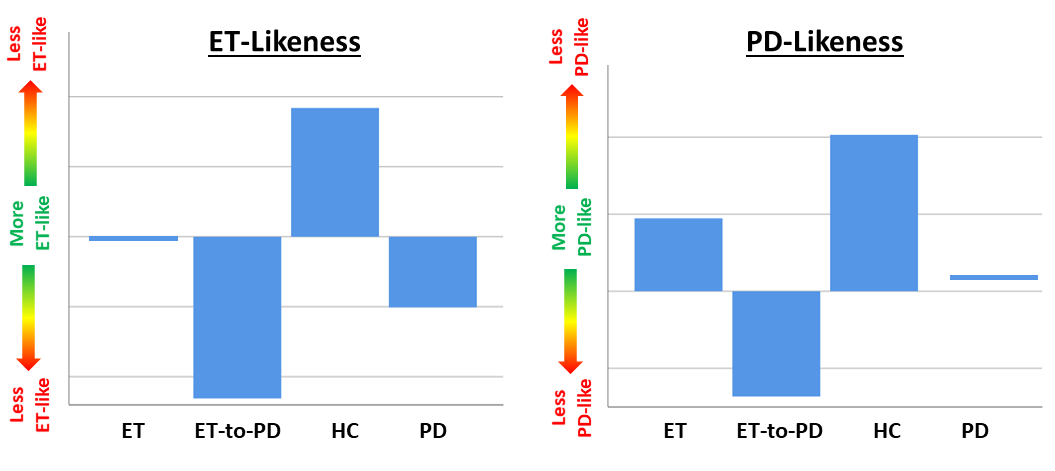
Patterns of disease-specific tremor network microstructure were extracted for the PD and ET groups, explaining 42% and 49% of variance, respectively. The ET-like pattern was most strongly weighted toward NQA and ISO in the cerebellum bilaterally and NRDI in the motor tract bilaterally. Conversely, the PD-like pattern was strongly weighted toward NRDI in the cerebellum, thalamus and motor tract bilaterally. Fig. 2 shows a comparison between the four groups for the disease-specific tremor network microstructure pattern scores, which had significant differences (one-way ANOVA p-values: 0.011, 0.031 for ET and PD, respectively). The likeness expression of the ET-to-PD group was closer to PD than ET.
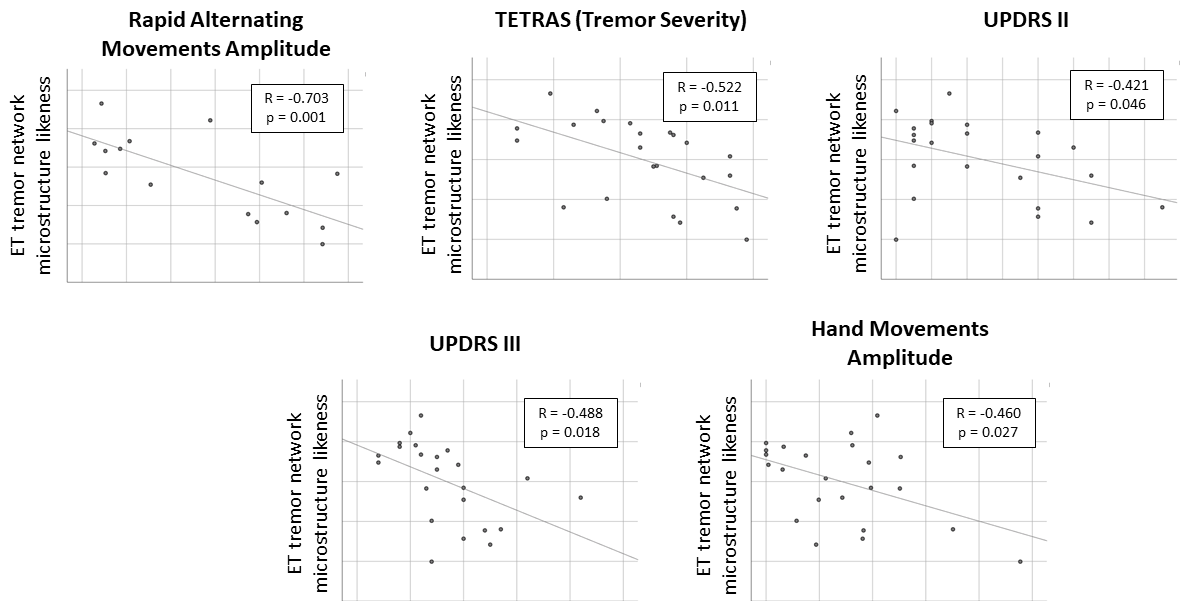
In the ET group, the ET tremor network likeness score was significantly correlated with the TETRAS (p=0.011; Fig. 3), the UPDRS motor parts II (p=0.046) and III (p=0.018) and also with the real-time motion sensor measures: “rapid-alternating-movements-amplitude” (p<0.001) and “hand-movement-amplitude” (p=0.027). In the PD group, the PD tremor network likeness score was significantly correlated only with the speed of finger tapping (p=0.003).
Discussion
We present the first study of DSI in ET. We identified patterns of tremor network microstructure that differed between ET and PD, and correlated with multiple measures of clinical severity. This supports the presence of microstructural changes in the ET brain and a greater relevance of the implemented tremor-network microstructure approach for ET than for PD. Differentiation of ET and PD by DSI is supported by the non-overlap of significant differences and by variation across groups in the expression of ET and PD network likeness.Conclusion
These findings support the notion of MRI-based markers to aid clinical differential diagnosis of ET and PD. Future work will refine such a marker and test its classification performance in larger samples.Acknowledgements
TW acknowledges the support of the National Medical Research Council (OFYIRG20nov-0032).References
1. Welton T, Chan L, Carr J, Cardoso F, Deutchl G, Jankovic J & Tan EK, 2021. Essential Tremor. Nature Reviews Disease Primers. (accepted).
2. Wedeen VJ, Hagmann P, Tseng WYI, Reese TG and Weisskoff RM, 2005. Mapping complex tissue architecture with diffusion spectrum magnetic resonance imaging. Magnetic Resonance in Medicine 54: 1377-1386.
3. Giuffrida JP, Riley DE, Maddux BN & Heldman DA, 2009. Clinically deployable Kinesia technology for automated tremor assessment. Movement Disorders 15; 24(5):723-30.
4. Yeh FC, 2021. DSI Studio (Version 2021 May). Zenodo. http://doi.org/10.5281/zenodo.4764264
Figures