2954
Gray matter myelin quantification in Parkinson’s disease based on MP2RAGE T1 mapping1Henan Provincial People's Hospital, Zhengzhou, China, 2MR Collaboration, Siemens Healthineers Ltd, Beijing, China
Synopsis
Quantitative R1(1/T1) imaging has been proposed as surrogate imaging biomarkers for myelin content in cortical gray matter. This study, using high resolution T1 maps generated by MP2RAGE sequence, quantified gray matter myelin in Parkinson’s disease (PD) patients and compared the values with those in healthy controls. The results revealed that myelin (represented by R1) was significantly decreased in PD in several cortical and subcortical brain areas, which may be anatomic evidence for the spectrum of symptoms in PD, such as deficits of memory, mood, and cognition. Myelin quantification based on MP2RAGE-T1 mapping may be a valuable biomarker for characterizing PD.
Introduction
Parkinson’s disease (PD) is a neurodegenerative disease that is characterized by motor symptoms of tremor, rigidity and non-motor symptoms affecting sleep, cognition, and autonomic function. Motor symptoms are mainly caused by progressive loss of dopaminergic neurons in substantia nigra1, but the pathogenesis of numerous non-motor-related symptoms is unclear; disruption of functional and structural networks that mediate information flow may account for the widespread symptoms. Myelinated axons are presumably the anatomic substrate of these brain networks. Thus, quantification of myelin content may increase understanding of the mechanism underlying this possibility.Alteration of white matter myelin in PD has been studied but change in gray matter has not. Methods such as quantitative R1(1/T1) imaging, T1-weighted over T2-weighted imaging, and T2* imaging have been proposed as surrogate imaging biomarkers for myelin concentration in gray matter2. A sequence referred to as Magnetization Prepared 2 Rapid Acquisition Gradient Echoes (MP2RAGE), which is an extension of MPRAGE, has been proposed3. It may provide a homogeneous T1-weighted contrast with an intrinsic correction of B1 inhomogeneity and reduced residual proton density and T2* weighting. Simultaneously, MP2RAGE can generate an accurate quantitative map of T1 relaxation by computing the two gradient echo images (INV1, INV2). This study used R1 maps derived from MP2RAGE T1 maps to quantify the gray matter myelin in PD patients and compare it with healthy controls (HC).Methods
The MP2RAGE data in 28 PD patients (17 males, age 59.9 ± 9.8 years) and 33 HC (15 males, age: 60.4 ± 6.8 years) were acquired on a 3T MAGNETOM Prisma scanner (Siemens Healthcare, Erlangen, Germany) equipped with a 64-channel head/neck coil. The parameters for MP2RAGE were sagittal direction, repetition time = 5000 ms, echo time = 2.98 ms, inversion time 1/2 = 700/2500 ms, field of view = 256 × 256 mm2, slices = 176, voxel size = 1.0 × 1.0 × 1.0 mm3, GRAPPA = 3, total acquisition time= 8:22 m. MP2RAGE produced three contrast images (INV1, INV2, UNI) and a quantitative T1 map (Figure 1.). Cortical and subcortical gray matter myelin were quantified and analyzed with these steps:1) Referring to work by Choi4, INV2 images were stripped to extract the brain using the BET toolbox in FSL 6.0 (FMRIB, Oxford, UK). UNI image cannot be automatically stripped because of salt-and-pepper noise in background. Thus, whole brain mask was created from the brain-extracted INV2 image and applied to other images. 2) The brain-extracted UNI images were segmented and normalized to MNI template with SPM12 (https://www.fil.ion.ucl.ac.uk/spm/software/spm12). T1 map was also normalized to MNI template using the deformation matrix generated from UNI image segmentation. 3) T1 and R1 values (R1=1/T1), derived from normalized T1 maps, were extracted and compared between PD and HC for each region of interest (ROI), including 32 sub-cortical and 96 cortical regions, using masks in Harvard-Oxford Atlas. The comparison was conducted with Mann-Whitney U test in SPSS 22.0 (IBM SPSS Inc., Chicago, IL, USA). P<0.05 was considered statistically significant.Results
For cortical ROIs, R1 values of bilateral insular cortex (IC), left posterior division of middle temporal gyrus (MTG), right posterior division of supramarginal gyrus (SMG), angular gyrus (AG), right paracingulate gyrus (PCG), right planum temporale (PT), and left frontal orbital cortex (FOC) were significantly lower in PD patients than in HC (Table 1 and figure 2). For subcortical ROIs, R1 values of bilateral hypothalamus, amygdala, and left habenular nuclei (HN) were significantly lower in PD patients than in HC (Table 2 and figure 3).Discussion and Conclusion
This study identified a significant alteration of gray matter myelin content in multiple brain areas of PD patients. Most discovered brain areas were probably associated with specific PD symptom domains, especially the non-motor symptoms.For cortical brain areas, IC, PCG, and FOC are related to emotion and memory. MTG, PT, SMG and AG are in Wernicke's area, which is the auditory and language center. These brain regions have been found involved in PD 5-8. For the subcortical brain areas, the hypothalamus and amygdala were considered to contain dopamine receptors, which were severely impaired in PD patients. The decreased in dopamine has been considered associated with the typical symptoms in PD. HN was part of epithalamus, and the function of HN is intimately connected with dopaminergic neurons and PD. The hypothalamus, amygdala, and HN are related to emotion, memory, and cognitive function. Functional and morphological changes in these nuclei of PD patients have been reported 9,10.Decrease of myelin in the above brain areas may account for broad spectrum of symptoms in PD and provide anatomic basis for the dysfunction of networks in these brain areas.Our study demonstrated that myelin quantification based on MP2RAGE-T1 maps may be a sensitive biomarker for characterizing PD. MP2RAGE is useful for simultaneously quantifying brain morphology and gray matter myelin.Acknowledgements
National Natural Science Foundation of China (81720108021)References
- 1. Kalia LV, Lang AE. Parkinson's disease. Lancet. 2015 Aug 29;386(9996):896-912.
- 2. Lutti A, Dick F, Sereno MI, Weiskopf N. Using high-resolution quantitative mapping of R1 as an index of cortical myelination. Neuroimage. 2014 Jun;93 Pt 2:176-88.
- 3. Marques JP, Kober T, Krueger G, van der Zwaag W, Van de Moortele PF, Gruetter R. MP2RAGE, a self bias-field corrected sequence for improved segmentation and T1-mapping at high field. Neuroimage. 2010 Jan 15;49(2):1271-81.
- 4. Choi, Uk-Su, Hirokazu Kawaguchi, Yuichiro Matsuoka, Tobias Kober, and Ikuhiro Kida. 2019. “Brain Tissue Segmentation Based on MP2RAGE Multi-Contrast Images in 7 T MRI.” PLOS ONE 14 (2).
- 5. Sterling NW, Wang M, Zhang L, Lee EY, Du G, Lewis MM, Styner M, Huang X. Stage-dependent loss of cortical gyrification as Parkinson disease "unfolds". Neurology. 2016 Mar 22;86(12):1143-51.
- 6. Maidan I, Rosenberg-Katz K, Jacob Y, Giladi N, Hausdorff JM, Mirelman A. Disparate effects of training on brain activation in Parkinson disease. Neurology. 2017 Oct 24;89(17):1804-1810.
- 7. Carriere N, Lopes R, Defebvre L, Delmaire C, Dujardin K. Impaired corticostriatal connectivity in impulse control disorders in Parkinson disease. Neurology. 2015 May 26;84(21):2116-23.
- 8. Oishi N, Udaka F, Kameyama M, Sawamoto N, Hashikawa K, Fukuyama H. Regional cerebral blood flow in Parkinson disease with nonpsychotic visual hallucinations. Neurology. 2005 Dec 13;65(11):1708-15.
- 9. Niccolini F, Wilson H, Pagano G, Coello C, Mehta MA, Searle GE, Gunn RN, Rabiner EA, Foltynie T, Politis M. Loss of phosphodiesterase 4 in Parkinson disease: Relevance to cognitive deficits. Neurology. 2017 Aug 8;89(6):586-593.
- 10. Markovic V, Agosta F, Canu E, Inuggi A, Petrovic I, Stankovic I, Imperiale F, Stojkovic T, Kostic VS, Filippi M. Role of habenula and amygdala dysfunction in Parkinson disease patients with punding. Neurology. 2017 Jun 6;88(23):2207-2215.
Figures
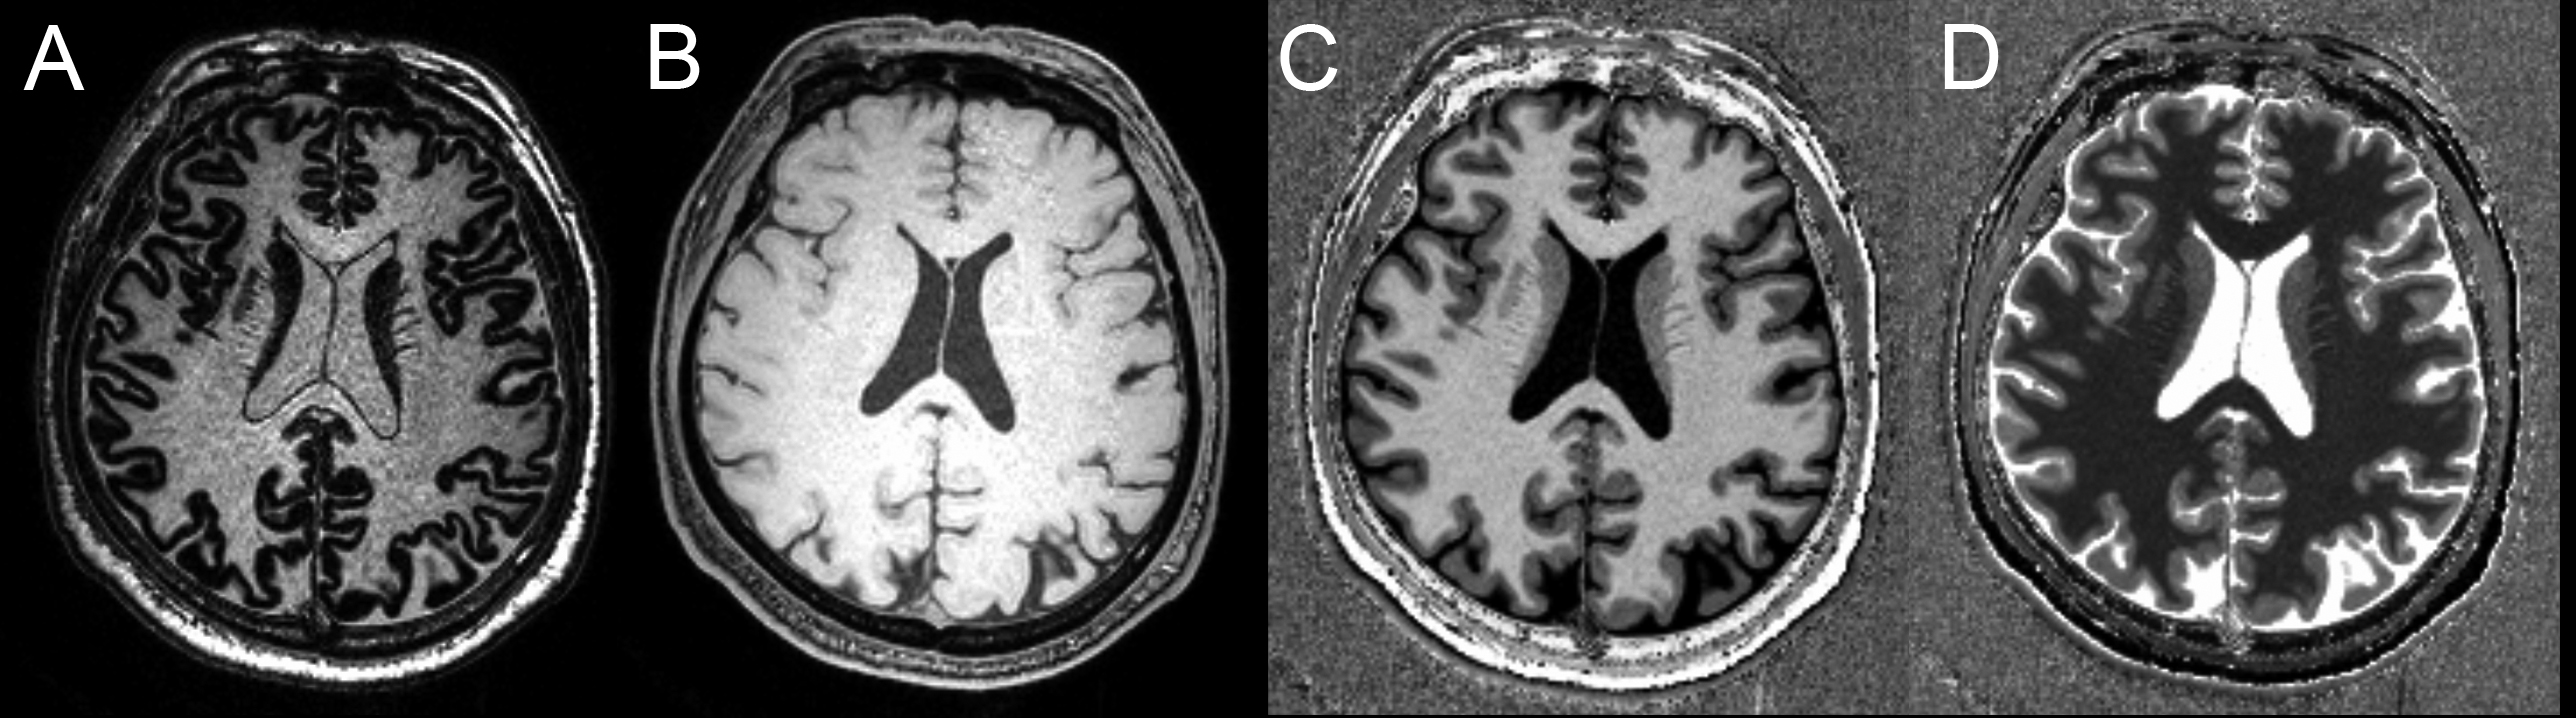
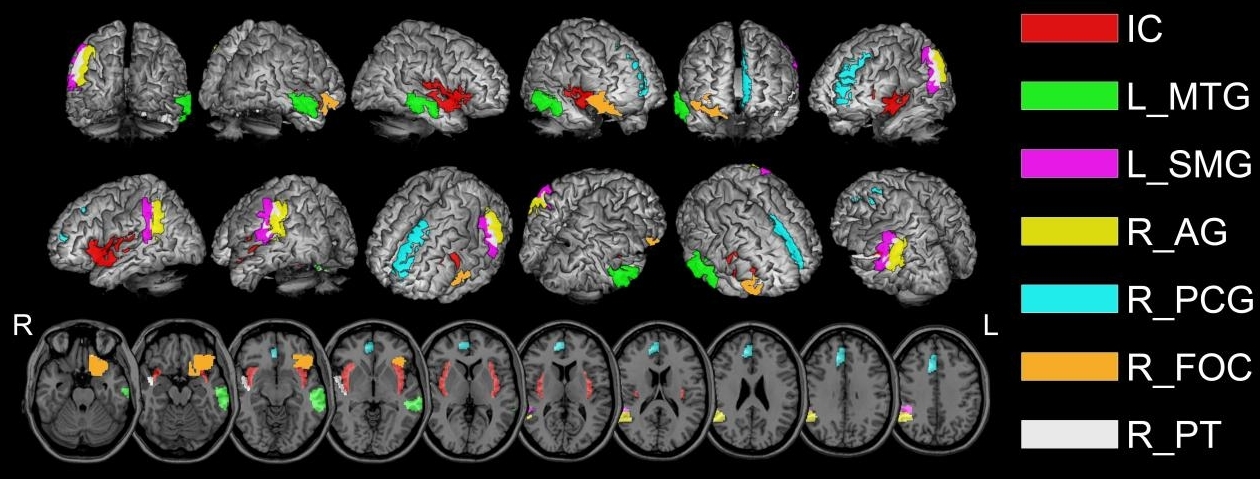
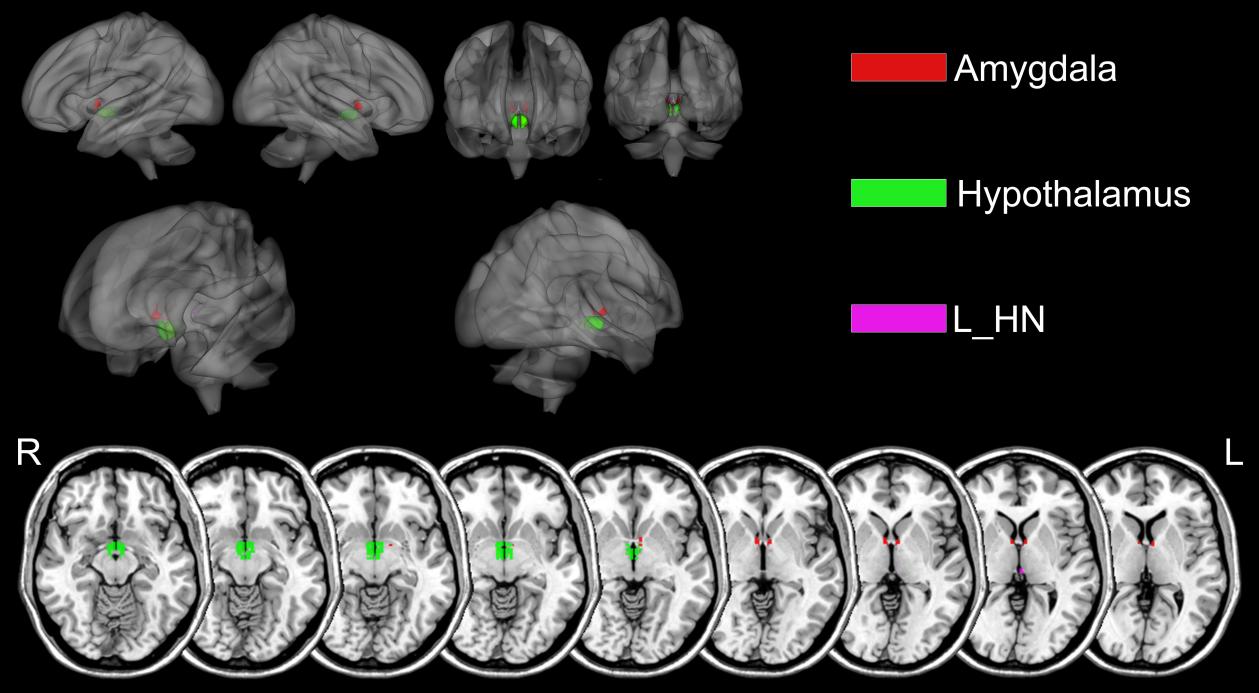
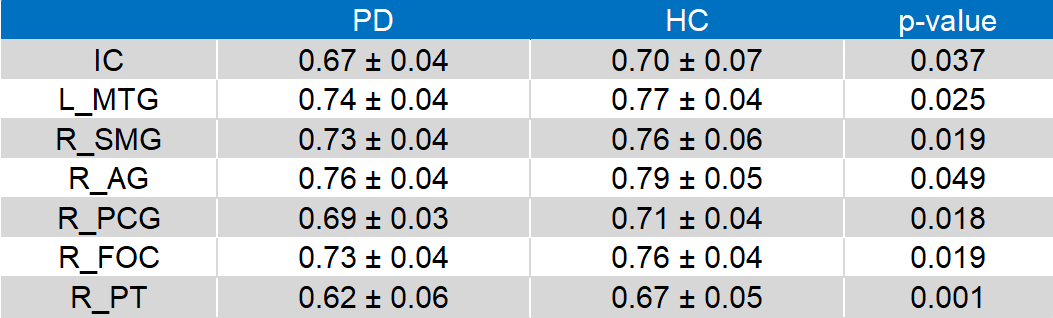
Table 1. Values for R1 in the cortical cortex of Parkinson’s disease patients and healthy controls
The data are shown as mean ± standard deviation. IC, bilateral insular cortex; L_ MTG, left posterior division of middle temporal gyrus; R_SMG, right posterior division of supramarginal gyrus; AG, angular gyrus; R_PCG, right paracingulate gyrus; R_FOC, right frontal orbital cortex; R_PT, right planum temporal
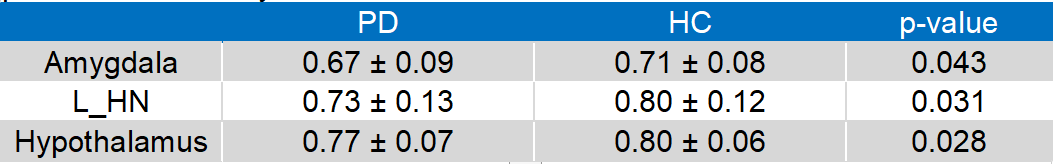
Table 2. Values for R1 in the sub-cortical cortex of Parkinson’s disease patients and healthy controls
The data are shown as ± standard deviation.
L_HN, left habenular nuclei