2945
Increased Brain Iron Deposition in Moderate and Severe Obstructive Sleep Apnea using Quantitative Susceptibility Mapping1Department of Radiology, The First Affiliated Hospital of Guangzhou Medical University, Guangzhou, China, 2MR Collaboration, Siemens Healthineers Ltd., Guangzhou, China, 3MR Scientific Marketing, Siemens Healthineers, Guangzhou, China
Synopsis
In the current study, we assessed the possible alterations of iron accumulation in the brain of patients with Obstructive Sleep Apnea (OSA) using quantitative susceptibility mapping (QSM). We found that there was increased iron accumulation in the bilateral hippocampus for patients with OSA, compared to controls. And the QSM value of the bilateral hippocampus was related to the course of disease in patients with OSA. The QSM values of the right hippocampus were correlated with multiple clinical indicators and may therefore be used as potential biomarkers to further understand the pathophysiological mechanisms of moderate to severe OSA.
Introduction and Purpose:
Excessive deposition of iron in the brain is an important pathological characteristic of Obstructive Sleep Apnea (OSA) [1, 2]. Quantitative susceptibility mapping (QSM) can noninvasively measures tissue magnetic susceptibility, which correlates well with iron levels in the brain[3]. The purpose of this study was to investigate the changes of QSM within specified brain regions in patients with moderate and severe OSA, and its correlation with disease indicators to explore the potential neurophysiological mechanism.METHODS:
This study was approved by the local ethics committee, and all subjects provided written informed consent. As shown in Table 1, a total of 36 treatment-naive patients with moderate or severe OSA and 30 healthy, age- and gender-matched subjects, underwent the full-night polysomnography evaluation, and MRI examinations on a 3T MR scanner (MAGNETOM Skyra, Siemens Healthcare, Erlangen, Germany) using a 20-channel head coil. A three-dimensional (3D) multi-echo gradient echo (GRE) sequence with 6 equally spaced echoes was performed for quantitative susceptibility mapping (QSM). Imaging parameters were as follows: the first echo time = 5.78 ms; echo spacing = 5.3ms; repetition time = 40 ms; flip angle =15°; field of view = 220mm ×192 mm; matrix = 320 ×260; slice thickness = 2.0 mm; voxel size= 0.7×0.7×2.0mm³; and acquisition time = 6min. 45sec.The regional magnetic susceptibilities of grey matter nuclei (caudate nucleus, putamen, globus pallidus, thalamus, red nucleus, substantia nigra, hippocampus, and dentate nucleus) and cortex (frontal cortex, parietal cortex, and occipital cortex) were quantified in QSM. The correlations between regional QSM and clinical indexes were evaluated using Pearson correlation analysis. The receiver operating characteristic (ROC) curve was used to evaluate the diagnostic performance of QSM for OSA.
RESULTS:
The susceptibility of the bilateral hippocampus was significantly higher in OSA patients compared to controls (p= 5.5×10⁻⁷ for the right, p=0.022 for the left) (Figures 1&2) and was related to disease duration in patients with OSA (r = 0.384, p = 0.021 for the right; r =0.418, p =0.011 for the left) (Figure 3). The highest diagnostic performance for OSA was observed in the QSM value of the right hippocampus with area under the curve (AUC) of 0.822 (p <0.0001) (Figure 4). Regardless of age and gender, the QSM value of the right hippocampus was positively related to the apnea-hypopnea index (AHI), time percentage of 90% oxygen saturation (T90%), and body mass index (BMI) (r = 0.609, p<0.0001; r =0.509, p=0.0024; r = 0.225, p =0.0087), respectively.Discussion and Conclusions:
In the current study, we assessed the possible alterations of iron accumulation in the brain of subjects with OSA using QSM. The results showed that iron was mainly deposited in the bilateral hippocampus, which was positively correlated with the course of disease in patients with OSA. Furthermore, the QSM value in the right hippocampus was negatively correlated with lowest pulse oxygen saturation (LSaO2) and positively correlated with AHI, T90%, and BMI, which was inconsistent with a prior study using T2 weighted imaging [4]. Moreover, iron deposition in these regions had a similar accumulation pattern to those of patients with Alzheimer's disease (AD)[5-7]. Therefore, these accumulation patterns occur not only in AD, but also in patients with OSA. These observed group differences and clinical relevance of QSM value provide important implications for OSA-related mechanisms, which could be detected by QSM.Acknowledgements
No acknowledgement found.References
1. Le Tallec-Esteve N, Rousseau C, Desrues B et al. Transferrin saturation is independently associated with the severity of obstructive sleep apnea syndrome and hypoxia among obese subjects. Clin Nutr 2021; 40: 608-614.
2. Zhao YS, Tan M, Song JX et al. Involvement of Hepcidin in Cognitive Damage Induced by Chronic Intermittent Hypoxia in Mice. Oxid Med Cell Longev 2021; 2021: 8520967.
3. Wang Y, Liu T. Quantitative susceptibility mapping (QSM): Decoding MRI data for a tissue magnetic biomarker. Magn Reson Med 2015; 73: 82-101.
4. Algin O, Gokalp G, Ocakoglu G et al. Neurochemical-structural changes evaluation of brain in patients with obstructive sleep apnea syndrome. Eur J Radiol 2012; 81: 491-495.
5. Gong NJ, Dibb R, Bulk M et al. Imaging beta amyloid aggregation and iron accumulation in Alzheimer's disease using quantitative susceptibility mapping MRI. Neuroimage 2019; 191: 176-185.
6. Cogswell PM, Wiste HJ, Senjem ML et al. Associations of quantitative susceptibility mapping with Alzheimer's disease clinical and imaging markers. Neuroimage 2021; 224: 117433.
7. Au CKF, Abrigo J, Liu C et al. Quantitative Susceptibility Mapping of the Hippocampal Fimbria in Alzheimer's Disease. J Magn Reson Imaging 2021; 53: 1823-1832.
Figures
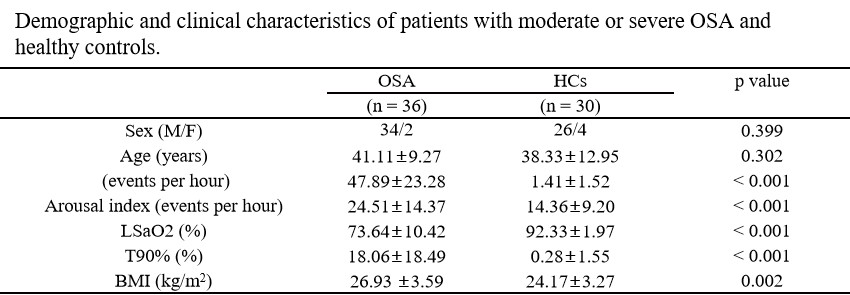
Values are given in means ± standard deviations. AHI, apnea-hypopnea index; BMI, body mass index; HCs, healthy controls; LSaO2, lowest pulse oxygen saturation; OSA, obstructive sleep apnea; T90%, time percentage of 90% oxygen saturation.

Figure. 1. Representative QSM maps of two individuals of the same age, HC subject (left column) and OSA patient (right column). Note increased QSM in the hippocampus of the OSA patient. HC, healthy control; OSA, obstructive sleep apnea; QSM, quantitative susceptibility mapping.
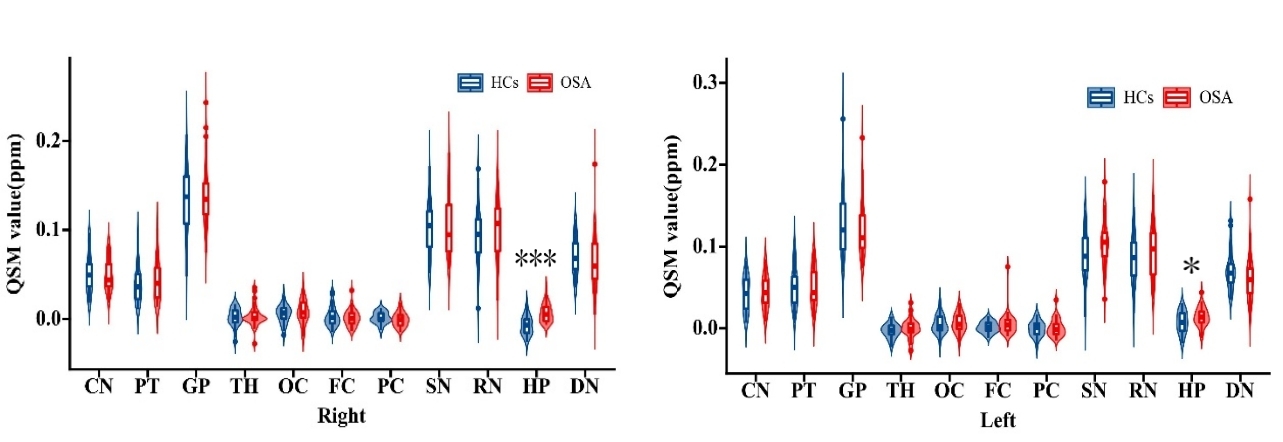
Figure. 2. Comparison of QSM values between OSA group and controls. Significant differences are represented as ∗p < 0.05, ∗∗∗p < 0.001. CN, caudate nucleus; DN, dentate nucleus; FC, frontal cortex; GP, globus pallidus; HC, healthy control; HP, hippocampus; OC, occipital cortex; OSA, obstructive sleep apnea; PC, parietal cortex; PT, putamen; QSM, quantitative susceptibility mapping; RN, red nucleus; SN, substantia nigra; TH, thalamus.
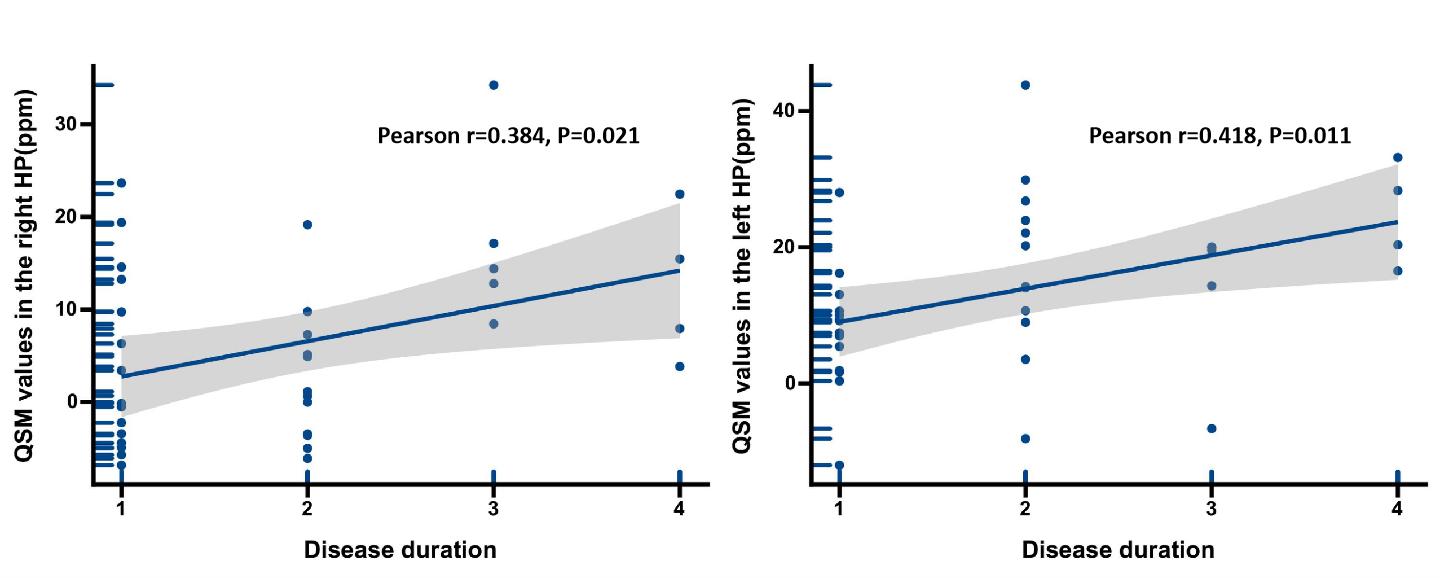
Figure 3. Scatter plot illustrating the correlations between QSM values in right HP and disease duration (left), and the correlations between QSM values in left HP and disease duration (right). HP, hippocampus; QSM, quantitative susceptibility mapping.
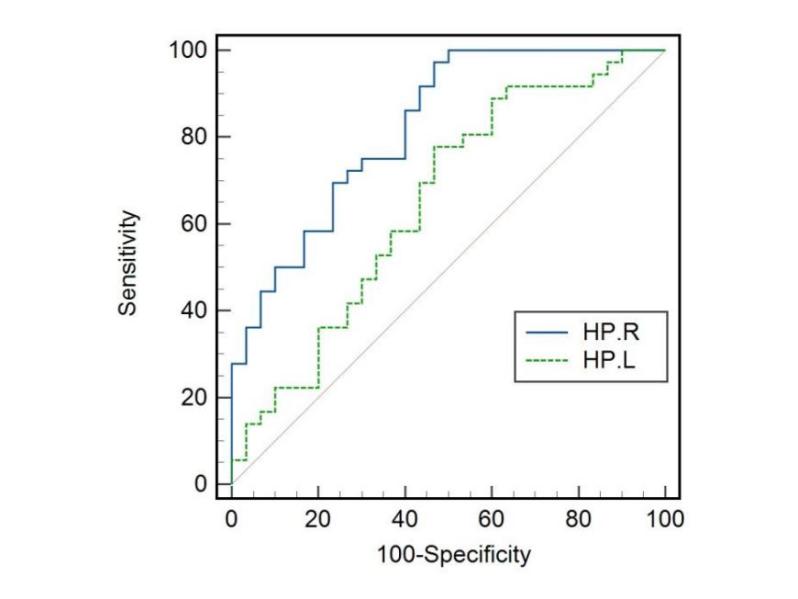
Figure. 4. Results of ROC curve analyses of QSM value obtained from the bilateral hippocampus that showed significant inter-group differences. QSM in the right hippocampus provide highest diagnostic performance to differentiate OSA patients from healthy controls. AUC, area under curve; HP, hippocampus; QSM, quantitative susceptibility mapping; ROC, receiver operating characteristic.