2943
Measurement of Cerebrospinal fluid and Interstitial Fluid Flow in Mouse Brain using Q-space Imaging1Human and Information Science, Tokai university, Hiratsuka, Kanagawa, Japan, 2BioView, Inc., Tokyo, Japan, 3Electrical and Electronic Engineering, Tokai university, Hiratsuka, Kanagawa, Japan, 4Neurosurgery, Tokai university, Isehara, Kanagawa, Japan, 5Radiological Technology, Tokai university hospital, Isehara, Kanagawa, Japan
Synopsis
To visualize cerebrospinal fluid (CSF) and interstitial fluid (ISF) flows, in this study, q-space imaging (QSI) based on 3-dimensional stimulated echo and echo planar imaging (3D STE-EPI) was performed for mouse brain. QSI can measure velocity of flow as µm/s order. The preliminary results showed the CSF and ISF flows in the mouse brain. In addition, the technique seemed to exhibit the CSF/ISF flows along the corpus callosum of the mouse brain. In the future, QSI with STE-EPI may quantitatively reveal the CSF and ISF flows in human brain.
Introduction
Investigation of cerebrospinal fluid (CSF) flow was recently conducted by many researchers. Especially, there are many reports related with glymphatic system.1-5 In present, CSF is not distinguished to interstitial fluid (ISF). The CSF and ISF flows related to the glymphatic system were visualized indirectly such as use of tracer. Meanwhile, the quantitative observation of the flows, e.g. velocity, has not been reported.A technique to quantify the velocity of slow flow is q-space imaging (QSI), which can characterize the slow flow as average displacement during a particular time. Previous report indicated that the slow flow about 50 µm/s was visualized in the phantom based on QSI analysis.6 Thus, the technique is expected to visualize the CSF and ISF flows in the brain.
In the current research, as a preliminary study to be applied to human, we tried to measure and visualize the CSF and ISF flows in mouse brain using QSI analysis based on 3-dimensional stimulated echo and echo planar imaging (3D STE-EPI).
Methods
STE-EPI was performed for female mouse (postnatal week 21) under anesthesia at 9.4T-MRI. Imaging parameters were as follows: TR, 4000 ms; TE, 19.44 ms; δ, 1 ms; Δ, 1000 ms; Motion probing gradient (MPG) strength, between -292.74 and 292.74 mT/m at intervals of 73.185 mT/m, corresponding to maximum q 1.25×10⁴ m-1; MPG directions, ±X, ±Y, and ±Z; FOV, 20×22×8 mm; spatial resolution, 0.147×0.147×1 mm; matrix, 136×150×8; EPI segments, 8. Total acquisition time was approximately 2 hours.The complex signal of STE-EPI was sorted according to q values for QSI analysis. The signals were zero-filled to 32 data points for each voxel. Then, Fourier transform was applied to the signals to obtain the probability displacement function, called as propagator. The average displacement as well as velocity is corresponded to peak point in the propagator. The displacement resolution in the propagator was 10 µm, which the velocity was 10 µm/s. The peak of the propagator was estimated by polynomial fitting, resulted in the velocity resolution of 0.1 µm/s. The estimation was conducted for voxel-by-voxel. The estimated velocity in 3 spatial direction was visualized as vectors and color-coding.
Results
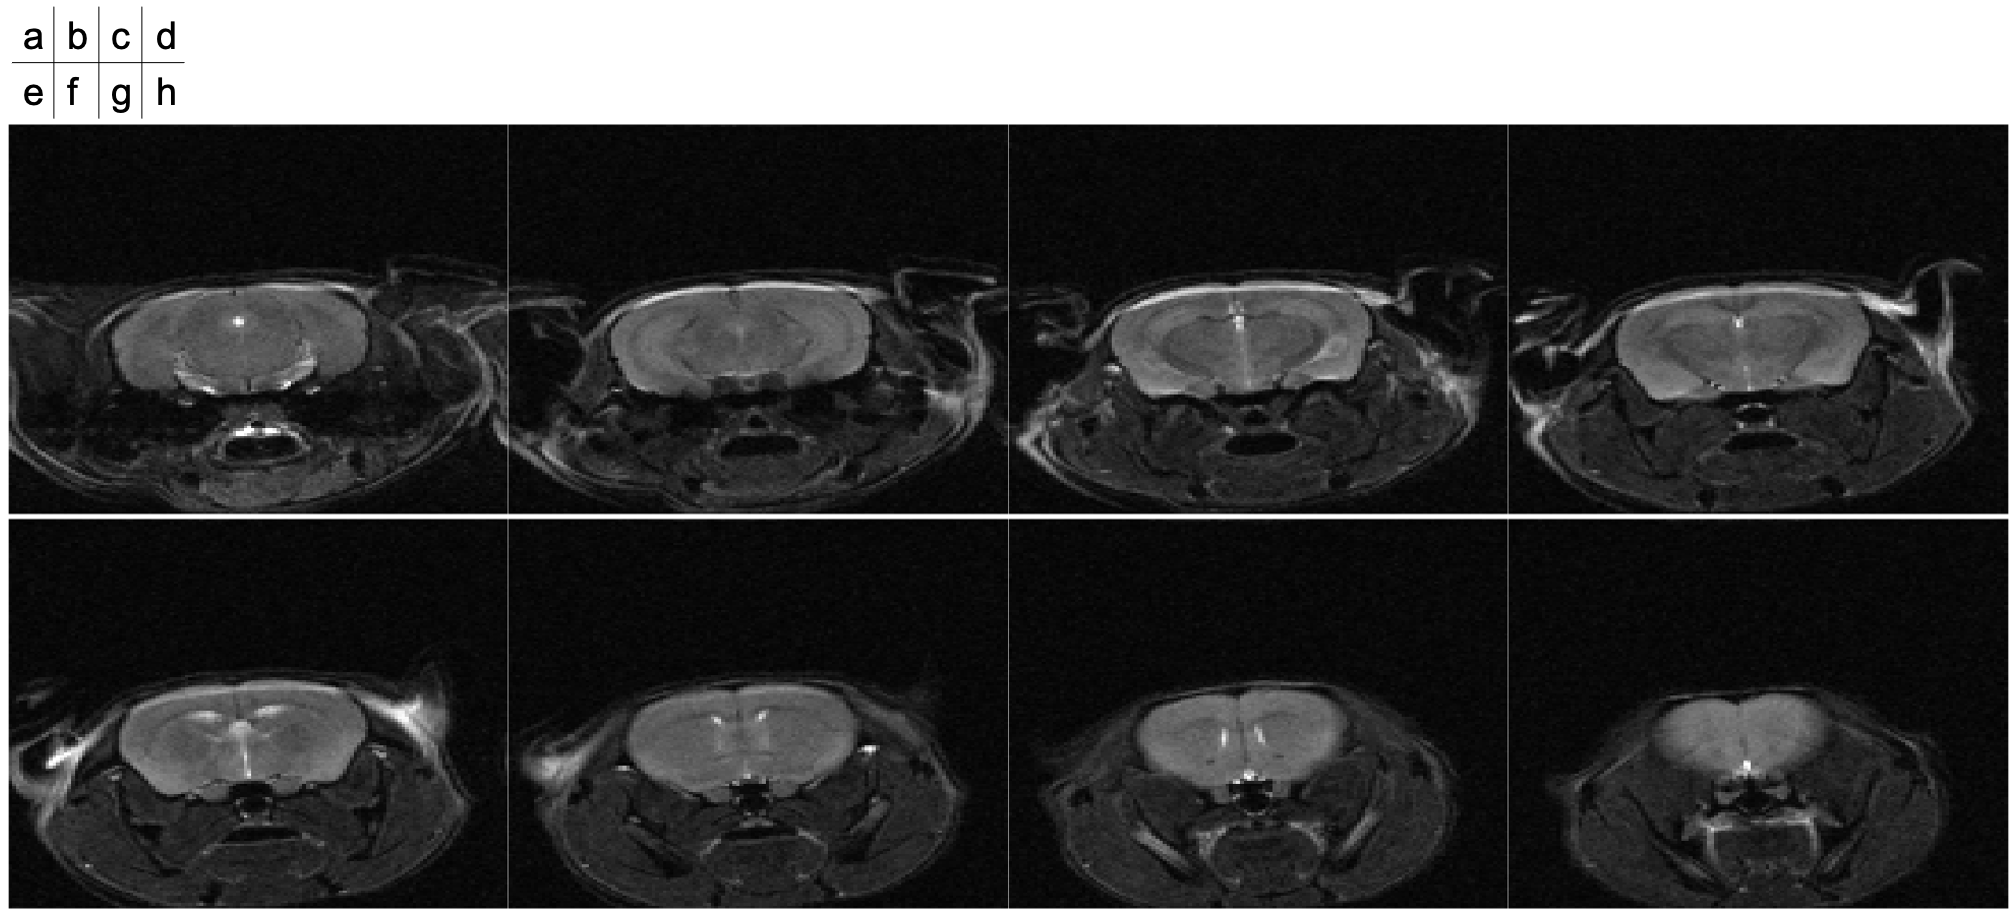
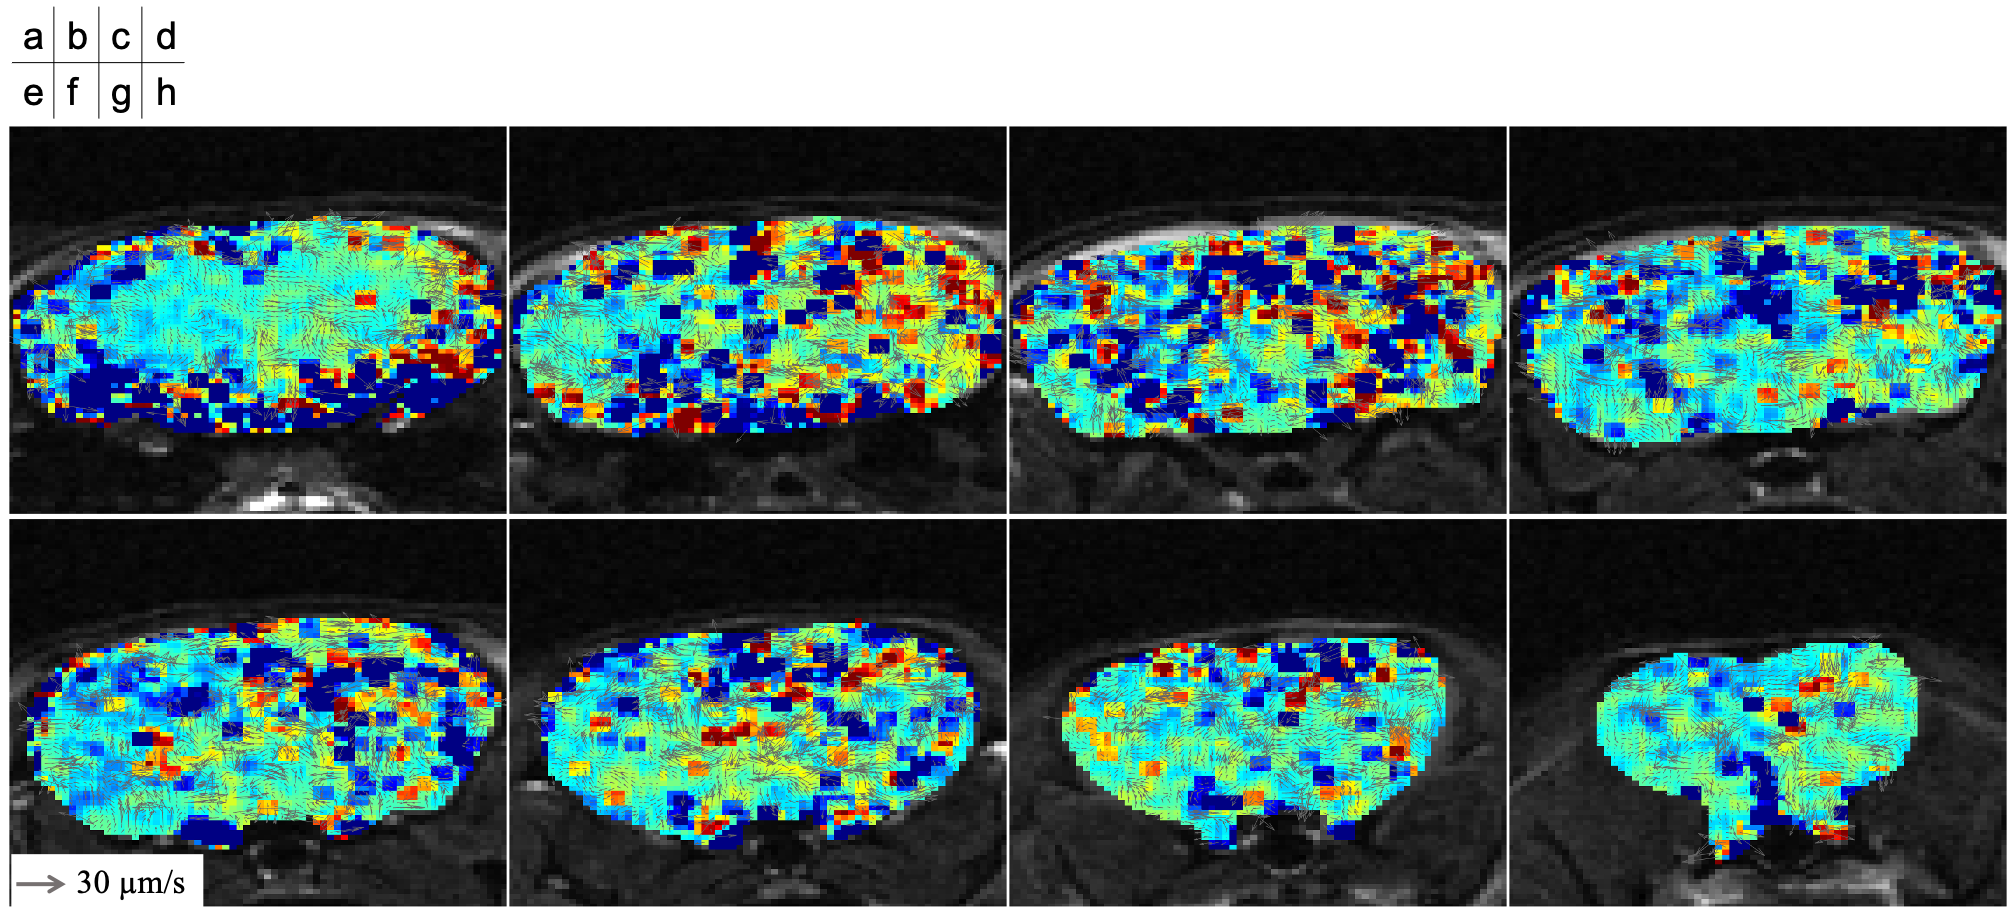
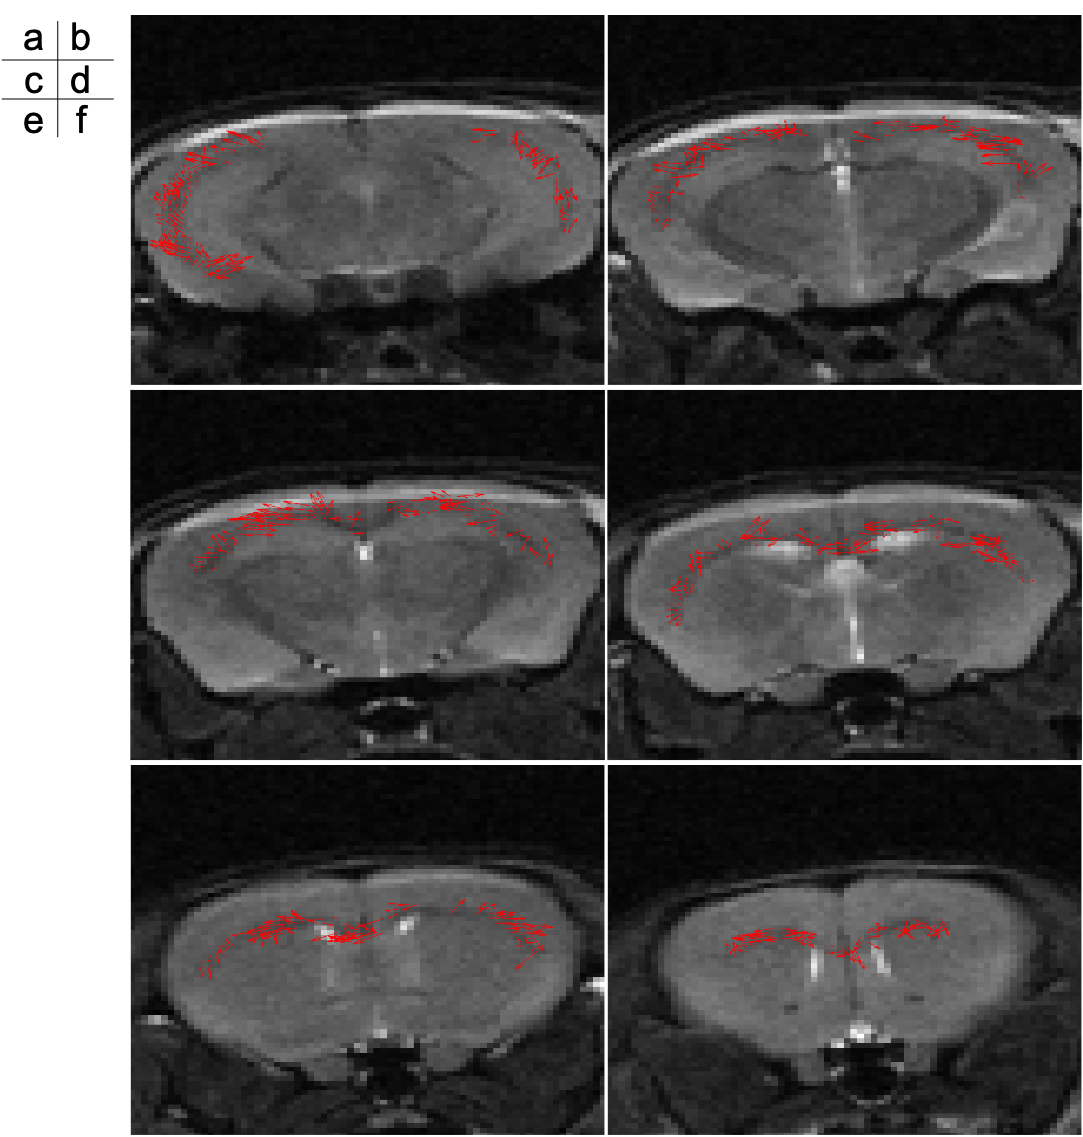
T2-weighted images of the mouse were shown in Figure 1. The mouse brain region was manually segmented. The 3D velocity distribution of CSF and ISF flows in the mouse brain was exhibited in Figure 2. The velocity in lateral and 3rd ventricles was obviously higher than that in the brain parenchyma. Figure 3 presented the velocity vector for the in-plane direction in the corpus callosum. The results looked like to visualize the flow along the corpus callosum.Discussion
This study demonstrated a feasibility of quantitative visualization of CSF and ISF flows in the brain based on QSI in combination with STE-EPI. QSI can seize slow flow; however, the long diffusion separation time Δ is needed to measure such the flow. Thus, in this study, STE-based sequence was used to set the long Δ instead of spin echo (SE)-based sequence. Meanwhile, STE sequence provides relatively low signal-to-noise ratio (SNR) compared to SE as well-known; therefore, the 3D acquisition was performed to obtain the sufficient SNR. Application of the QSI framework may reveal the CSF and ISF flows as well as substance transportation in human brain.QSI analysis applied to the mouse brain demonstrated the 3D velocity distribution of the flows. The results seemed to seize the CSF and ISF flows, although the interpretation was not clarified at present. Since the accuracy of the QSI-based velocimetry of a fluid flow was validated in the previous phantom study, the results in the current study were expected to exhibit the flow of the fluid such as CSF, ISF, and blood. In the further research, the flows in each anatomical location of the brain would be investigated by the segmentation because the flows are classified into CSF, ISF, and blood.
There are a few limitations. One of those is a low spatial resolution. The set of the high resolution makes the long acquisition time; additionally, the high resolution causes low SNR because the proton density in a voxel decreases. The solution of these problem should be considered to measure and understand the neurofluid circulation. Another one is an assumption that the CSF and ISF flows are constant during the scan. If the direction and velocity of the flows is changed with time, then it may cause a velocity error of QSI analysis. Investigation of the velocity error may be needed.
In conclusion, QSI analysis based on 3D STE-EPI demonstrated the 3D velocity distribution of CSF and ISF flows in the mouse brain, which seemed to visualize the flows along the corpus callosum.
Acknowledgements
This work was supported by a Grant-in-Aid from the Ministry of Education, Sciences, and Culture of Japan (#26462220). The authors would like to thank Dr. Koichi Oshio at the Keio University School of Medicine for his valuable suggestions. The authors would also like to thank Prof. Yutaka Imai for his MRI assistance.References
1. Brinker T, Stopa E, Morrison J, Klinge P. A new look at cerebrospinal fluid circulation. Fluids and barriers of the CNS. 2014; 11:10.
2. Jessen NA, Munk AS, Lundgaard I, Nedergaard M. The Glymphatic System: A Beginner's Guide. Neurochemical research. 2015; 40:2583-2599.
3. Naganawa S, Nakane T, Kawai H, Taoka T. Lack of Contrast Enhancement in a Giant Perivascular Space of the Basal Ganglion on Delayed FLAIR Images: Implications for the Glymphatic System. Magnetic resonance in medical sciences : MRMS : an official journal of Japan Society of Magnetic Resonance in Medicine. 2017; 16:89-90.
4. Mestre H, Tithof J, Du T, et al. Flow of cerebrospinal fluid is driven by arterial pulsations and is reduced in hypertension. Nature communications. 2018; 9:4878.
5. Taoka T, Naganawa S. Glymphatic imaging using MRI. Journal of Magnetic Resonance Imaging. 2020; 51:11-24.
6. Maruyama K, Kamata T, Hattori Y, et al. Feasibility of Quantitative Mapping of Microscopic Cerebrospinal Fluid Motion Based on Q-space Imaging. 2018 Progress in Electromagnetics Research Symposium (PIERS-Toyama). 2018:978-982.
Figures