2933
B1-Compensating RF Excitation for Imaging hyperpolarized 13C nuclei with bSSFP using a 13C Cryo-Coil1Department of Nuclear Medicine, TUM School of Medicine, Klinikum Rechts der Isar, Technical University of Munich, Munich, Germany
Synopsis
Cryogenically cooled transmit/receive RF surface coils (cryocoils) can improve signal-to-noise ratio (SNR) up to 4X1. With flat profile RF pulses, surface coil excitation profiles are highly inhomogeneous, complicating the use of most pulse sequences, and especially the fast and efficient bSSFP sequence. A transmit B1-compensating RF pulse that produces uniform excitation with a Tx/Rx 13C cryo-coil was developed and tested in 3D-FLASH and 3D-bSSFP. Thermal 13C phantom imaging showed a regional uniform excitation, and proof-of-concept time-resolved 3D bSSFP imaging of hyperpolarized [13C]urea was demonstrated in mice.
Introduction
Cryogenically-cooled 13C surface coils can improve MRI signal-to-noise ratio by up to 4X over conventional coils, but suffer from inhomogeneous transmit and receive B1 field. Varying B1 and thus flip angle distributions with distance from the coil impair the use of many pulse sequences that depend on uniform excitation or refocusing over space. This is particularly problematic for bSSFP, which is otherwise highly advantageous for hyperpolarized 13C imaging, due to its speed and efficient use of non-renewable polarization. This work overcomes this limitation by applying spatially-shaped radiofrequency (RF) excitation pulses that compensate for coil B1 variation to produce more-uniform excitation profiles within a defined region.Methods
Phantom: 50ml Falcon Tube containing 2M [13C]urea and 2mM DOTAREM (T1=858ms, T2=90ms).Animal: Healthy black-6 mouse.
Hyperpolarization: HyperSense DNP polarizer (Oxford Instruments). 190µl of 80mM Hyperpolarized [1-13C]urea were injected via tail vein catheter.
Imaging System: 7T small animal MRI (Agilent/GE/Bruker) with a 13C transmit-receive 20mm CryoProbeTM (Bruker) with cryogenically cooled with helium to approximately 30K/77K (coil/preamplifier) and a 1H 86mm volume resonator (Bruker).
Coil Transmit B1 Profile: The B1 map (fig. 1a) of the 13C cryo-coil was generated from FLASH images of a [13C]urea phantom with varying RF power. An exponential function was fit to the B1 map to determine a B1 profile along the central “y” axis perpendicular the coil (fig. 1b).
B1-Compensating Excitation: An RF pulse was designed by taking the mirrored inverse B1 profile (fig. 1c) and its Fourier transform (small tip angle approximation, fig. 1d). The time-bandwidth product of the resulting RF pulse is BWfac = 15.4626 Hz*s.
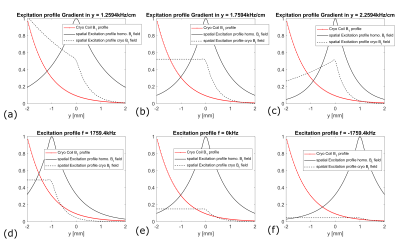
Bloch simulations: The spatial excitation profile of the designed RF pulse depending on the gradient strength and the frequency of the RF pulse was simulated2 for a uniform and a nonuniform B1 field (fig 2).
MR Measurements:
Phantom Imaging: A 3D-FLASH sequence was implemented with the shaped RF pulse (duration=5ms, BW=3.0925kHz, Δf=5.2770kHz, Gy=1.759kHz/cm). The frequency offset positioned the excitation profile peak at Δy=38mm from the coil surface. The flip angle was set to approximately 30°.
In Vivo Imaging: A 3D-bSSFP sequence was implemented (fig. 3) with the shaped RF pulse (duration=1.25ms, BW=12.37kHz, Δf=-10.556kHz, Gy=7.0360kHz/cm). The frequency offset from the [13C]urea peak positioned the peak of the pulse excitation profile at Δy=23 mm from the coil surface. This sequence was tested on the healthy mouse after hyperpolarized [13C]urea injection. Imaging parameters were matrix=30x32x20, FOV=30x32x20mm3, TR=5.5ms, time per 3D-image=3.52s. The flipangle was set to approximately 4°.
Results
Bloch simulations using the coil and RF pulse B1 spatial profiles revealed that, for a pulse length of 5ms (BW=3.0925kHz), a gradient Gy=1.759 kHz/cm most effectively compensates the B1 profile of the coil (fig. 2a-c). Furthermore, changing the frequency of the pulse shifts the excitation slice, changing the size of and moving the excited region relative to the coil (fig. 2d-e). At the center of the pulse, simulated |Mxy| depended sinusiodally on B1.Phantom: The B1 map (fig. 4a) and the axial FLASH image (fig. 4b) show a similar signal intensity distribution. By dividing the two maps (fig. 4c), it can be shown that the ratio of the signal intensities is homogeneous over a broad range.
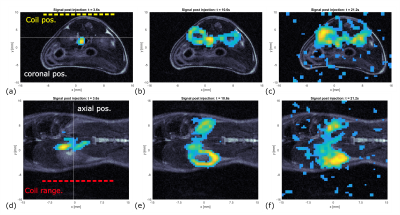
In vivo: An influx through the vena cava of the hyperpolarized signal can be seen 3.6s after the injection, followed by a perfusion of the kidneys (fig. 5). The distribution of the hyperpolarized signal matched the anatomy of the mouse very well. Signal was observed for ~25s.
Discussion
The broad region of uniform ratio between the phantom FLASH image and B1 map indicates that the transmit B1 is being effectively compensated in the FLASH sequence, and a uniform flip angle is being produced. The remaining variation in signal intensity is due to the coil receive B1, which is consistent between the two sequences.Using the Fourier transform to calculate the shaped RF pulse time profile from the desired spatial profile works only for low flip angles. If higher flipangles are desired, the Shinnar-Le Roux Algorithm or iterative optimization could help to design more-appropriate RF pulses. The simulated excitation profile was so far only done for one repetition and should be extended to include repeated excitations to confirm that the steady-state Mxy does not deviate from the single excitation Mxy.
When using higher RF pulse power, the frequency profiles of the pulses were found to vary from those at lower powers. This complicates B1 calibration of effective flip angles by acquiring multiple 3D datasets with increasing RF power. A potential application of high SNR hyperpolarized [13C]urea 3D-bSSFP would be cardiovascular angiography in mice.
Conclusion
Simulations and thermal phantom measurements showed that a shaped RF pulse can be used to compensate the inhomogeneous B1 excitation profile of a 13C cryo-coil, and that varying the pulse central frequency allows the size of the region of uniform flip angle to be controlled. The shaped RF pulse was implemented in a 3D-bSSFP sequence and time resolved 1mm3 resolution perfusion imaging of hyperpolarized [13C]urea was performed in a mouse.Acknowledgements
This project has received funding from the European Union’s Horizon 2020 research and innovation program under grant agreement No 820374. The authors thank Sandra Sühnel for the help with the animal study and Frits van Heijster with the handling of the DNP polarizer.References
- Sack M, Wetterling F, Sartorius A, et al. Signal‐to‐noise ratio of a mouse brain 13C CryoProbe™ system in comparison with room temperature coils: spectroscopic phantom and in vivo results.
- Bloch Equation Simulator. Hargreaves B, http://mrsrl.stanford.edu/~brian/blochsim/ Accessed November 9, 2021.
Figures

(a) B1 Map of the 13C Cryo Coil. The position of the coil is indicated by the the dotted yellow line. (b) B1 profile away from the coil with the fitted exponential in red. (c) Desired pulse shape in space, which is the mirrored inverse of the fitted B1 profile in (b). (d) Magnitude and phase of the pulse that generates the pulse shape in (c). The pulse was generated by taking the Fourier Transfrom of the pulse shape (c).


