2924
OptiPulse: a flexible optimization framework for short water-selective radiofrequency pulse design
Xavier Sieber1,2, Jessica A. M. Bastiaansen1,2,3,4, Christopher W. Roy1,2, Jonas Richiardi1,2, Matthias Stuber1,2, and Ruud B. van Heeswijk1,2
1Department of Medical Radiology, Lausanne University Hospital (CHUV), Lausanne, Switzerland, 2University of Lausanne (UNIL), Lausanne, Switzerland, 3Department of Diagnostic, Interventional and Pediatric Radiology (DIPR), Inselspital, Bern University Hospital, University of Bern, Bern, Switzerland, 4Translational Imaging Center, Sitem-insel, Bern, Switzerland
1Department of Medical Radiology, Lausanne University Hospital (CHUV), Lausanne, Switzerland, 2University of Lausanne (UNIL), Lausanne, Switzerland, 3Department of Diagnostic, Interventional and Pediatric Radiology (DIPR), Inselspital, Bern University Hospital, University of Bern, Bern, Switzerland, 4Translational Imaging Center, Sitem-insel, Bern, Switzerland
Synopsis
We present a flexible optimization framework to design spectral-selective radiofrequency pulses using numerical optimization on Bloch equation simulation. The RF pulse performance is assessed using a composite loss function for both fat suppression and power requirement. The framework was used to design three binomial (1-1, 1-2-1 and 1-3-3-1) and one cubic B-splines interpolated RF pulses. These pulses were then tested in vitro as well as in vivo in the knee and in the heart, where they demonstrated robust fat suppression comparable to a state-of-the-art water-selective pulse.
Background
Highly effective water-excitation radiofrequency (RF) pulses that enable lipid suppression have recently been reported1,2. These pulses have mostly been designed analytically and optimized experimentally, and are thus limited to low-dimensional parameter optimization (i.e. fewer than 4 parameters). These constraints limit the optimization process to a small domain of solutions that may not necessarily include the optimum. In the case of high-resolution gradient-recalled-echo (GRE) imaging, short RF pulses are mandatory to reach short scan duration.We therefore propose a flexible and efficient method for optimizing water-selective RF pulses using up to at least 10 pulse parameters (OptiPulse). We exploit simplicial homology global optimization (SHGO3) to optimize the parameters of the pulses with respect to a loss function that is computed from the frequency response simulated with the Bloch equations. The goal of this study was thus to test the optimization framework by designing several pulses with an increasing number of optimizable parameters and to compare the resulting images to those obtained with an analytically optimized RF pulse (LIBRE2) in a phantom, in the knee and the heart.
Methods
The optimization of binomial and B-splines4 interpolated pulses is performed at 3T for a RF excitation angle of 8° (Figure 1). In the case of binomial pulses, each sub-pulse (2, 3, or 4 sub-pulses in total) has two optimization parameters: the phase and offset frequency. The B-splines pulse has 10 optimization parameters: five for the amplitude and five for the phase. Third-order B-splines are used to interpolate a curve between optimized parameter values. The transverse magnetization frequency response Mxy is then computed using a Bloch-equation simulation of 200 isochromats with offset frequencies uniformly distributed between –1000Hz to 1000Hz5. The pulse performance is assessed with a composite loss function 𝓛:$$\mathcal{L} = \frac{[\|M_{xy}\|_2]_f}{[\|M_{xy}\|_2]_w} + \frac{\lambda_1}{[\|M_{xy}\|_2]_w} + \lambda_2 ([\|M_{xy}\|_2]_f)^2 \hspace{30pt} (Eq.1)$$
where P is the vector containing the pulse parameters, λ1=0.01 and λ2=400 are regularization coefficients, and ||...||2 is the L2 norm. The norms are averaged over the water ([...]w: -50 to 50 Hz) or fat ([...]f: -540 to -340 Hz) frequencies. By minimizing Eq. 1, the maximum fat-water contrast is enforced by the ratio of the fat magnetization over water magnetization, while λ1 enforces water excitation and λ2 imposes a minimum around fat. The minimization is performed with SHGO3, an optimizer for black-box and derivative-free problems.
Four pulses with a 1ms duration each were optimized: a 1-1, a 1-2-1, and a 1-3-3-1 binomial pulse, and a 10-point B-splines interpolated pulse. The pulses were implemented on a 3T clinical scanner (Siemens Prisma) in a 3D radial GRE pulse sequence with TE=2.13ms. The simulated pulses were validated in a three-compartment phantom containing agar gels and lipids that simulate blood, muscle, and fat, by comparing the obtained images to acquisitions without fat suppression and to those acquired with a LIBRE water-excitation pulse6. The knees of five healthy volunteers (31±7y) were scanned using the same pulses, and the fat and muscle SNR as well as the muscle-fat CNR were measured. ANOVA with post-hoc Tukey tests were used for comparison. Finally, the two best performing pulses were used to acquire ECG-triggered respiratory-motion-corrected GRE7 images of a heathy volunteer’s heart.
Results
The simulations resulted in high water-fat contrast, full lipid suppression and robustness to variation in B1 for all investigated pulses (Figure 2 and 3). The simulated frequency responses are very similar among all water-selective pulses. However, the 1-2-1, 1-3-3-1 and B-splines pulses have a suppression “valley” shifted towards the water peak, which is useful considering that lipids also have a significant resonance at 3.11 ppm8.The phantom images show near-complete fat suppression for all four optimized pulses and the suppression is similar to the one of LIBRE (Figure 3C). The 1-1 binomial and the B-splines pulse appear to outperform the LIBRE pulse near the edge of the phantom.
In vivo, each pulse resulted in fat suppression that was comparable to the LIBRE pulse (Figure 4). The optimized pulses were all able to highlight the cartilage by suppressing bone fat while also maintaining high muscle signal. The 1-1 and B-splines pulses images show a more homogeneous suppression of the bone fat across all volunteers, their respective CNRs are comparable to those of LIBRE pulse (Figure 2). Interestingly, the B-splines and 1-3-3-1 pulses standard deviations (SD) are significantly lower than the one of the other pulses.
Additionally, the heart scans show that the pulses transfer well to the thorax, where larger B0 inhomogeneities are encountered. The 1-1 and B-Splines scans results in similar fat suppression as the scan using LIBRE, while the B-Splines pulse results in the complete suppression of epicardial fat signal (Figure 5).
Conclusion
The RF pulses presented here performed well in simulation, phantom and in vivo studies, and matched the performance of the analytically optimized LIBRE water excitation pulse. This demonstrates that the OptiPulse framework can find at least a local optimum in many different parameters spaces, making the framework physically sound.In conclusion, the simplicity and flexibility of the OptiPulse framework opens avenues in RF pulse design for many applications and could be expanded to help address more challenging problems such as spatial selectivity or low field strength fat suppression.
Acknowledgements
This research was supported by the Swiss National Science Foundation (32003B_182615 to MS).References
- Ye, Y, Hu, J. and Haacke, M. (2014). Robust Selective Signal Suppression Using Binomial Off-Resonant Rectangular (BORR) Pulses. Journal of magnetic resonance imaging: JMRI. 39. 10.1002/jmri.24149.
- Bastiaansen, J.A. and Stuber, M. (2018), Flexible water excitation for fat-free MRI at 3T using lipid insensitive binomial off-resonant RF excitation (LIBRE) pulses. Magn. Reson. Med, 79: 3007-3017. https://doi.org/10.1002/mrm.26965
- Endres, S.C., Sandrock, C. and Focke, W.W. A simplicial homology algorithm for Lipschitz optimisation. J Glob Optim 72, 181–217 (2018). https://doi.org/10.1007
- de Boor, Carl, (1962), Bicubic Spline Interpolation, Journal of Mathematics and Physics, 41, doi: 10.1002/sapm1962411212.
- de Graaf, R.A. (2007). Magnetic Resonance Imaging. In In Vivo NMR Spectroscopy, R.A. de Graaf (Ed.). https://doi.org/10.1002/9780470512968.ch4
- Colotti, R., Omoumi, P., van Heeswijk, R.B. and Bastiaansen, J.A. (2019), Simultaneous fat-free isotropic 3D anatomical imaging and T2 mapping of knee cartilage with lipid-insensitive binomial off-resonant RF excitation (LIBRE) pulses. J. Magn. Reson. Imaging, 49: 1275-1284. https://doi.org/10.1002/jmri.26322
- Roy, C.W., Heerfordt, J., Piccini, D. et al. Motion compensated whole-heart coronary cardiovascular magnetic resonance angiography using focused navigation (fNAV). J Cardiovasc Magn Reson 23, 33 (2021). https://doi.org/10.1186/s12968-021-00717-4
- Wang, X., Hernando, D. and Reeder, S.B. (2016), Sensitivity of chemical shift-encoded fat quantification to calibration of fat MR spectrum. Magn. Reson. Med., 75: 845-851. https://doi.org/10.1002/mrm.25681
Figures
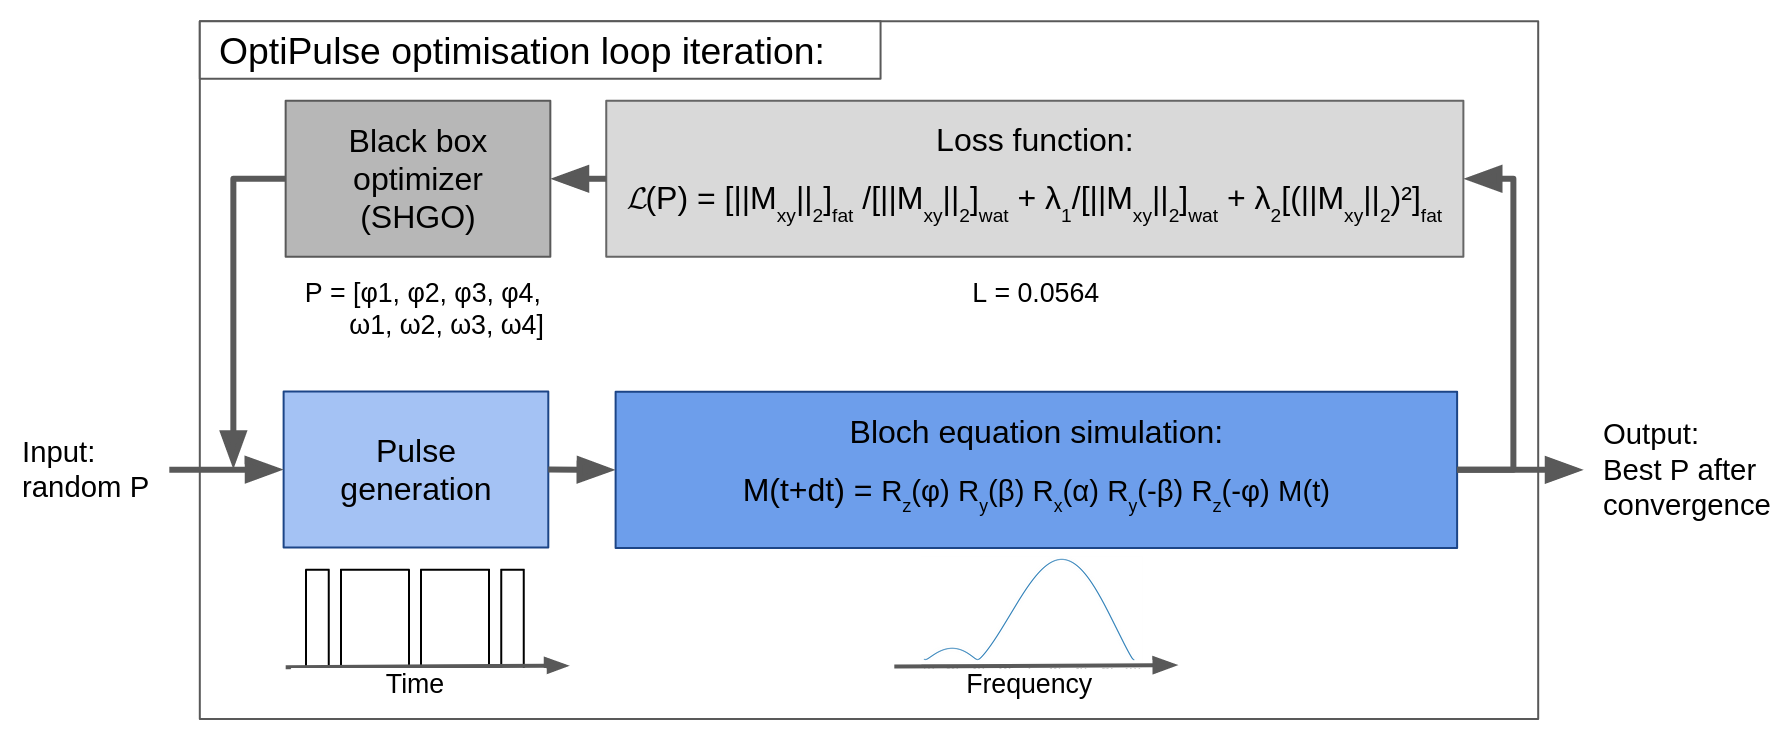
Figure 1. Optimization loop diagram. A random set of parameters within the parameter space is initialized before being used to generate the amplitude and phase time series of the pulse. The pulse is then used to iteratively compute the spin response for 200 different isochromats using Bloch equation simulations in the rotating frame of reference. Finally, the frequency response is evaluated by the loss function and a new parameter vector P, suggested by SHGO, is used to perform the next optimization iteration. The process stops when convergence is reached.
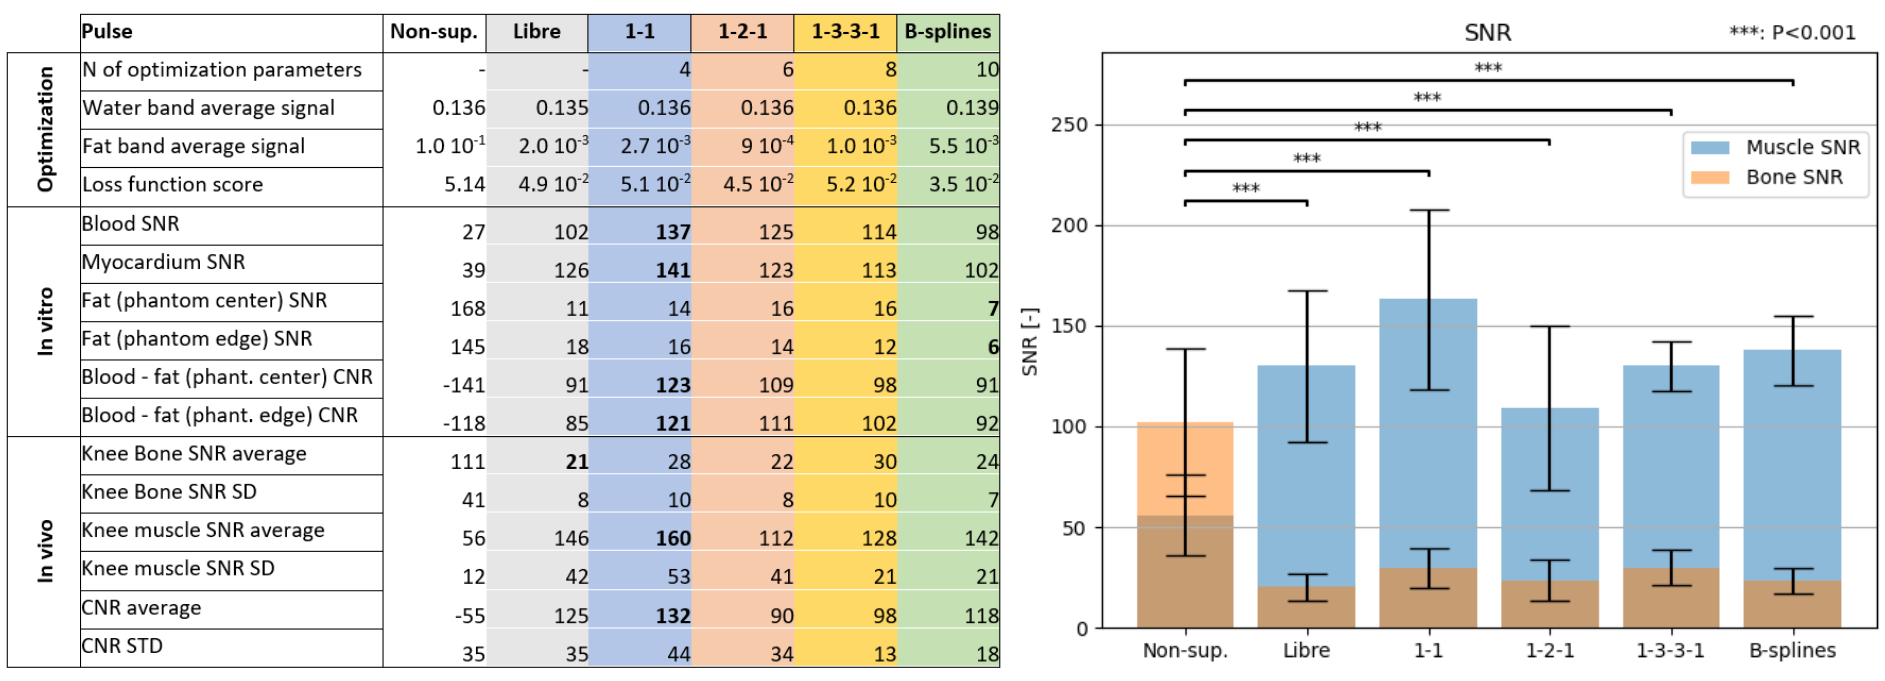
Figure 2. A) Results table of the optimization, phantom scans, and in vivo validations (left). In the optimization part of the table, the pulses are scaled to reach an
excitation of 8° for water before measuring water and fat band
averages. The loss function score is the evaluation of the frequency
response of the pulse with Eq. 1. The phantom center and edge locations
are indicated in Figure 3. The SNR average and SD values are computed
over the five volunteers and the measurement ROIs are shown in Figure 4. B) SNR bar plot with standard deviation and post-hoc Tukey tests (right).
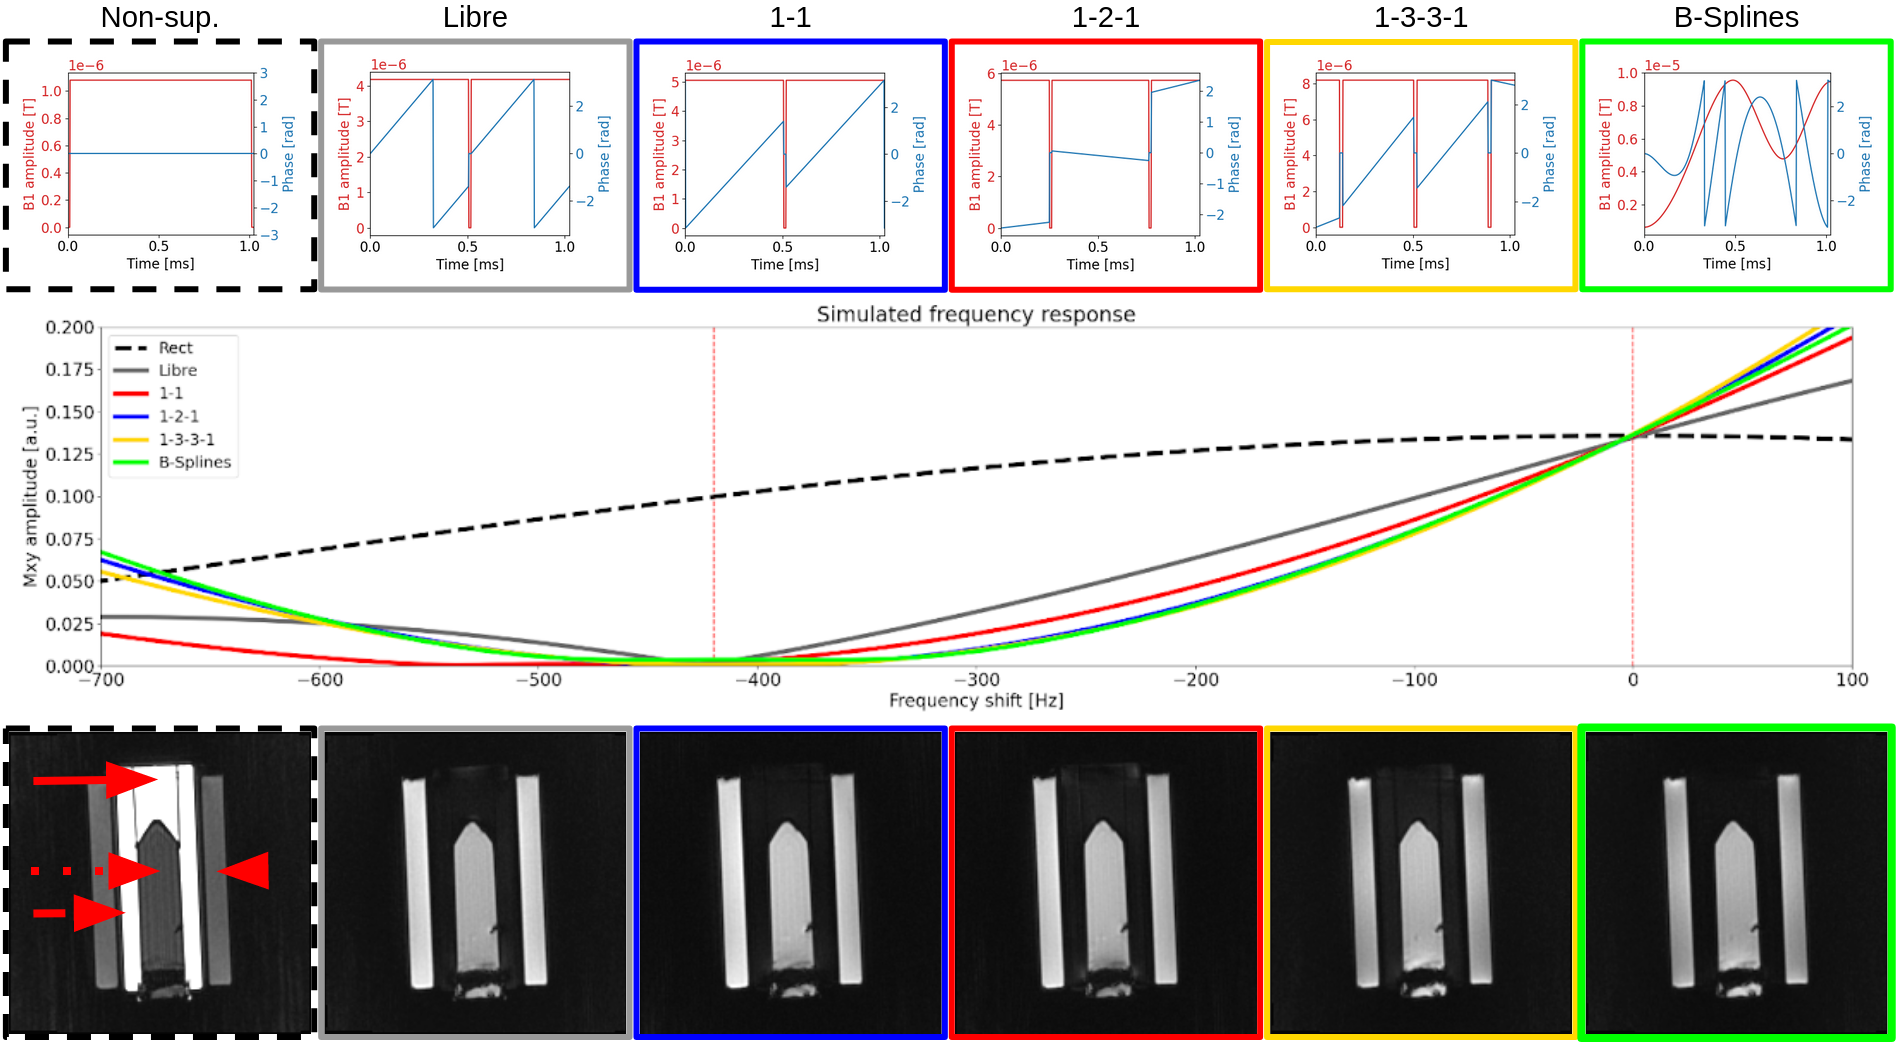
Figure 3. Simulation and phantom results. The top row shows each pulse amplitude (red) and phase (blue) as they were tested in the phantom, knees and heart. The middle row displays the frequency response simulation of each pulse. In the first phantom image (bottom row), the solid, dotted, and dashed arrow and the arrowhead refer to the location of, respectively, phantom edge fat, blood, center fat, and muscle compartments where the SNRs were measured and compared between pulses.
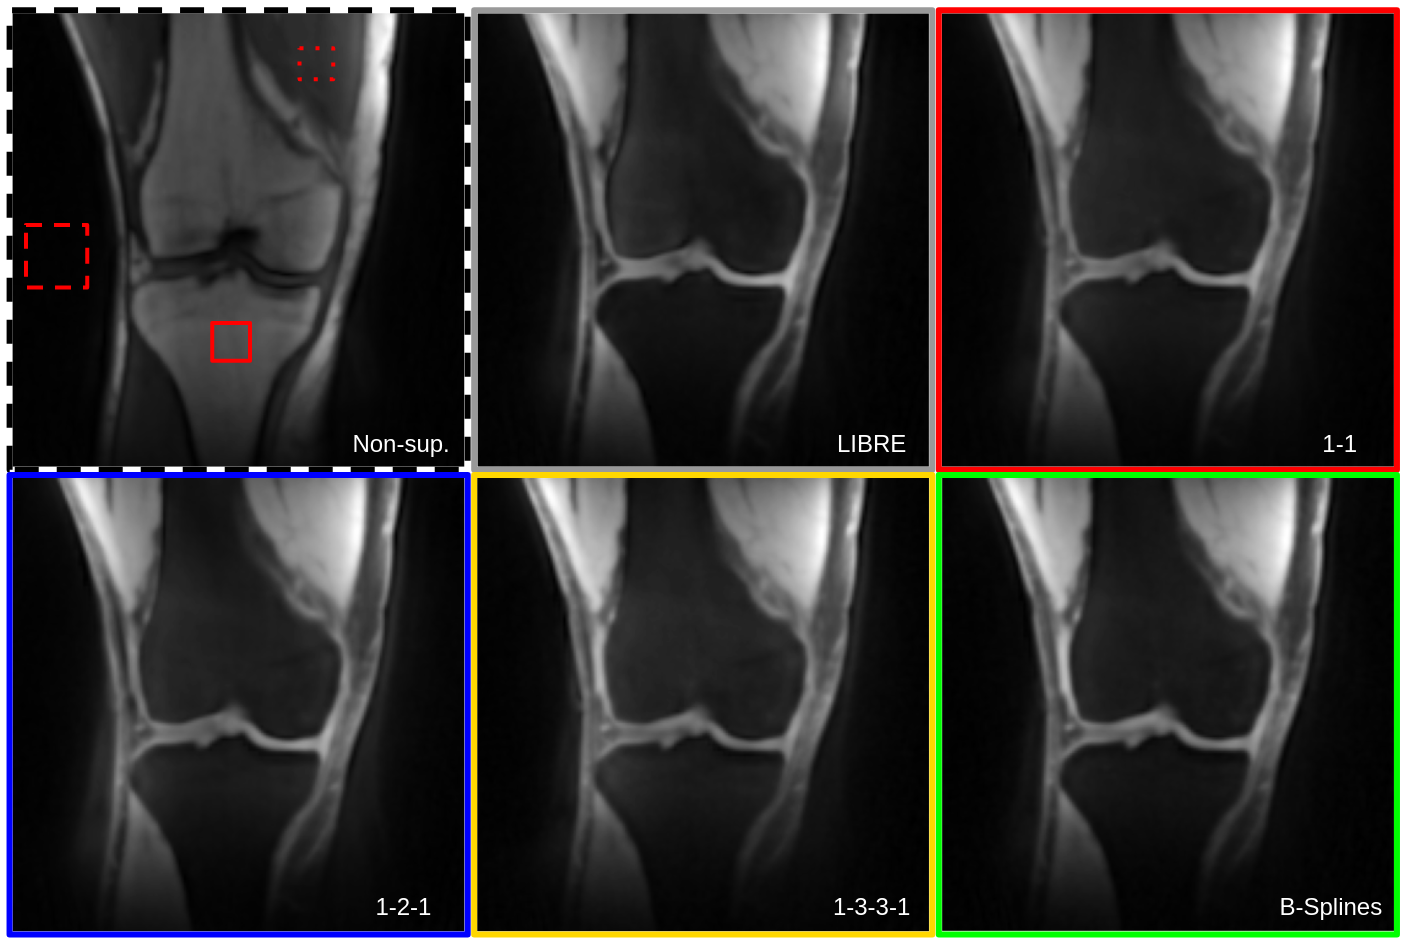
Figure 4. 3D radial GRE knee scans of a healthy volunteer. The solid, dotted and dashed squares show the bone fat, muscle and noise ROIs respectively. All the optimized pulses show complete fat suppression in the bones as well as partial subcutaneous fat suppression. The 1-1 and spline pulses achieves similar levels of lipid signal suppression in the bone and subcutaneous tissues the LIBRE RF pulse.
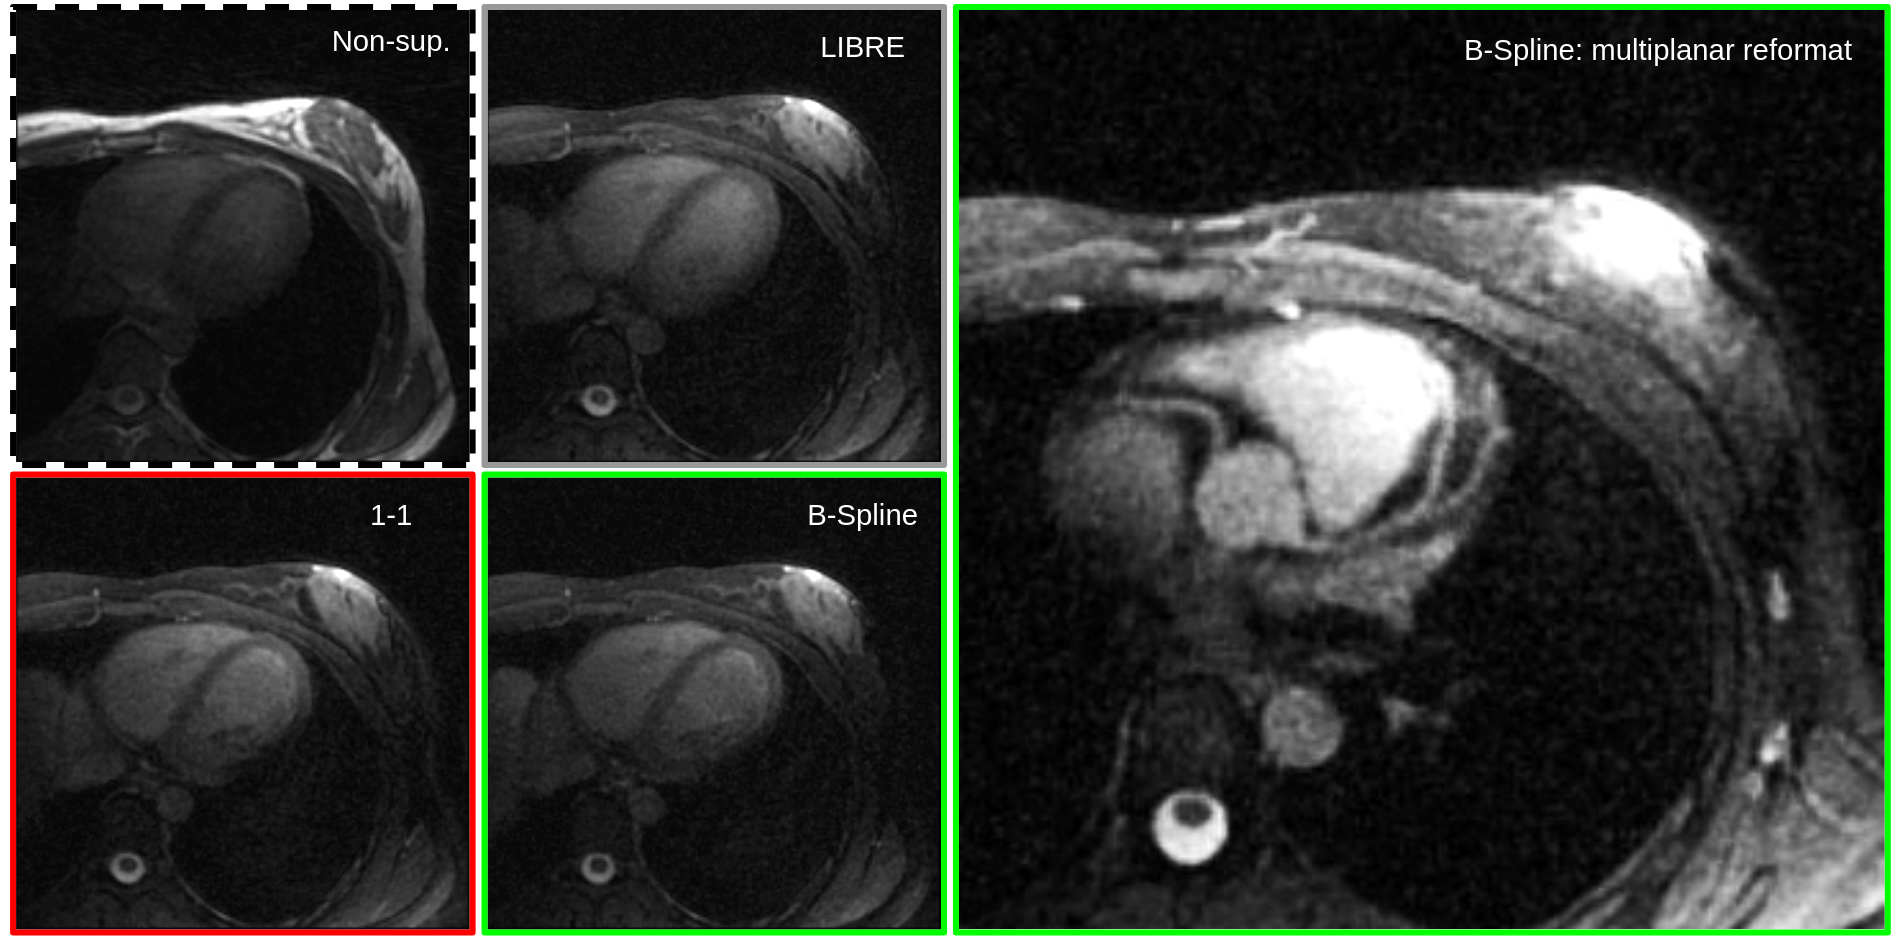
Figure 5. 3D radial GRE heart images of a healthy volunteer. Both the 1-1 and spline pulses result in comparable fat suppression to LIBRE in the chest. A multiplanar reformat of the right and left-anterior descending coronary arteries (right-most image) demonstrates the complete suppression of epicardial fat signal.
DOI: https://doi.org/10.58530/2022/2924