2923
Oxygen induced T1 changes in head and neck anatomical structures
1Department of Clinical Oncology, Nottingham University Hospitals NHS Trust, Nottingham, United Kingdom, 2School of Medicine, University of Nottingham, Nottingham, United Kingdom, 3Department of Systems Biology and Engineering, Silesian University of Technology, Gliwice, Poland, 4Department of Radiology, Nottingham University Hospitals NHS Trust, Nottingham, United Kingdom, 5Radiological Sciences, University of Nottingham, Nottingham, United Kingdom, 6Department of Medical Physics & Clinical Engineering, Nottingham University Hospitals NHS Trust, Nottingham, United Kingdom, 7University of Nottingham Biodiscovery Institute, Nottingham, United Kingdom
Synopsis
Oxygen enhanced MRI (OE-MRI) is a proposed tumour hypoxia imaging technique that is yet to be widely applied in the head and neck. 7 participants, 3 with suspected head and neck squamous cell carcinoma (HNSCC) were scanned using 3D spoiled GRE-DIXON. After on air scans, oxygen was delivered via a non-rebreather mask. T1 times were determined on in-phase images. Oxygenation led to statistically significant T1 shortening in CSF, thyroid and neck nodes. OE-MRI shows promise in identifying hypoxic regions in the head and neck. Further work investigating the feasibility of OE-MRI to detect hypoxic regions in HNSCC is warranted.
Introduction
Oxygen Enhanced MRI (OE-MRI) is a technique proposed for studying tumour hypoxia in preclinical1 and clinical settings2. Changes in longitudinal relaxation times (T1), caused by paramagnetic molecular oxygen dissolved in blood plasma, interstitial tissue fluid or intracellular water, can be used to spatially map hypoxic regions. Implementation of this method in the head and neck region would be of clinical value as hypoxia is a recognized cause of radiotherapy treatment resistance in patients with head and neck squamous cell carcinoma (HNSCC)3. In this work we report OE-MRI T1 changes (ΔT1) measured for a range of clinically relevant head and neck structures.Method
Four non-patient volunteers (mean age: 41 years) and three patients with suspected HNSCC (mean age: 48 years) were scanned on a 1.5T Siemens Sola scanner using posterior head and anterior flex coils.Patients were scanned prior to radiotherapy treatment with the OE-MRI sequence included as an addition to a routine clinical MRI examination and performed prior to contrast agent injection. Anatomical images were acquired first in order to identify structures of interest and aid with OE-MRI planning. A 3D spoiled gradient echo DIXON sequence (TE: 2.39 / 4.77ms, TR: 7.3ms, matrix: 128, FOV: 200x200mm, 72 x 2.5mm slices) with two flip angles (FA=2/12 deg) was used to calculate T1 values. A series of baseline air breathing measurements were acquired initially followed by measurements with high flow oxygen inhalation using a non-rebreather face mask (flow >15L/min). Dynamic image acquisitions were corrected for motion using ANTs (Advanced Normalization Tools)4.
Head and neck structures (CSF, thyroid gland, intervertebral discs, healthy lymph nodes, submandibular glands, parotid glands) were delineated on anatomical MR images by a clinical oncologist using ITK-SNAP5 software. Averaged T1 values for 5 initial air (T1Air) and 5 late oxygen (T1O2) scans were calculated using in-phase DIXON images in Matlab (Mathworks). Voxel-wise changes of T1 (ΔT1=T1O2 – T1Air) were displayed as maps and used to calculate ΔT1 in structures of interest. T1 for air and oxygen breathing periods were compared using the Wilcoxon signed rank test. P values of <0.05 were considered significant.
Results
Adequate non-rebreather bag inflation following the commencement of oxygen delivery was noted for all participants. Examples of parametrical ΔT1 maps with structures of interest and pre and post supplemental oxygen T1 histograms are presented in Figure 1. Statistically significant changes of T1 were observed in CSF (ΔT1= -319ms , p=0.016), thyroid (ΔT1= -67ms , p= 0.016),and healthy lymph nodes (ΔT1= -30ms , p= 0.03). Conversely, intervertebral discs, submandibular glands and parotid glands did not show significant differences between T1Air and T1O2. The summary of changes is displayed in Figure 2.Discussion
In this study we present the successful implementation of Oxygen Enhanced MRI in the head and neck region. OE-MRI scans were well tolerated and possible to implement as a part of the routine clinical examination. The data shows heterogeneous response to the oxygen challenge between studied structures. Notably, significant T1 changes observed in healthy thyroid and lymph node tissue highlight promising potential of the technique to detect hypoxic regions in HNSCC. In addition, a consistent and strong oxygen effect on CSF could be used as an inherent quality control OE-MRI reference region. The lack of significant T1 changes in some structures suggests limited sensitivity of the OE-MRI method to oxygenation status in healthy submandibular and parotid glands.Conclusion
In conclusion, our data shows T1 oxygen induced changes that can be used to study hypoxia in head and neck structures relevant for HNSCC tumours. This warrants further work to investigate the use of OE-MRI for identifying HNSCC patients at risk of radiotherapy treatment resistance.Acknowledgements
This work was undertaken at Nottingham University Hospitals NHS Trust with a grant from Nottingham Hospitals Charity (APP2361/N0379).
References
1. O’Connor, J. P. B. et al. (2009) ‘Preliminary study of oxygen-enhanced longitudinal relaxation in MRI: a potential novel biomarker of oxygenation changes in solid tumors’, International journal of radiation oncology, biology, physics, 75(4), pp. 1209–1215.
2. Salem et al. (2019) ‘Oxygen-enhanced MRI Is Feasible, Repeatable, and Detects Radiotherapy-induced Change in Hypoxia in Xenograft Models and in Patients with Non-small Cell Lung Cancer’ Clin Cancer Res, 25(13):3818-3829
3. Brizel DM et al. ‘Tumor hypoxia adversely affects the prognosis of carcinoma of the head and neck’ Int J Radiat Oncol Biol Phys 1997;38:285–9.
4. Avants, B. B. et al. (2011) ‘A reproducible evaluation of ANTs similarity metric performance in brain image registration’, NeuroImage, 54(3), pp. 2033–2044.
5. Yushkevich, P. A. et al. (2006) ‘User-Guided 3D Active Contour Segmentation of Anatomical Structures: Significantly Improved Efficiency and Reliability’, NeuroImage, 31(3), pp. 1116–1128.
Figures
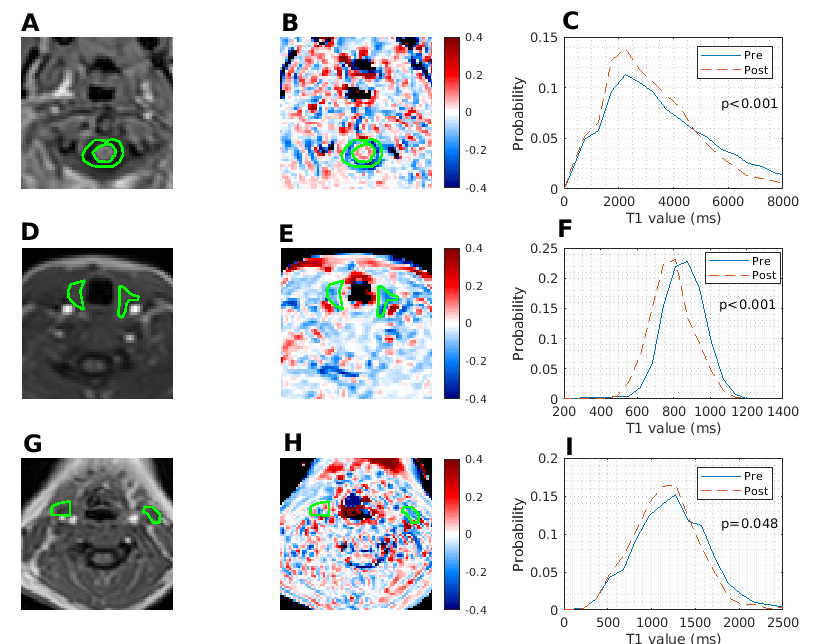
Figure 1: Examples of in-phase DIXON images (A,D,G) with corresponding OE-MRI parametrical ΔT1 maps (B,E,H) for one participant. Regions of interests for CSF (A,B), thyroid gland (D,E) and lymph nodes (G,H) are shown in green alongside the corresponding pre and post supplemental oxygen T1 histograms (C,F,I).
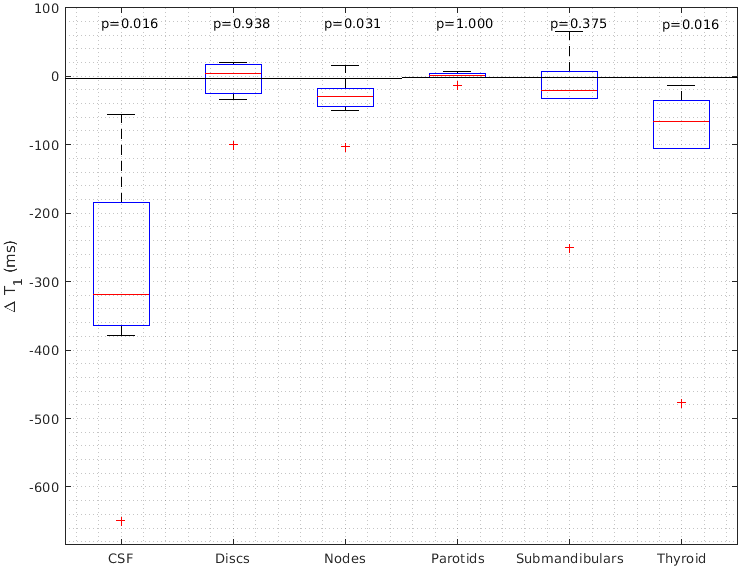
Figure 2: Box plots showing changes of oxygen induced T1 relaxation times for all structures and subjects. T1 times for air and oxygen breathing periods are compared using the Wilcoxon signed rank test.