2920
Gradient based emulation of neuro-electro-magnetic oscillations: A validation technique for MRI-based detection of Biomagnetism1Experimental Physics 5, University of Würzburg, Würzburg, Germany, 2Department of Internal Medicine I, University Hospital Würzburg, Würzburg, Germany, 3Magnetic Resonance and X-ray Imaging Department, Fraunhofer IIS, Fraunhofer Institute for Integrated Circuits IIS, Würzburg, Germany, 4Center of Mental Health, Dept. of Psychiatry, Psychosomatics, and Psychotherapy, University Hospital of Würzburg, Würzburg, Germany, 5Department of Psychology, University of Würzburg, Würzburg, Germany, 6Comprehensive Heart Failure Center (CHFC), University Hospital Würzburg, Würzburg, Germany
Synopsis
Spin-lock based absorption of magnetic oscillations offers potential for direct detection of electrical neuronal activity. We propose a novel versatile validation and calibration technique which paves the way for emulation and quantification of biomagnetic fields. Using ultra-weak gradient waveforms, the method mimics brain activity and thus projects artificial fields onto the tissue under investigation. The method applicable for sequence validation or signal calibration was tested in phantom and in vivo experiments with the built-in gradient system providing sinusoidal field modulations down to 1 nT. It proved to be reliable and reproducible and hence can potentially enable quantification of biomagnetic fields.
Introduction
Spin-lock based fMRI has the potential for direct imaging of neuronal activity [1,2]. Resonant energy absorption from an ultra-weak magnetic field, generated by oscillatory activity patterns (neuro-electro-magnetic oscillations, NEMO), provides a novel contrast mechanism that depends directly on the presence of neuronal activity. In this way, the main disadvantage of BOLD-based fMRI, measuring activity indirectly via the neurovascular coupling, may be overcome. However, the development and validation of spin-lock based fMRI sequences remains a major challenge.The current setups to investigate the interaction of spin ensembles under the influence of a spin-lock pulse and fluctuating magnetic fields are phantom experiments with relatively complicated arrangements. It is common practice to generate the required tiny magnetic oscillations by inserting a dipole antenna into gel or water based phantoms or wrapping them with field-generating coils [1-5]. Additional micro-controllers ensure the control of the required electronic components, as a system to be synchronized to the MRI scanner. However, this complicated experimental setup slows down the development of novel preparation techniques and hinders comparing the results of different working groups. Yet the largest drawback is that real in vivo situation-emulating experiments, in living tissue with external fields generated by an electronic circuit, are not feasible.
We propose a versatile alternative validation method generating extremely weak oscillating magnetic fields by the built-in gradient system within an offcenter slice. In this approach, the already-available standard equipment of the MRI scanner makes additional hardware unnecessary, experiments become standardized and in vivo investigation scans can be realized. In the present work our new technique was successfully tested in both phantom and in vivo experiments.
Methods
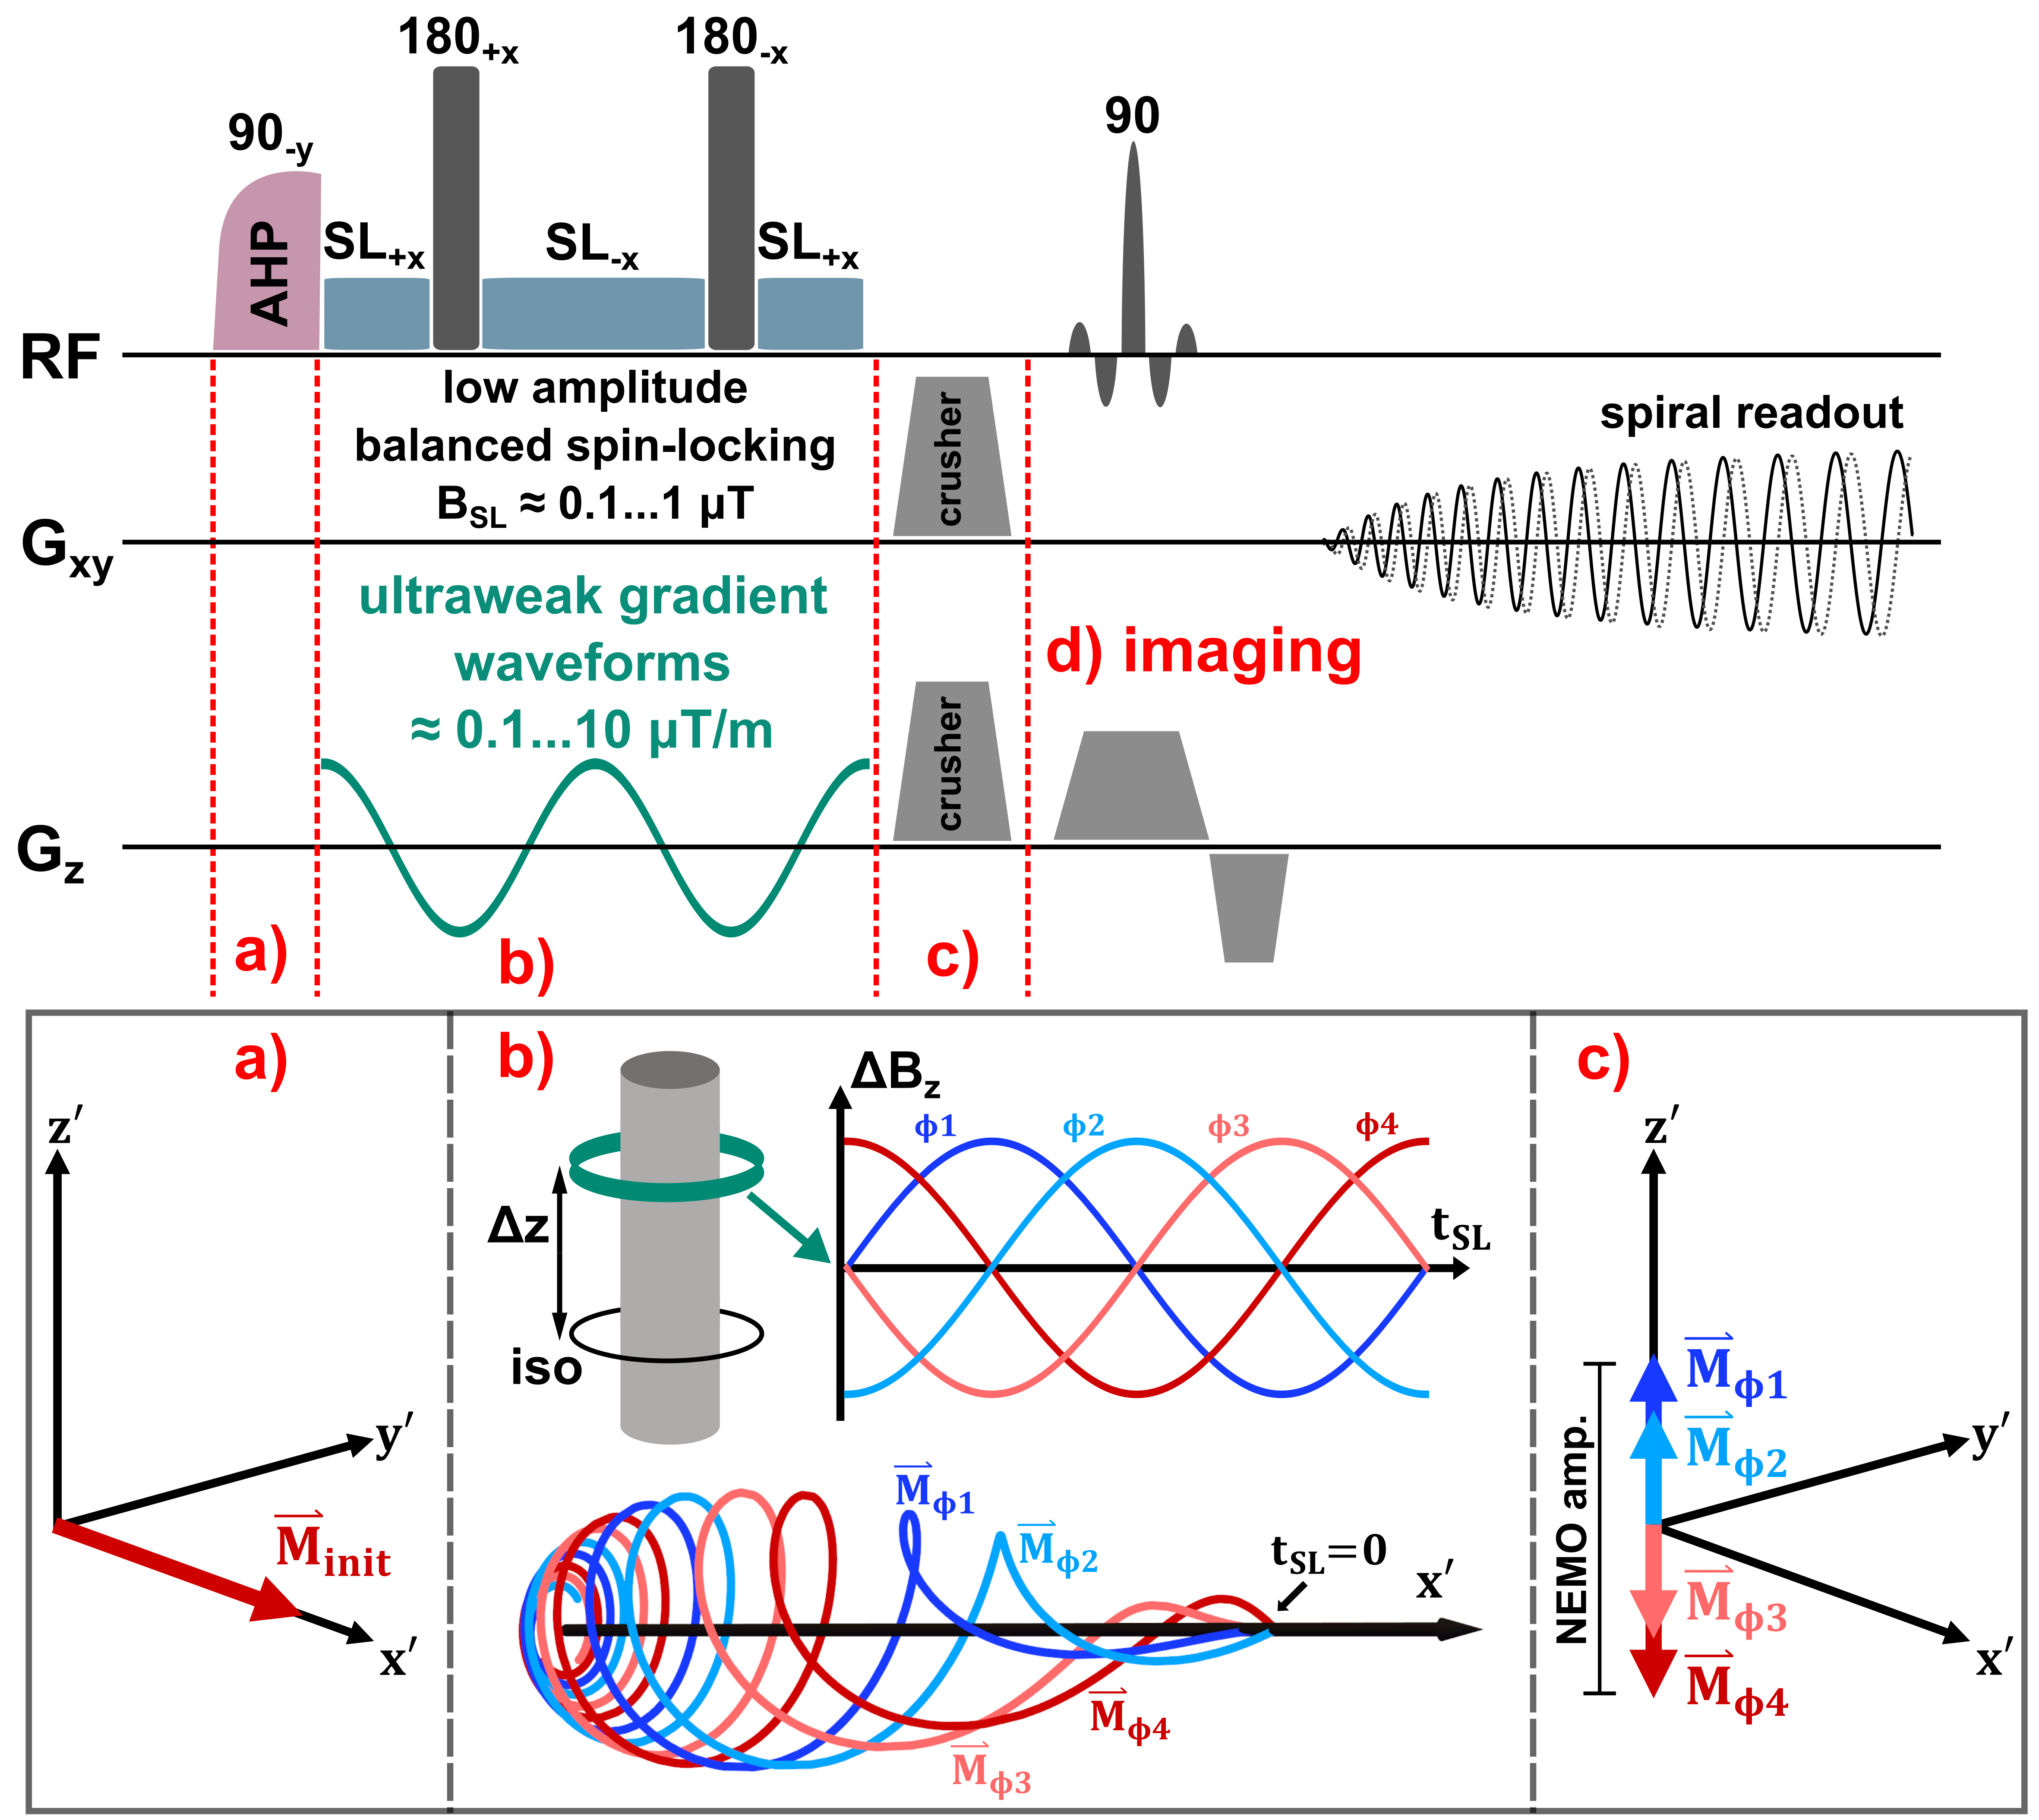
All measurements were carried out on a 3.0 T scanner (MAGNETOM Skyra, Siemens, Erlangen, Germany) using a 20-channel head coil and the standard gradient system (45 mT/m, 200 T/m/s).The proposed validation method, including a neuronal field oscillation mimicking gradient system, was implemented within the open-source Pulseq framework [6] as shown in Figure 1. A balanced spin-lock preparation module [7], compensating for B0 and B1 inhomogeneities, is followed by strong crusher gradients, that dephase magnetization in the transverse plane. The spin-tip component, stored in the longitudinal direction, is used for imaging by a spiral single shot readout [2].
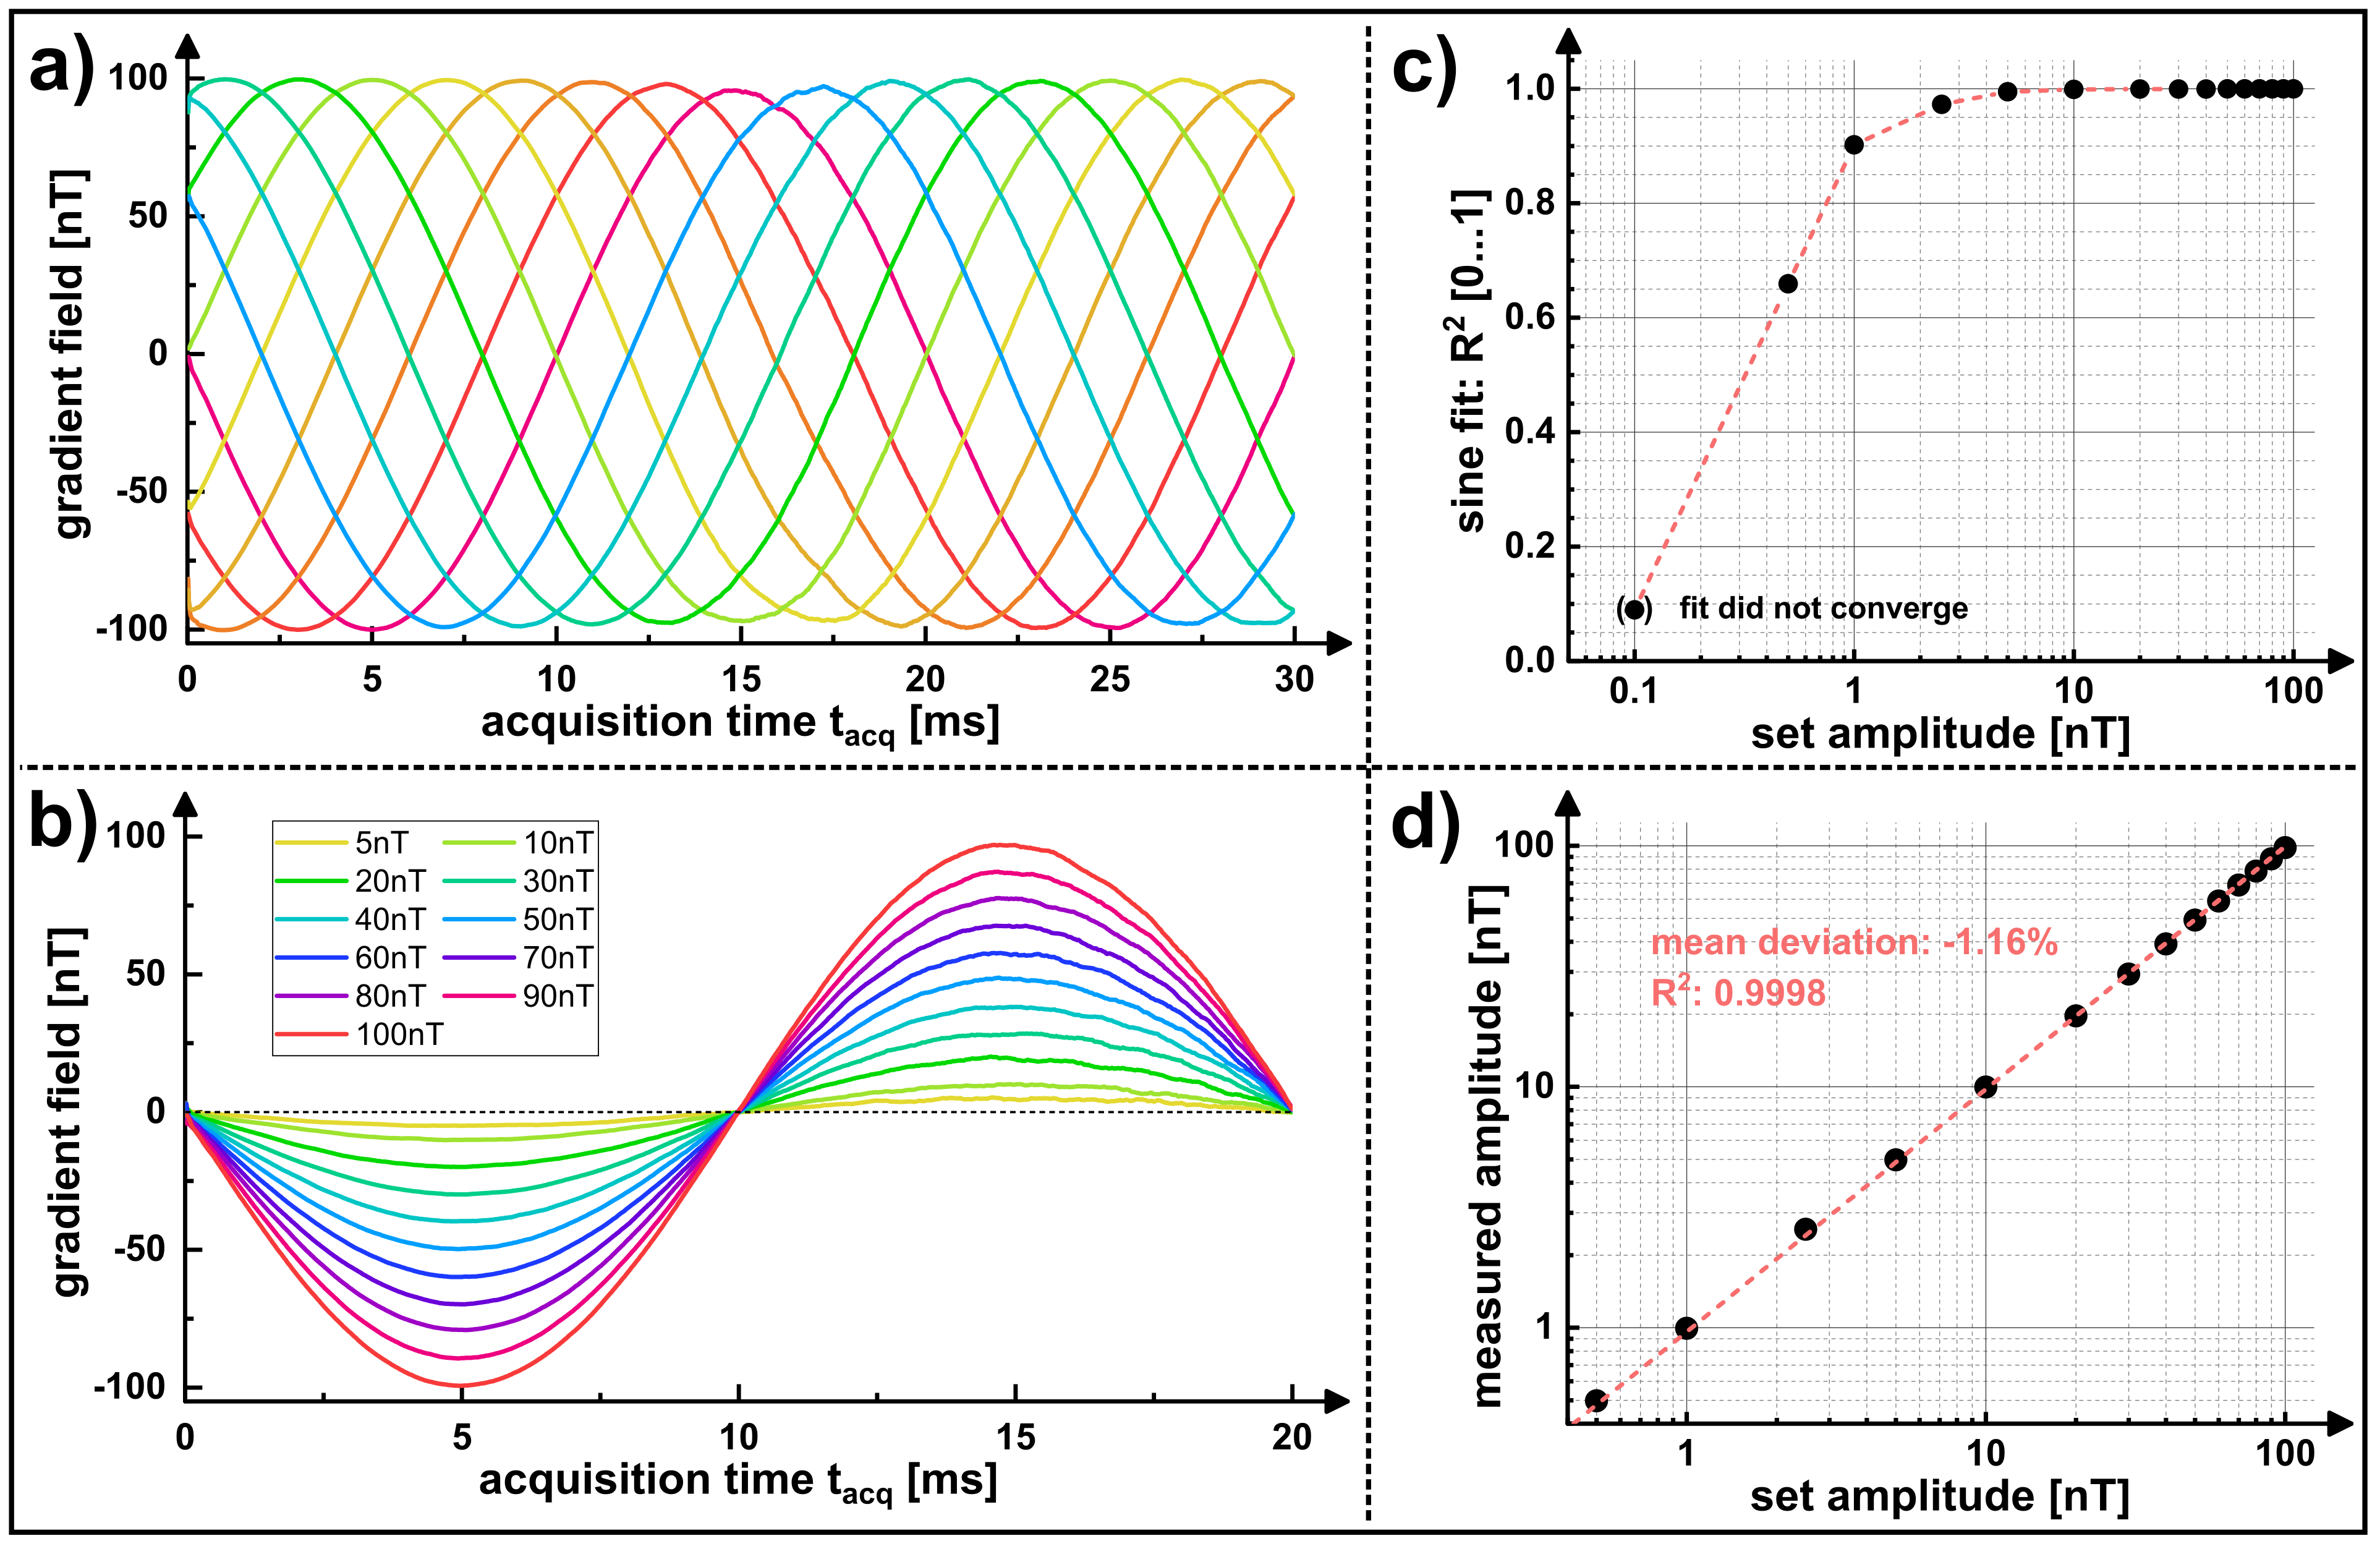
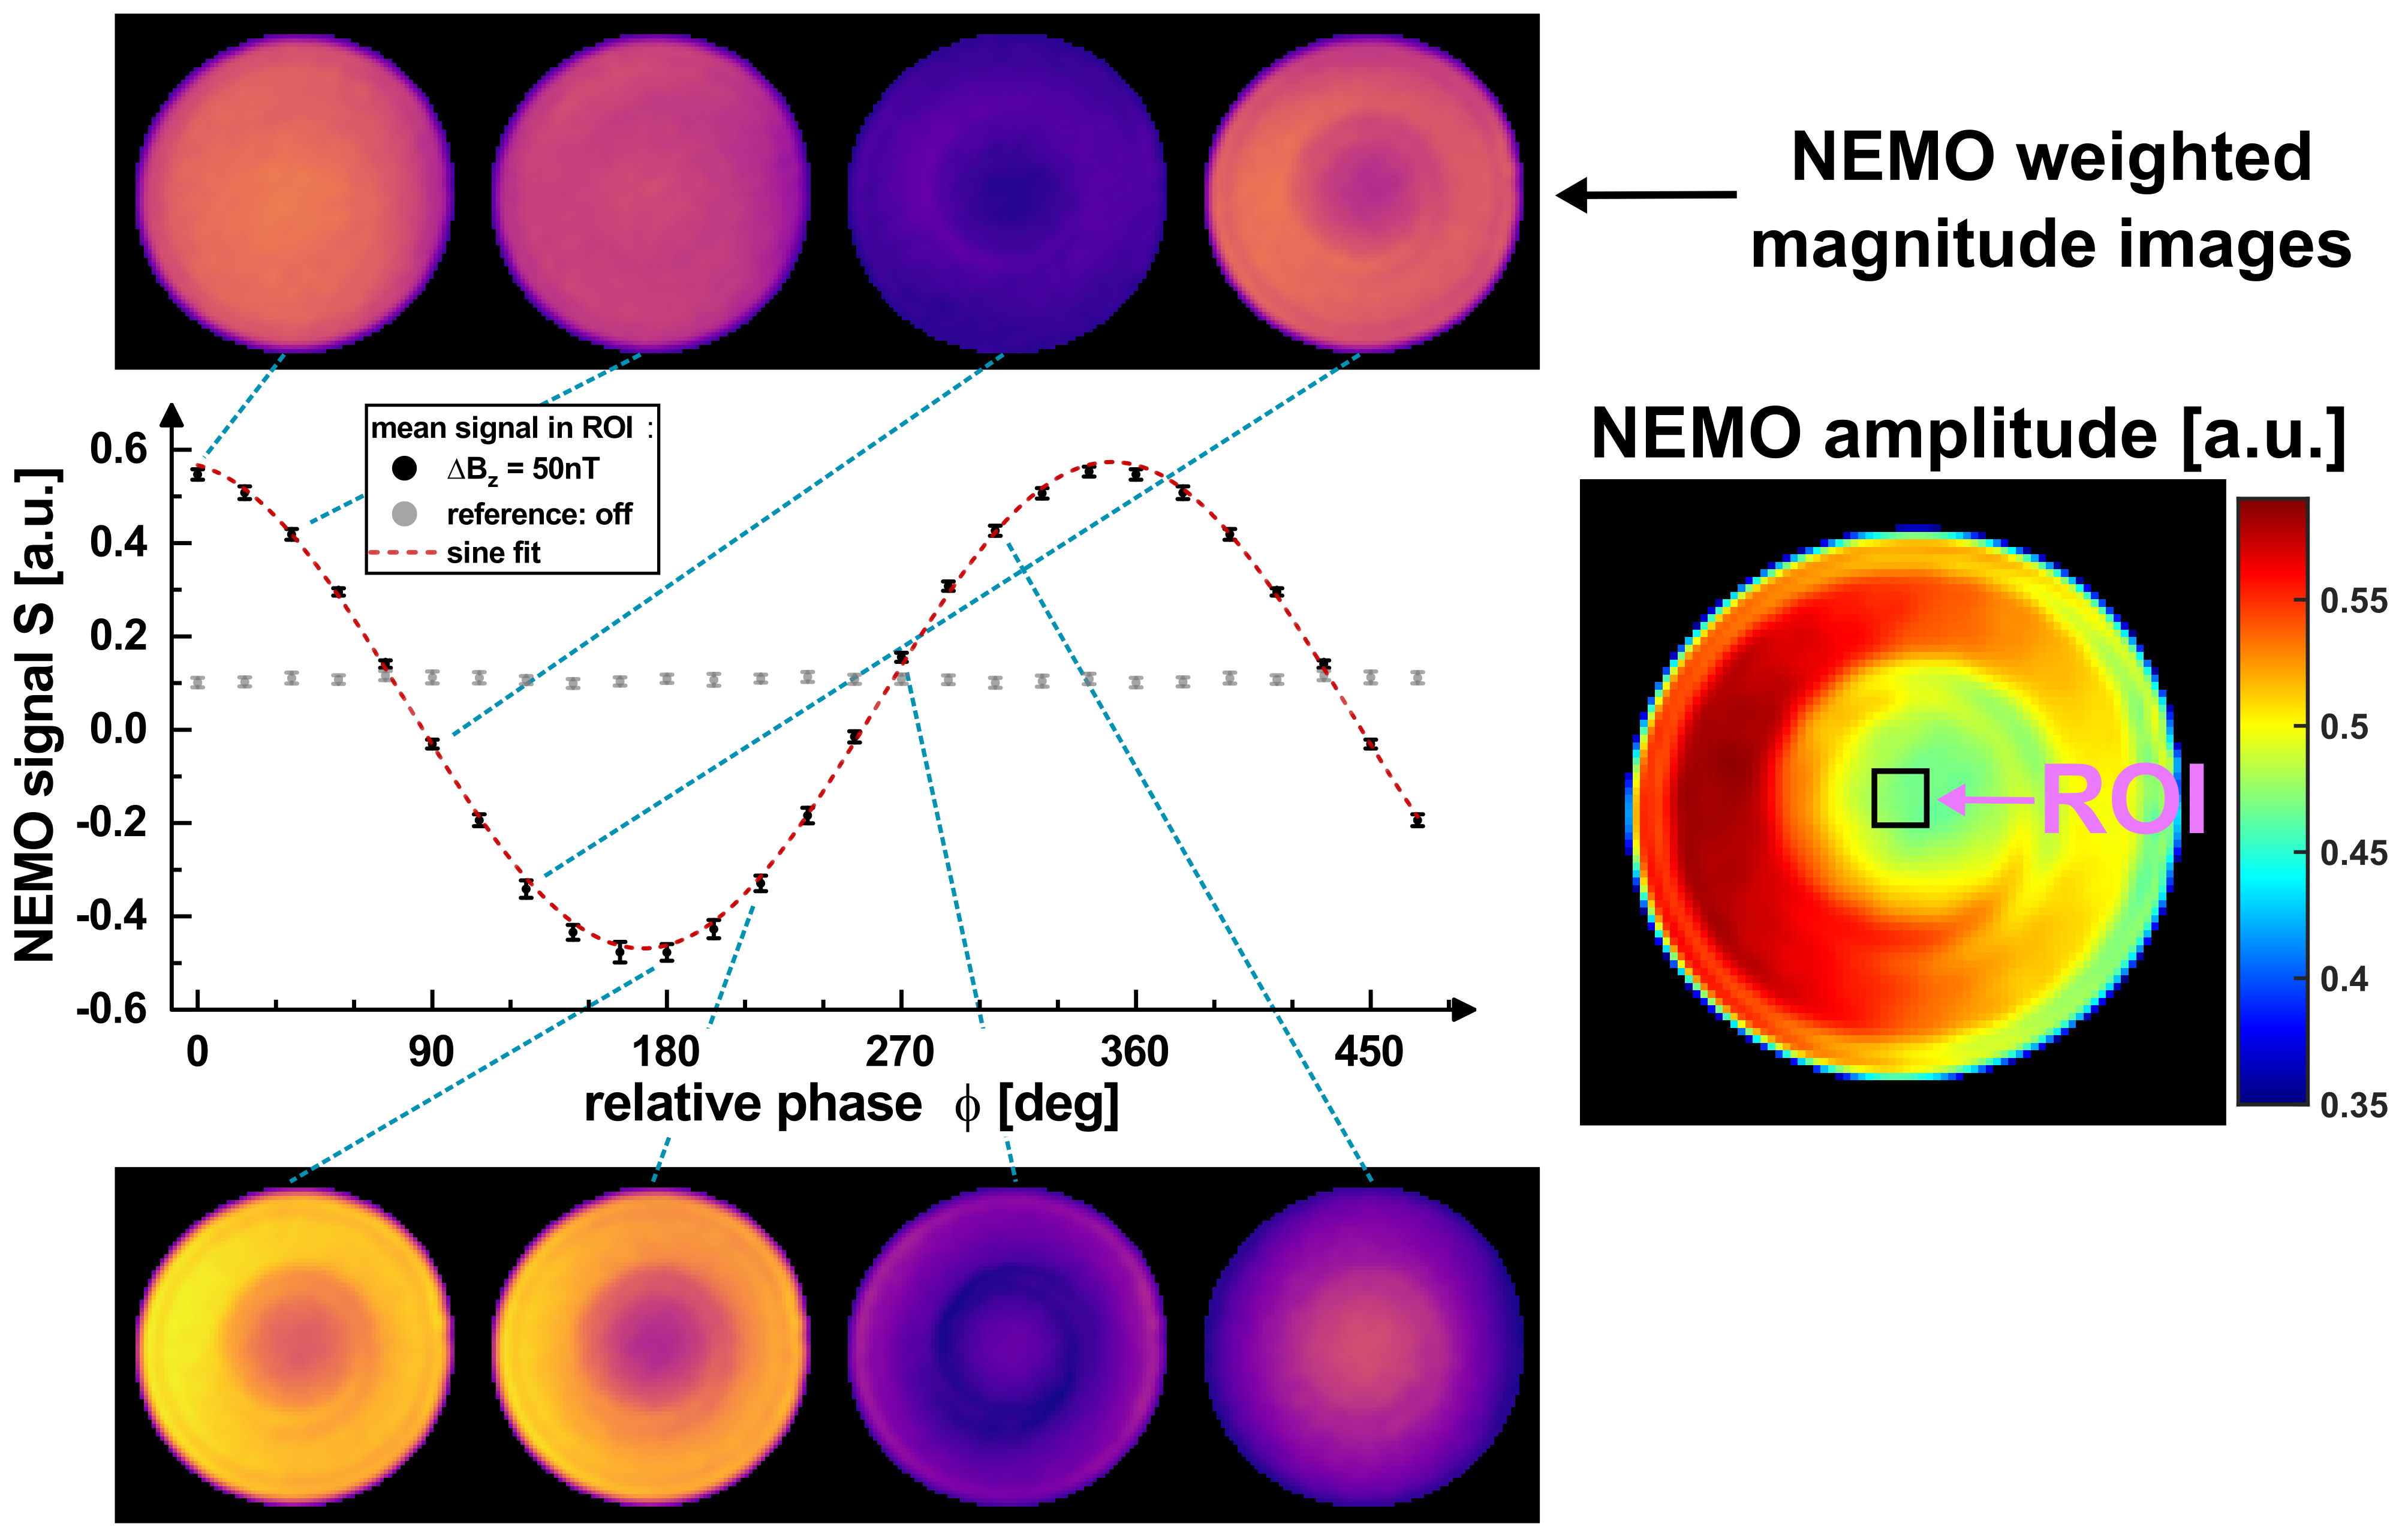
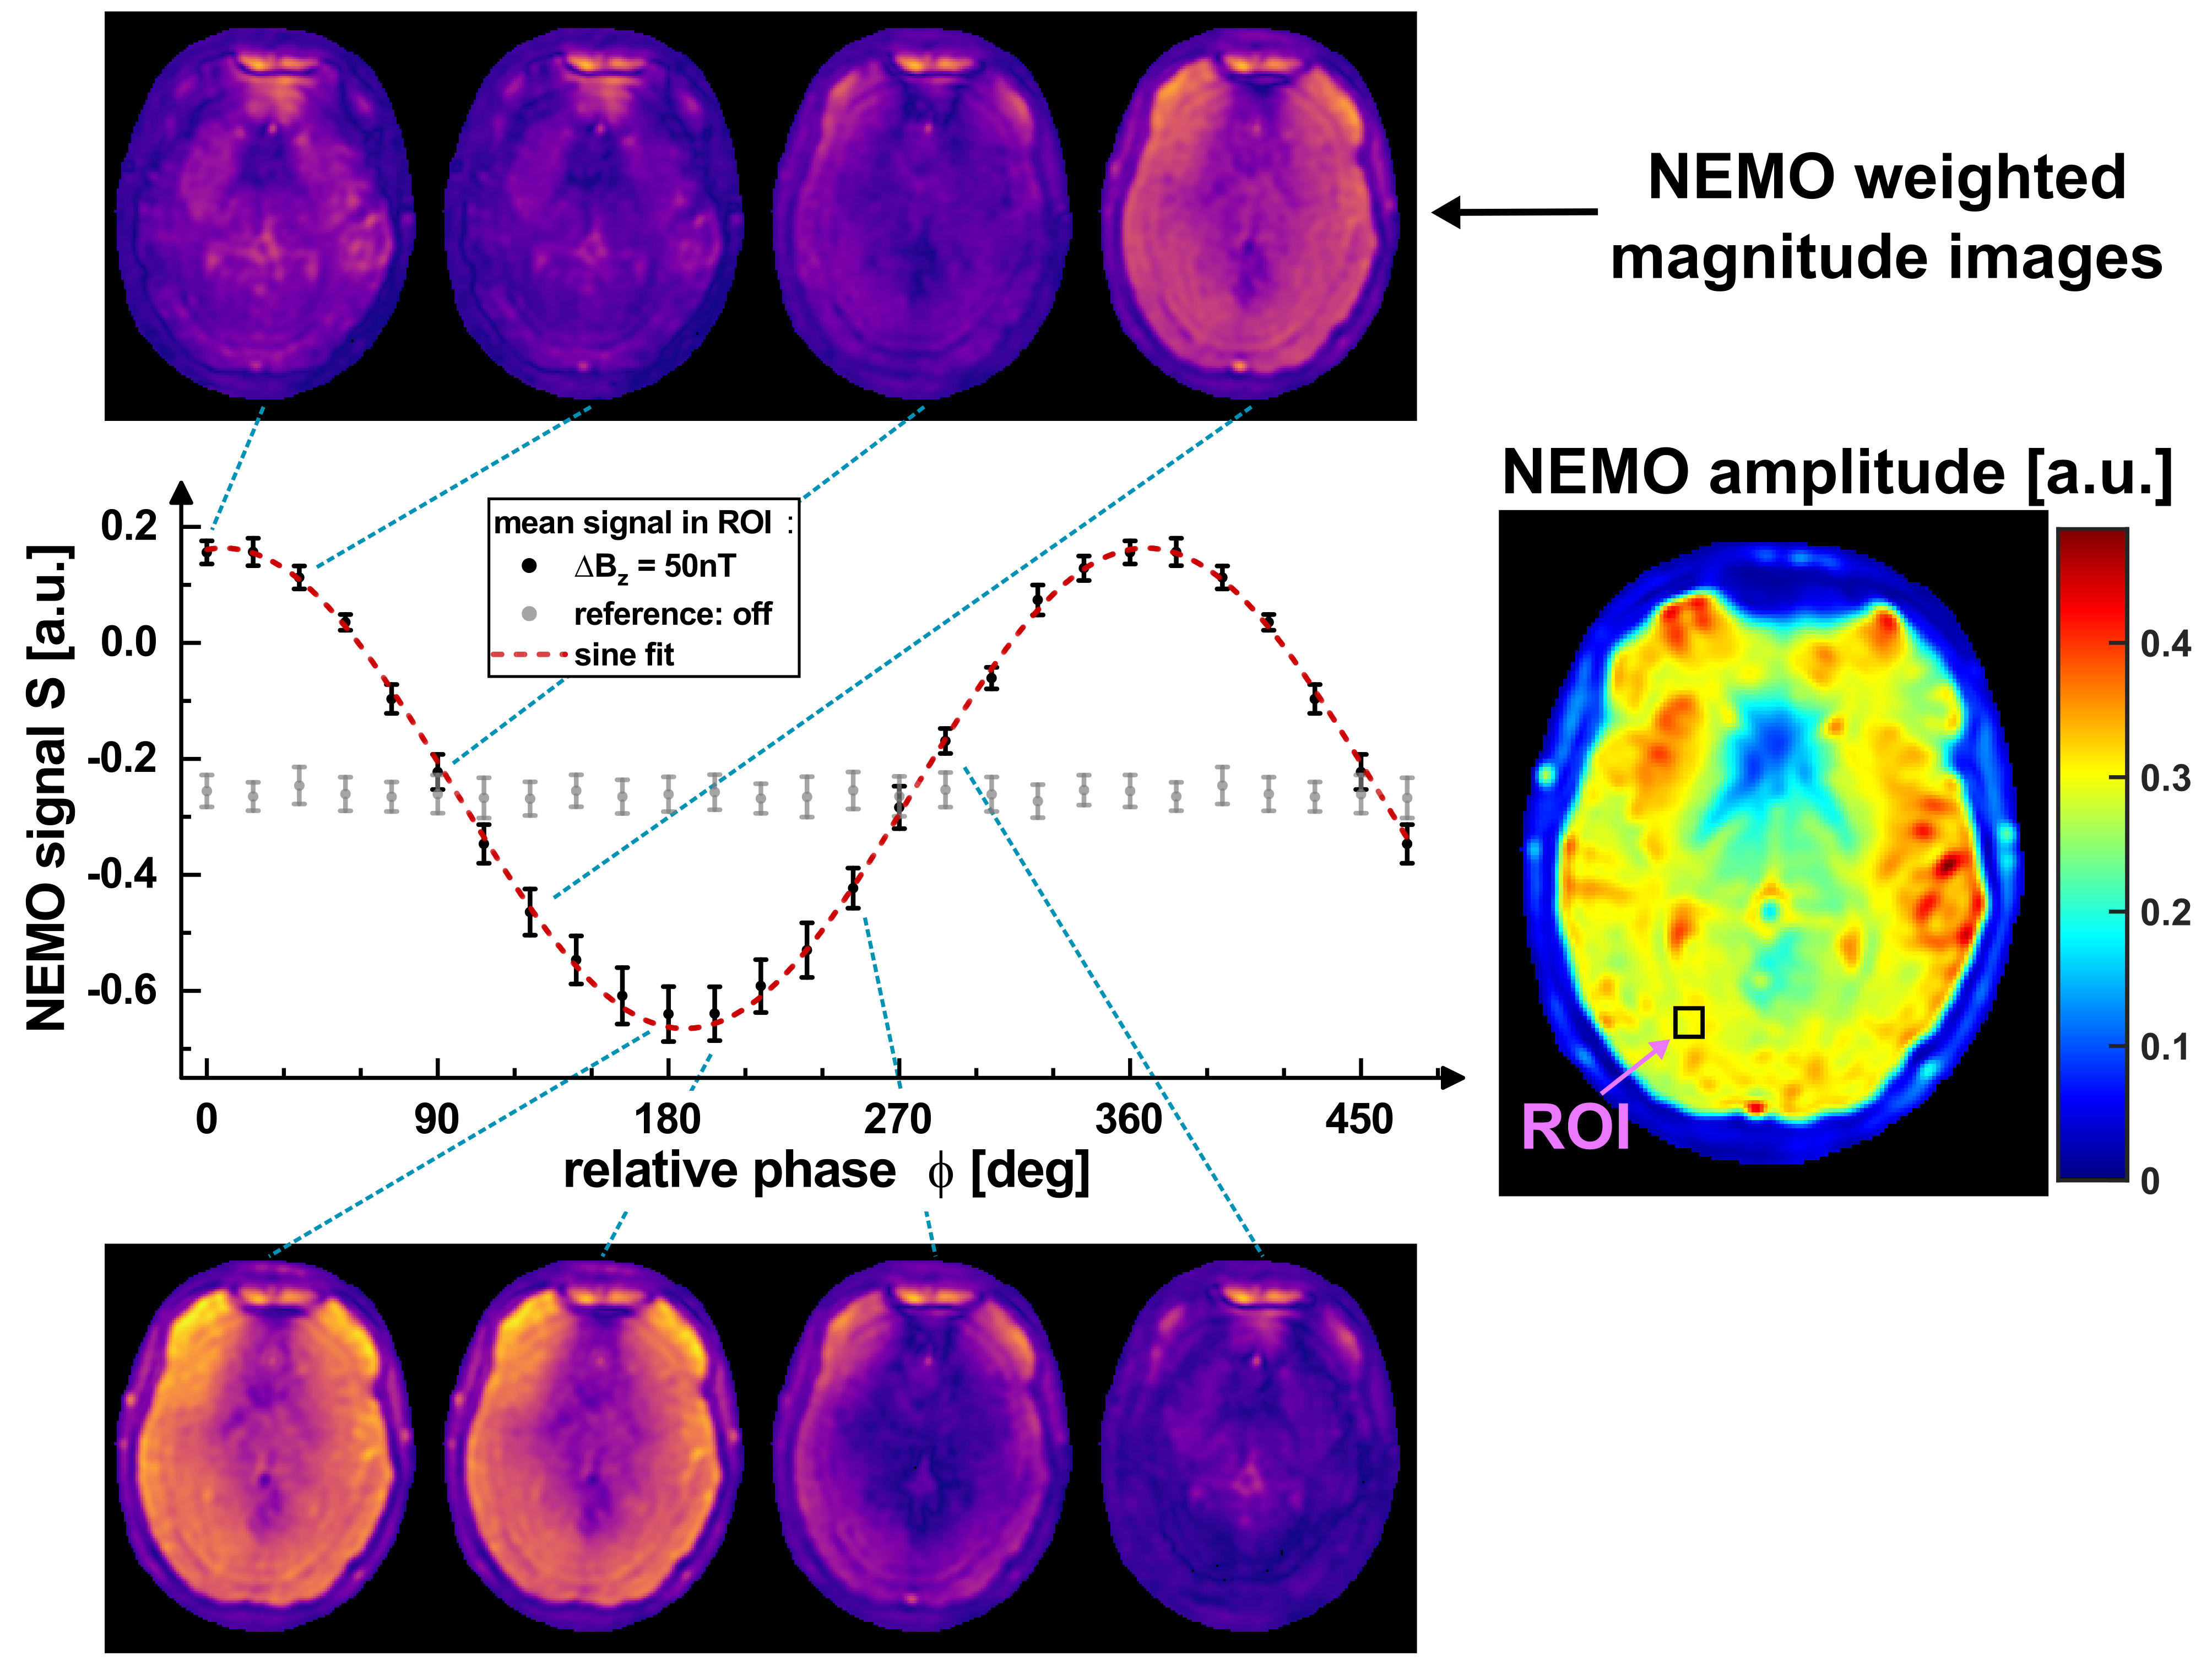
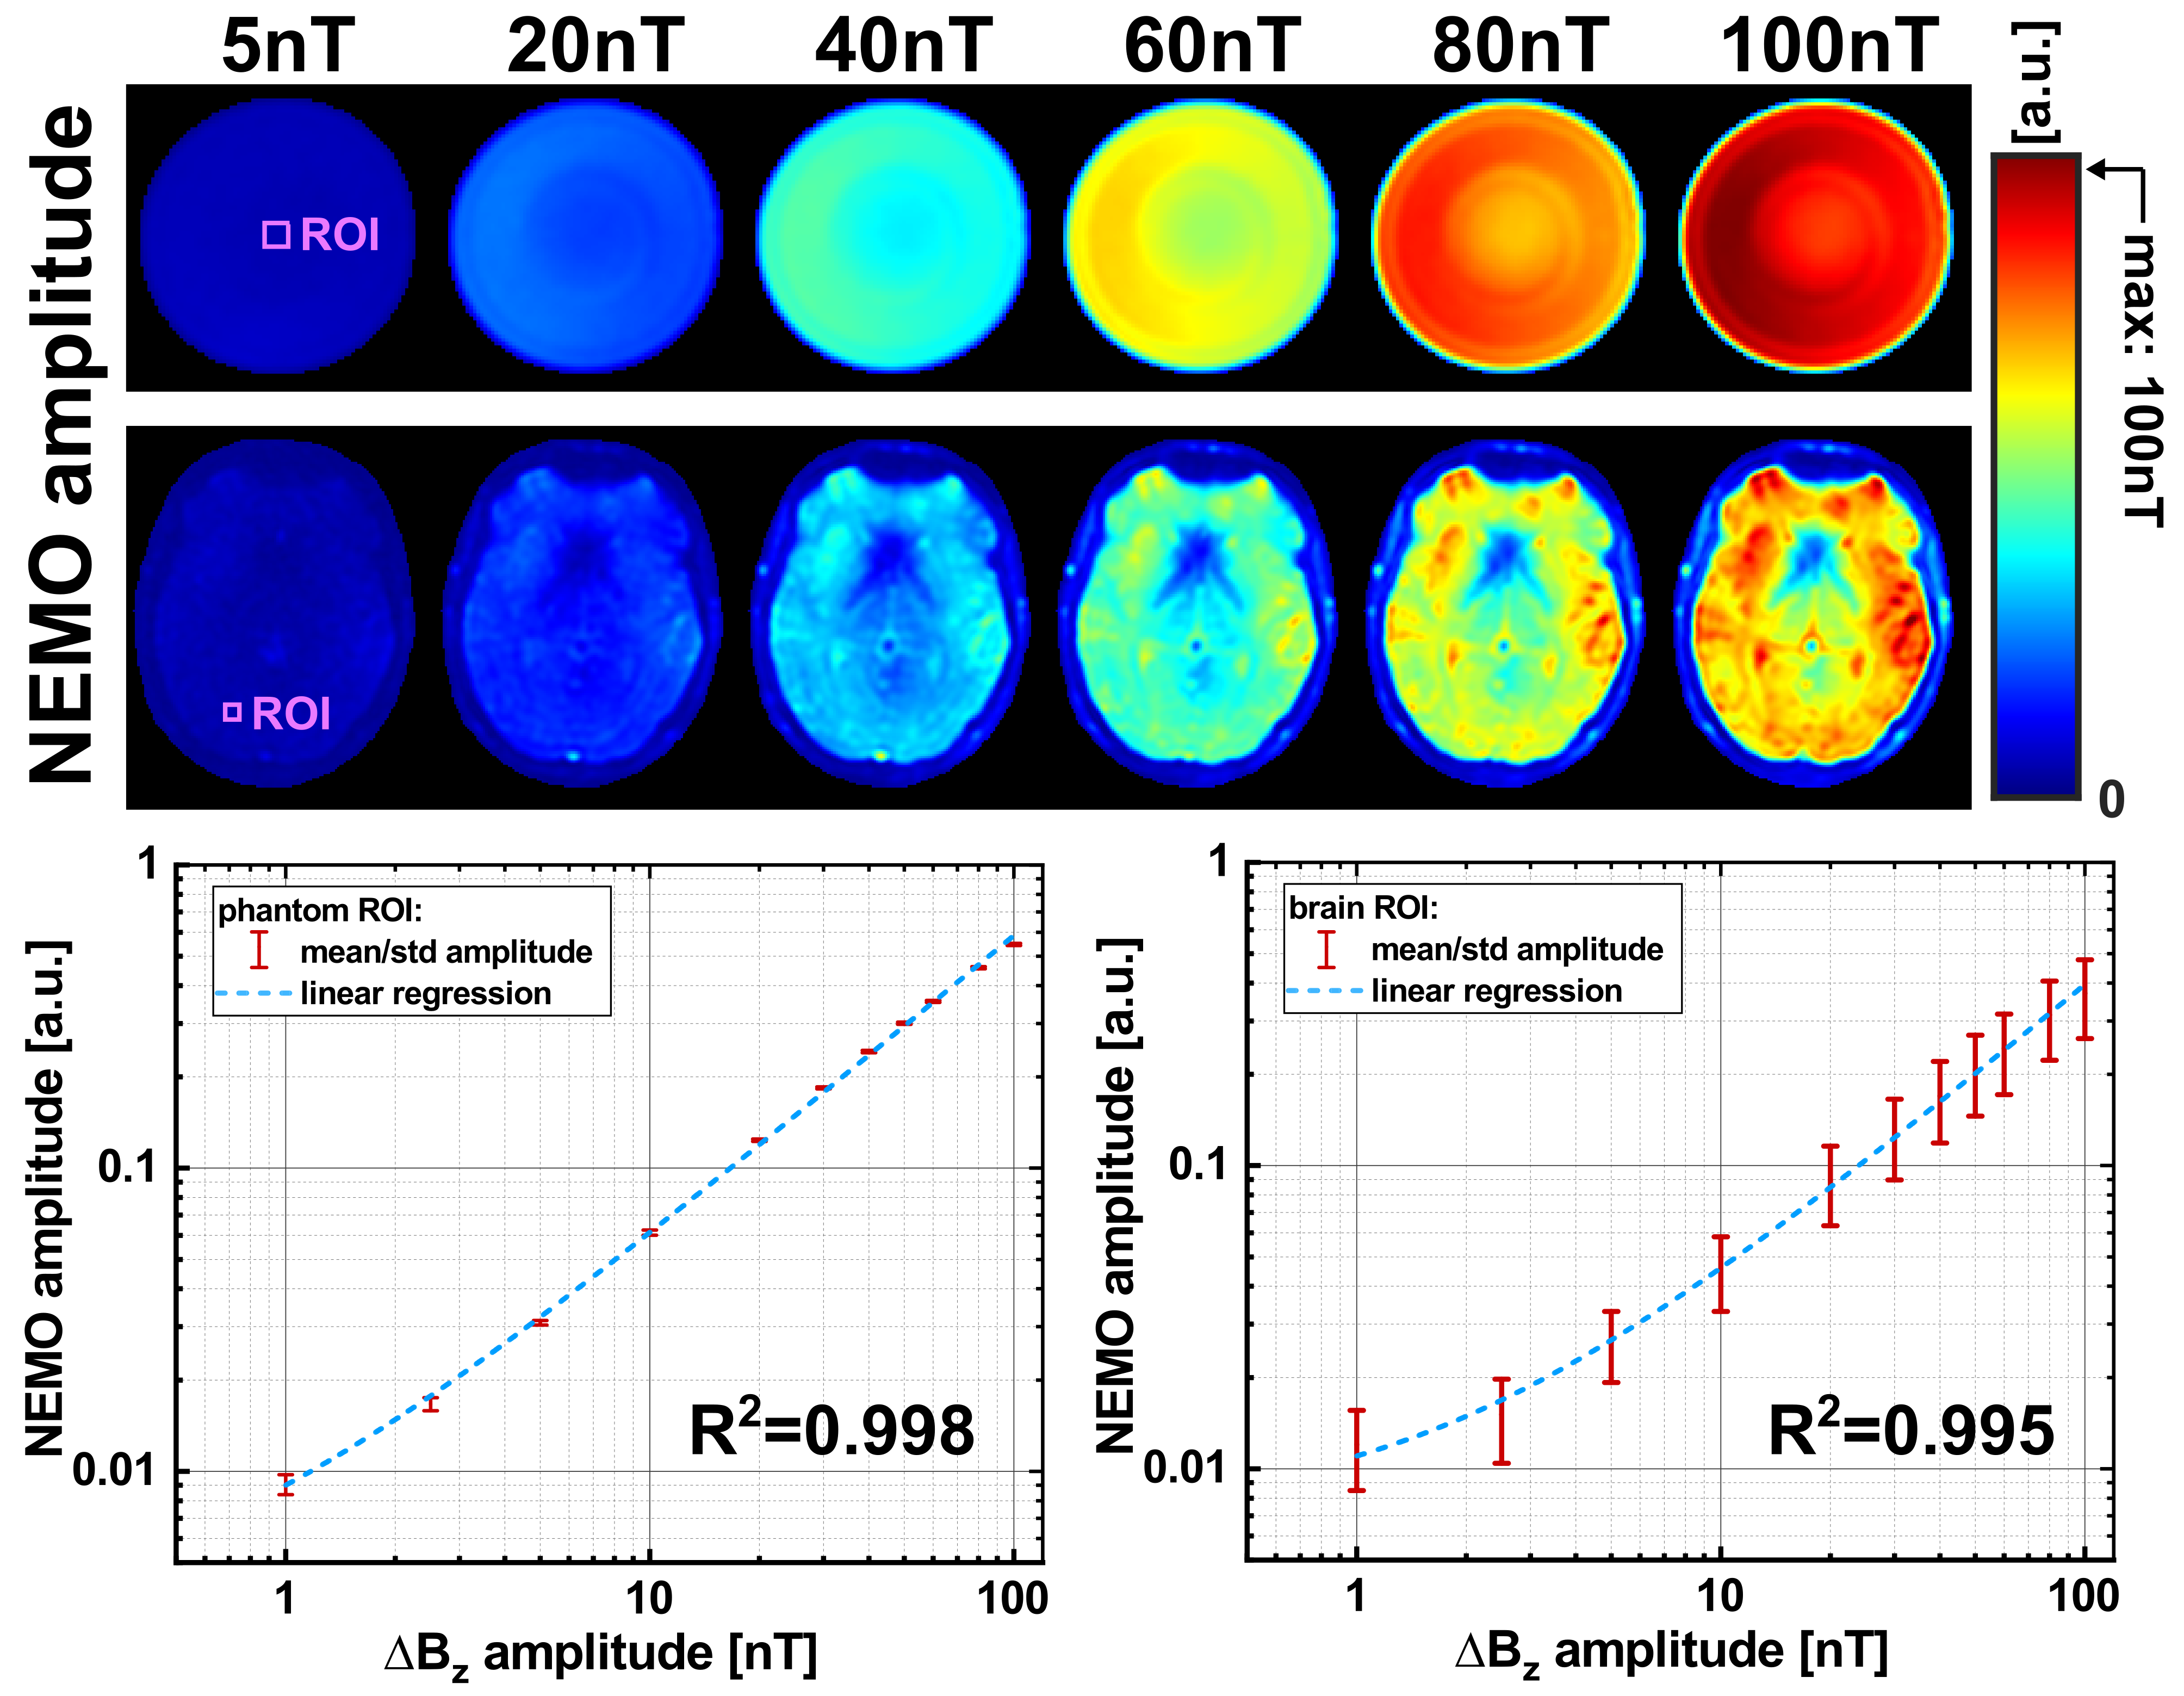
The superimposed weak oscillating gradient waveforms were validated by trajectory calibration [8]. Measurements were performed with different field strengths in the range (0.1…100) nT in a 25 mm offcenter slice. Also the adjustment of the known phase relationship between the superimposed oscillation and the spin-lock pulse, which finally determines the signal amplitude in Truong's method [2], was verified. Experimentally, the gradient emulation was validated in a Gd-DTPA doped agarose phantom (0.25 mmol/l, c = 0.75 %) and in vivo in human brain. For both setups identical sequence parameters were used. Spin-locked-NEMO-type-MRI was performed for 20 different phases ϕ. Amplitude maps were calculated pixel-wise using the standard deviation of the complex signal from different phases. The calculated amplitude maps were examined as a function of the strength of the external field oscillations.
Results
Figure 2 proofs that emulated activity patterns generated by the external gradient waveforms, where phase and amplitude could be set precisely, can be reliably detected. The mean deviation of the set amplitude was -1.16 %. As the amplitude was reduced, the noise level of the gradient waveform increased. This was also evident in the R2 values of the sinusoidal fits, converging to R2 = 1 for high amplitudes.Phantom (Fig. 3) and in vivo (Fig. 4) imaging experiments evidence that the NEMO signal follows the expected sinusoidal course as a function of the relative phase. The corresponding NEMO signal could be clearly detected within the FOV almost in the entire object. No spin-tip component was generated in the non-emulating control measurement (0 nT). The results in Figure 5 proof that the measured NEMO amplitudes can be used for the quantification of the superimposed magnetic field strength. Both, phantom (R2 = 0.998) and in vivo (R2 = 0.995) data indicate a significant linear correlation.
Discussion
The presented method, which emulates neuro-biomagnetism under in vivo conditions, enables the validation and quantification of direct fMRI sequences and thus also eliminates the need for further complex hardware setups. Using only the built-in gradient system, the validation process can be performed in a quick, easy and reproducible way in living brain tissue, an important prerequisite for future direct fMRI of oscillating magnetic fields. In addition, spatially resolved preparation characteristics can be determined in brain tissue. One current drawback is that magnetic oscillations in the sub-nanotesla range cannot be realized with the employed gradient system performance. However, a strong linear relationship between the NEMO amplitude and the gradient waveform was found, which can be used for calibration.Conclusion
Emulating fields enables fast and effective sequence development, since in vivo validation is possible. Furthermore, calibration measurements pave the way for the quantification of biomagnetism.Acknowledgements
This work was supported by the Federal Ministry for Education and Research of the Federal Republic of Germany (BMBF 01EO1504).References
[1] Witzel T, et al. Stimulus-induced Rotary Saturation (SIRS): a potential method for the detection of neuronal currents with MRI. Neuroimage. 2008 Oct 1;42(4):1357-65. doi: 10.1016/j.neuroimage.2008.05.010.
[2] Truong TK, et al. Toward direct MRI of neuro-electro-magnetic oscillations in the human brain. Magn Reson Med. 2019 Jun;81(6):3462-3475. doi: 10.1002/mrm.27654.
[3] Halpern-Manners NW, et al. Magnetic resonance imaging of oscillating electrical currents. Proc Natl Acad Sci U S A. 2010 May 11;107(19):8519-24. doi: 10.1073/pnas.1003146107.
[4] Ito Y, et al. Neural magnetic field dependent fMRI toward direct functional connectivity measurements: A phantom study. Sci Rep. 2020 Mar 25;10(1):5463. doi: 10.1038/s41598-020-62277-4.
[5] Sheng J, et al. A comprehensive study of sensitivity in measuring oscillatory magnetic fields using rotary saturation pulse sequences. Magn Reson Imaging. 2016 Apr;34(3):326-33. doi: 10.1016/j.mri.2015.11.007.
[6] Layton KJ, et al. Pulseq: A rapid and hardware-independent pulse sequence prototyping framework. Magn. Reson. Med. 2017, 77: 1544-1552. doi: 10.1002/mrm.26235.
[7] Gram M, et al. Balanced spin-lock preparation for B1 -insensitive and B0 -insensitive quantification of the rotating frame relaxation time T1ρ. Magn Reson Med. 2021 May;85(5):2771-2780. doi: 10.1002/mrm.28585.
[8] Duyn JH, et al. Simple correction method for k-space trajectory deviations in MRI. J Magn Reson. 1998 May;132(1):150-3. doi: 10.1006/jmre.1998.1396.
Figures