2919
Toward static-inhomogeneity-insensitive detection of neuro-electro-magnetic fields via compensated rotary saturation1Department of Internal Medicine I, University Hospital Würzburg, Würzburg, Germany, 2Experimental Physics 5, University of Würzburg, Würzburg, Germany, 3Magnetic Resonance and X-ray Imaging Department Fraunhofer IIS, Fraunhofer Institute for Integrated Circuits IIS, Würzburg, Germany, 4Department of Psychology, University of Würzburg, Würzburg, Germany, 5Center of Mental Health, Dept. of Psychiatry, Psychosomatics, and Psychotherapy, University Hospital Würzburg, Würzburg, Germany, 6Comprehensive Heart Failure Center (CHFC), University Hospital Würzburg, Würzburg, Germany
Synopsis
Resonant absorption during spin-lock preparation can be used to measure tiny oscillating magnetic fields acting as direct evidence of electrical neuronal activity. Different spin-locking techniques were compared with respect to their sensitivity in magnetic field detection. As a specialty, the oscillating magnetic fields were generated by the built-in gradient system in an offcenter slice. The spin-lock time was identified as the crucial parameter for the performance of NEMO (neuro-electro-magnetic-oscillations) detection, since minima and maxima in the signal amplitude emerged in phantom and in vivo experiments. Affirmative, the experimental results show an excellent agreement with simulation results.
Introduction
Oscillatory neuronal activity patterns are well known from EEG measurements (Electroencephalography) in the human brain [1]. However, direct imaging providing spatial resolution in subcortical regions has not been realized yet, since EEG, like MEG (Magnetoencephalography), only works sufficiently on the surface due to the inverse problem. On the other hand, BOLD-based fMRI detects brain activation only indirectly via the neurovascular coupling.In 2008, Witzel et al proposed a novel technique for direct detection of neuro-electro-magnetic fields using the rotary saturation effect during spin-lock (SL) preparation [2]. Although the SL technique aiming for T1ρ-quantification has been continuously developed over the past decade, mainly the simplest type of spin-locking has been applied for direct detection of neuronal activity [2-4], which consists of a single continuous wave pulse. Common B0 and B1 compensation techniques (e.g. rotary-echo (RE-SL) [5], composite (C-SL) [6] or balanced-spin-lock (B-SL) [7]) have not been discussed in the context of direct fMRI yet. The compensation of static field inhomogeneities is, however, indispensable for the spin-lock-based detection of ultraweak field oscillations, since static inhomogeneities are of the same order of magnitude as the dynamic components to be measured [8].
In this study we investigated how spin-lock compensation techniques can be meaningfully adapted for the NEMO-method (neuro-electro-magnetic-oscillations) proposed in [3]. Thereby the detected NEMO signals could potentially be increased while reducing the influence of static field inhomogeneities. In the first step, the different preparation characteristics were examined by Bloch simulations and phantom experiments. Subsequently, the module performance was compared under in vivo conditions by using the built-in gradient system for emulating neuronal field oscillations.
Methods
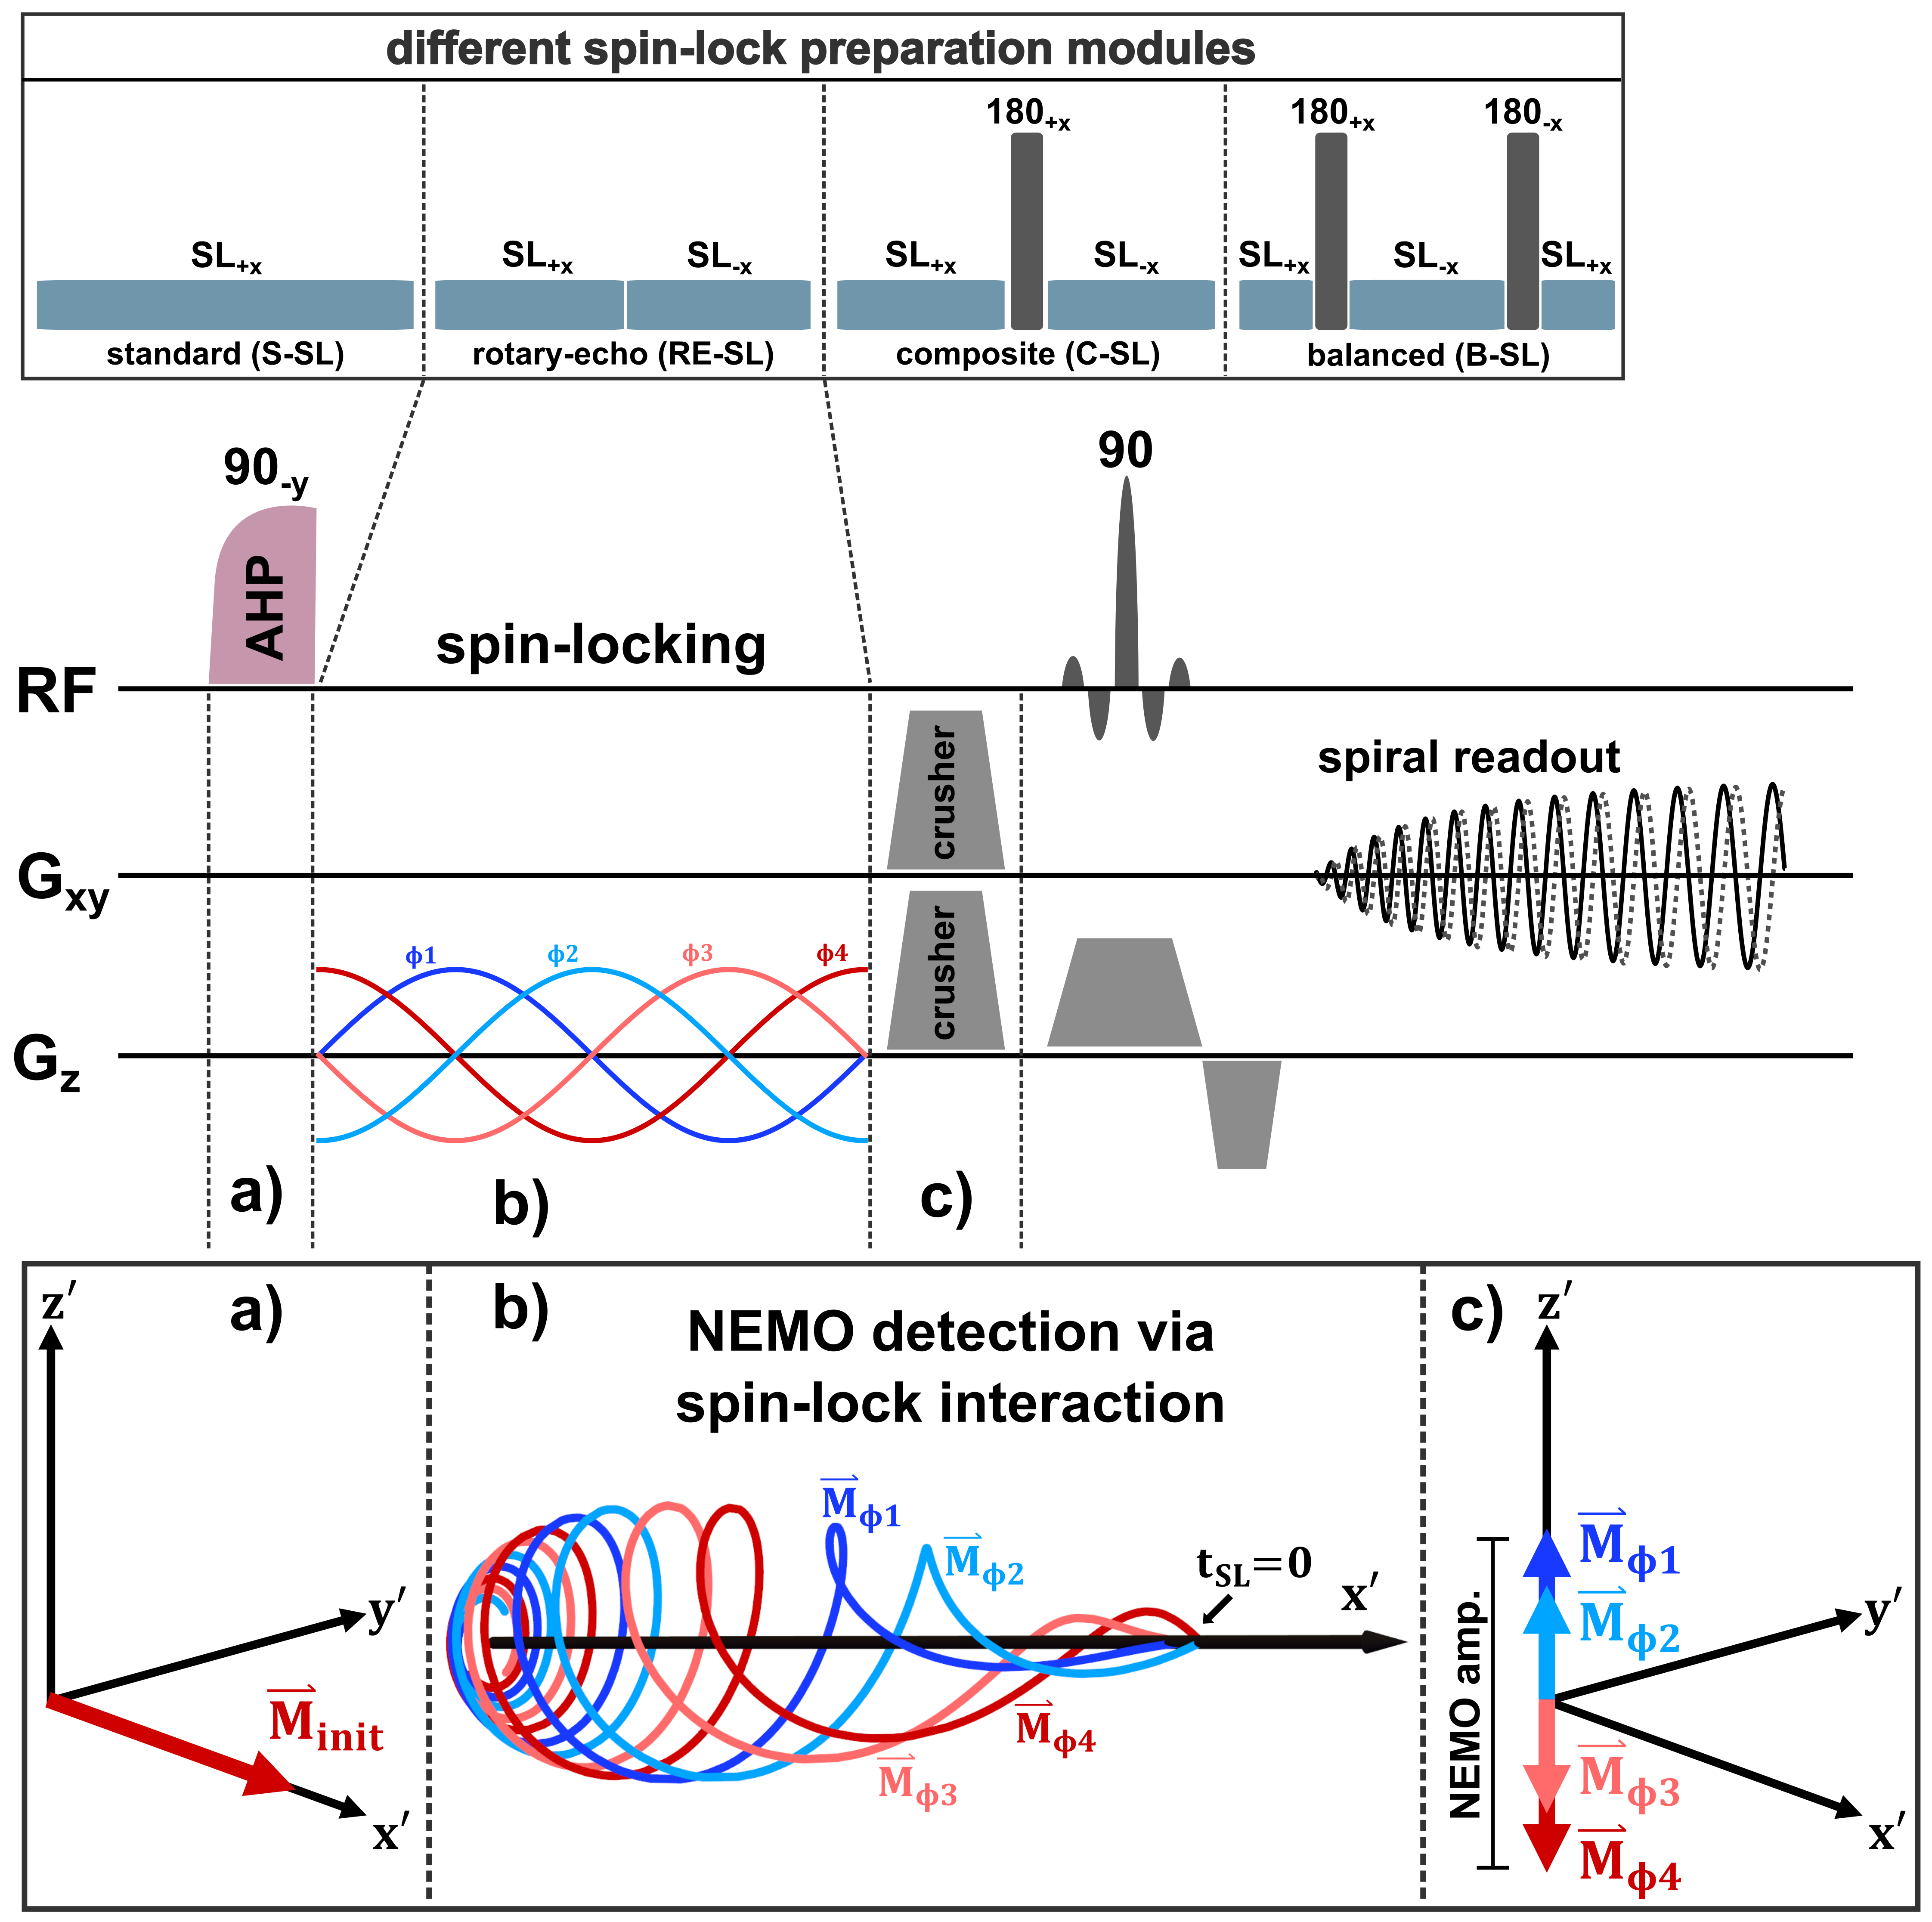
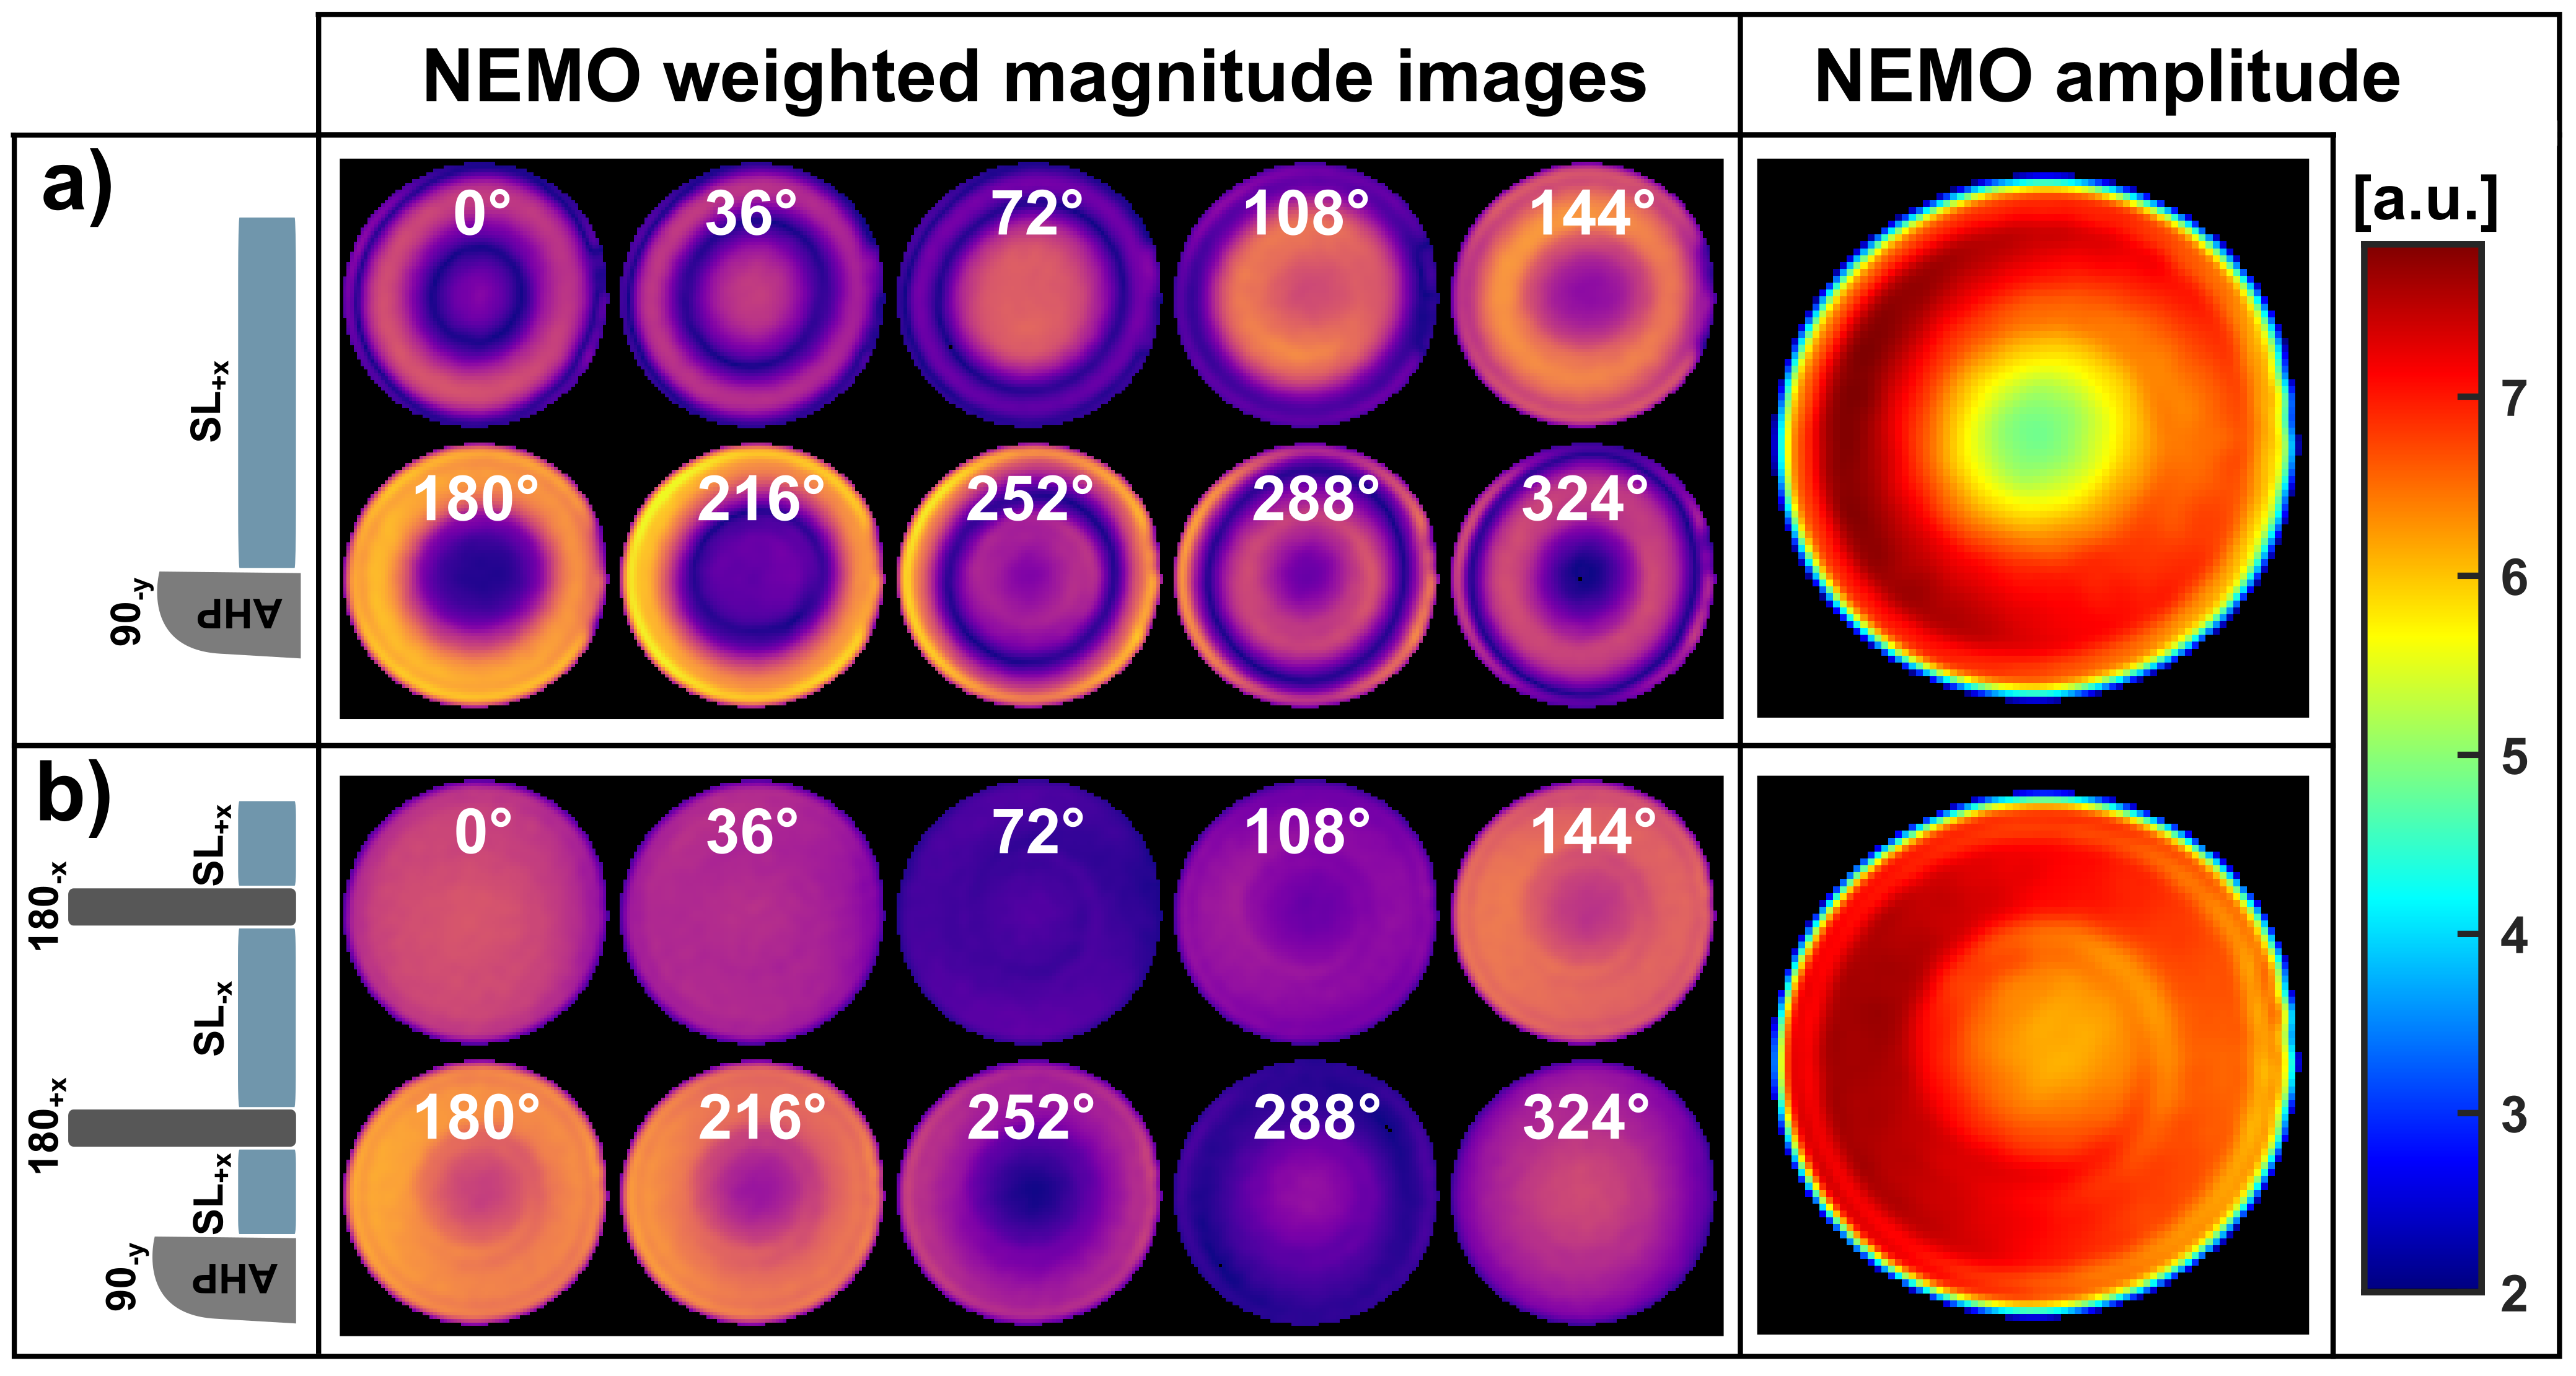
All measurements were carried out on a 3.0T scanner (MAGNETOM Skyra, Siemens, Erlangen, Germany) using a 20-channel head coil. The NEMO-sequence was implemented for the optional modules S-SL, RE-SL, C-SL and B-SL within the open-source Pulseq framework (Fig. 1) [9].In order to demonstrate the impact of banding artifacts on the NEMO-weighted image contrast, measurements based on S-SL were compared with B-SL in a phantom experiment. Magnetic oscillations with an amplitude of ΔBz=50nT were generated during the preparation process. In all measurements the oscillations were controlled by the built-in gradient system within an offcenter slice.
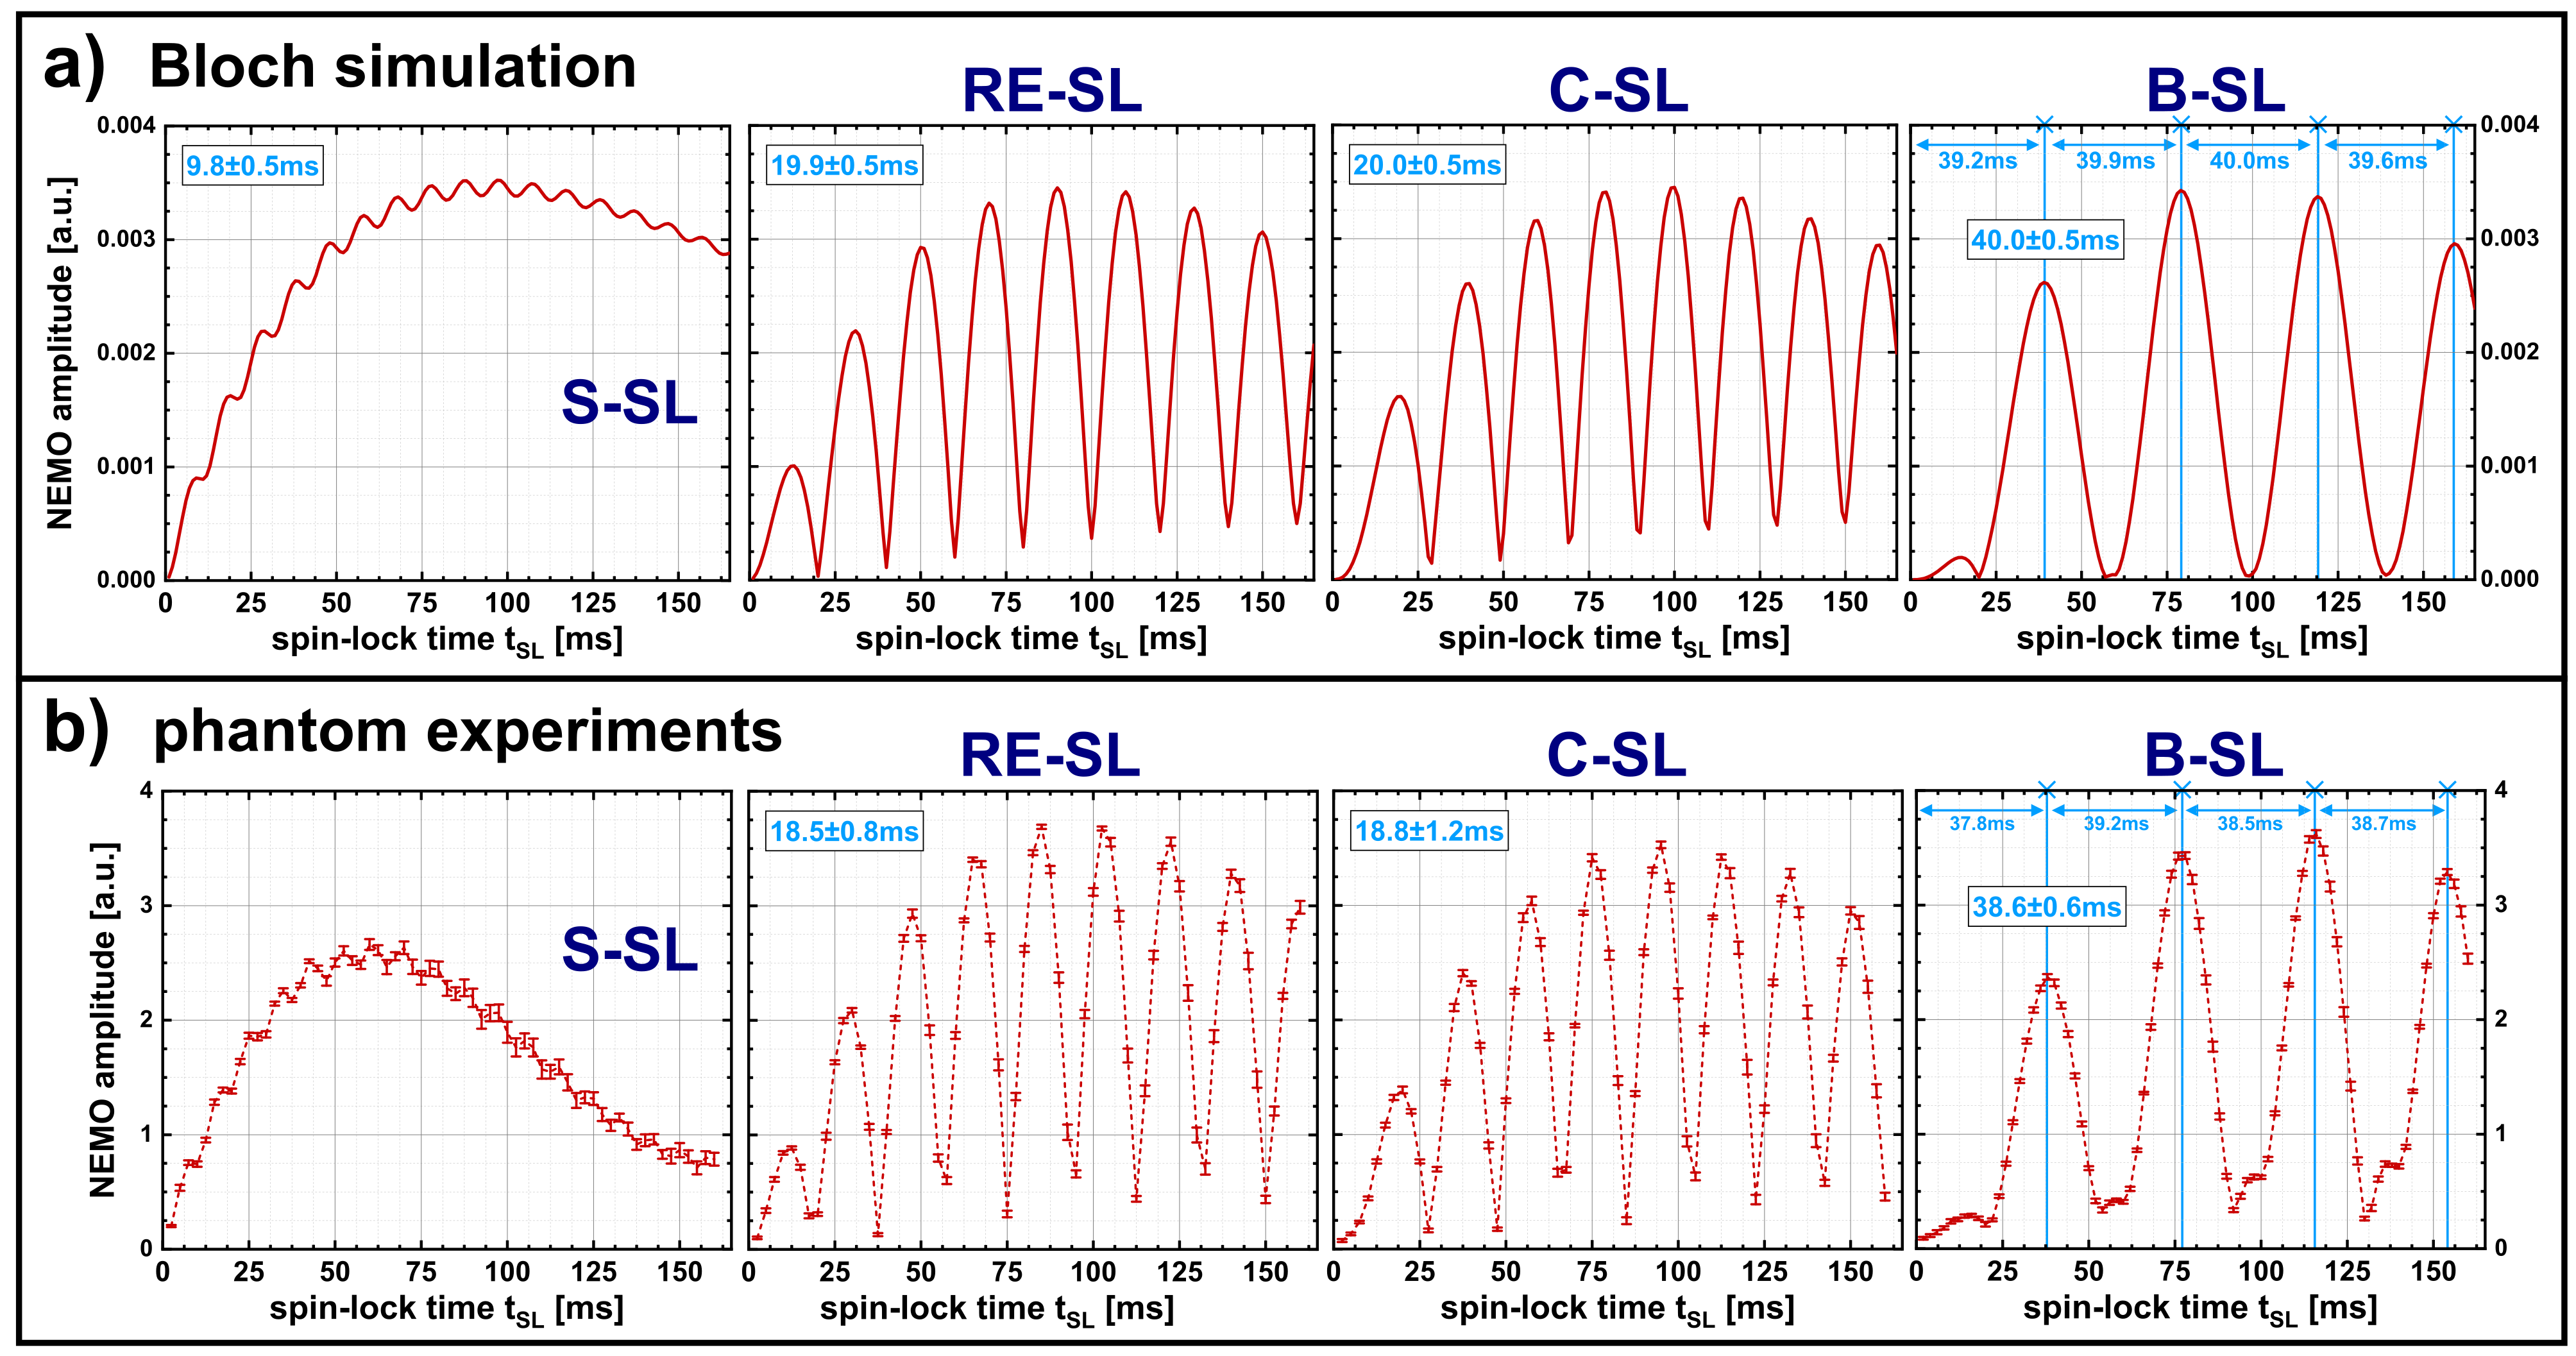
Furthermore, a series of measurements was carried out in which the influence of the spin-lock time tSL on the detected NEMO amplitude was examined for the different preparation modules. The results were compared with Bloch simulations (Matlab R2018b, The MathWorks) by numerically solving magnetization trajectories for the SL interaction with resonant field oscillations. The SL amplitude and the oscillation frequency were set resonantly to fSL=50Hz. SL times were varied from 0...200ms.
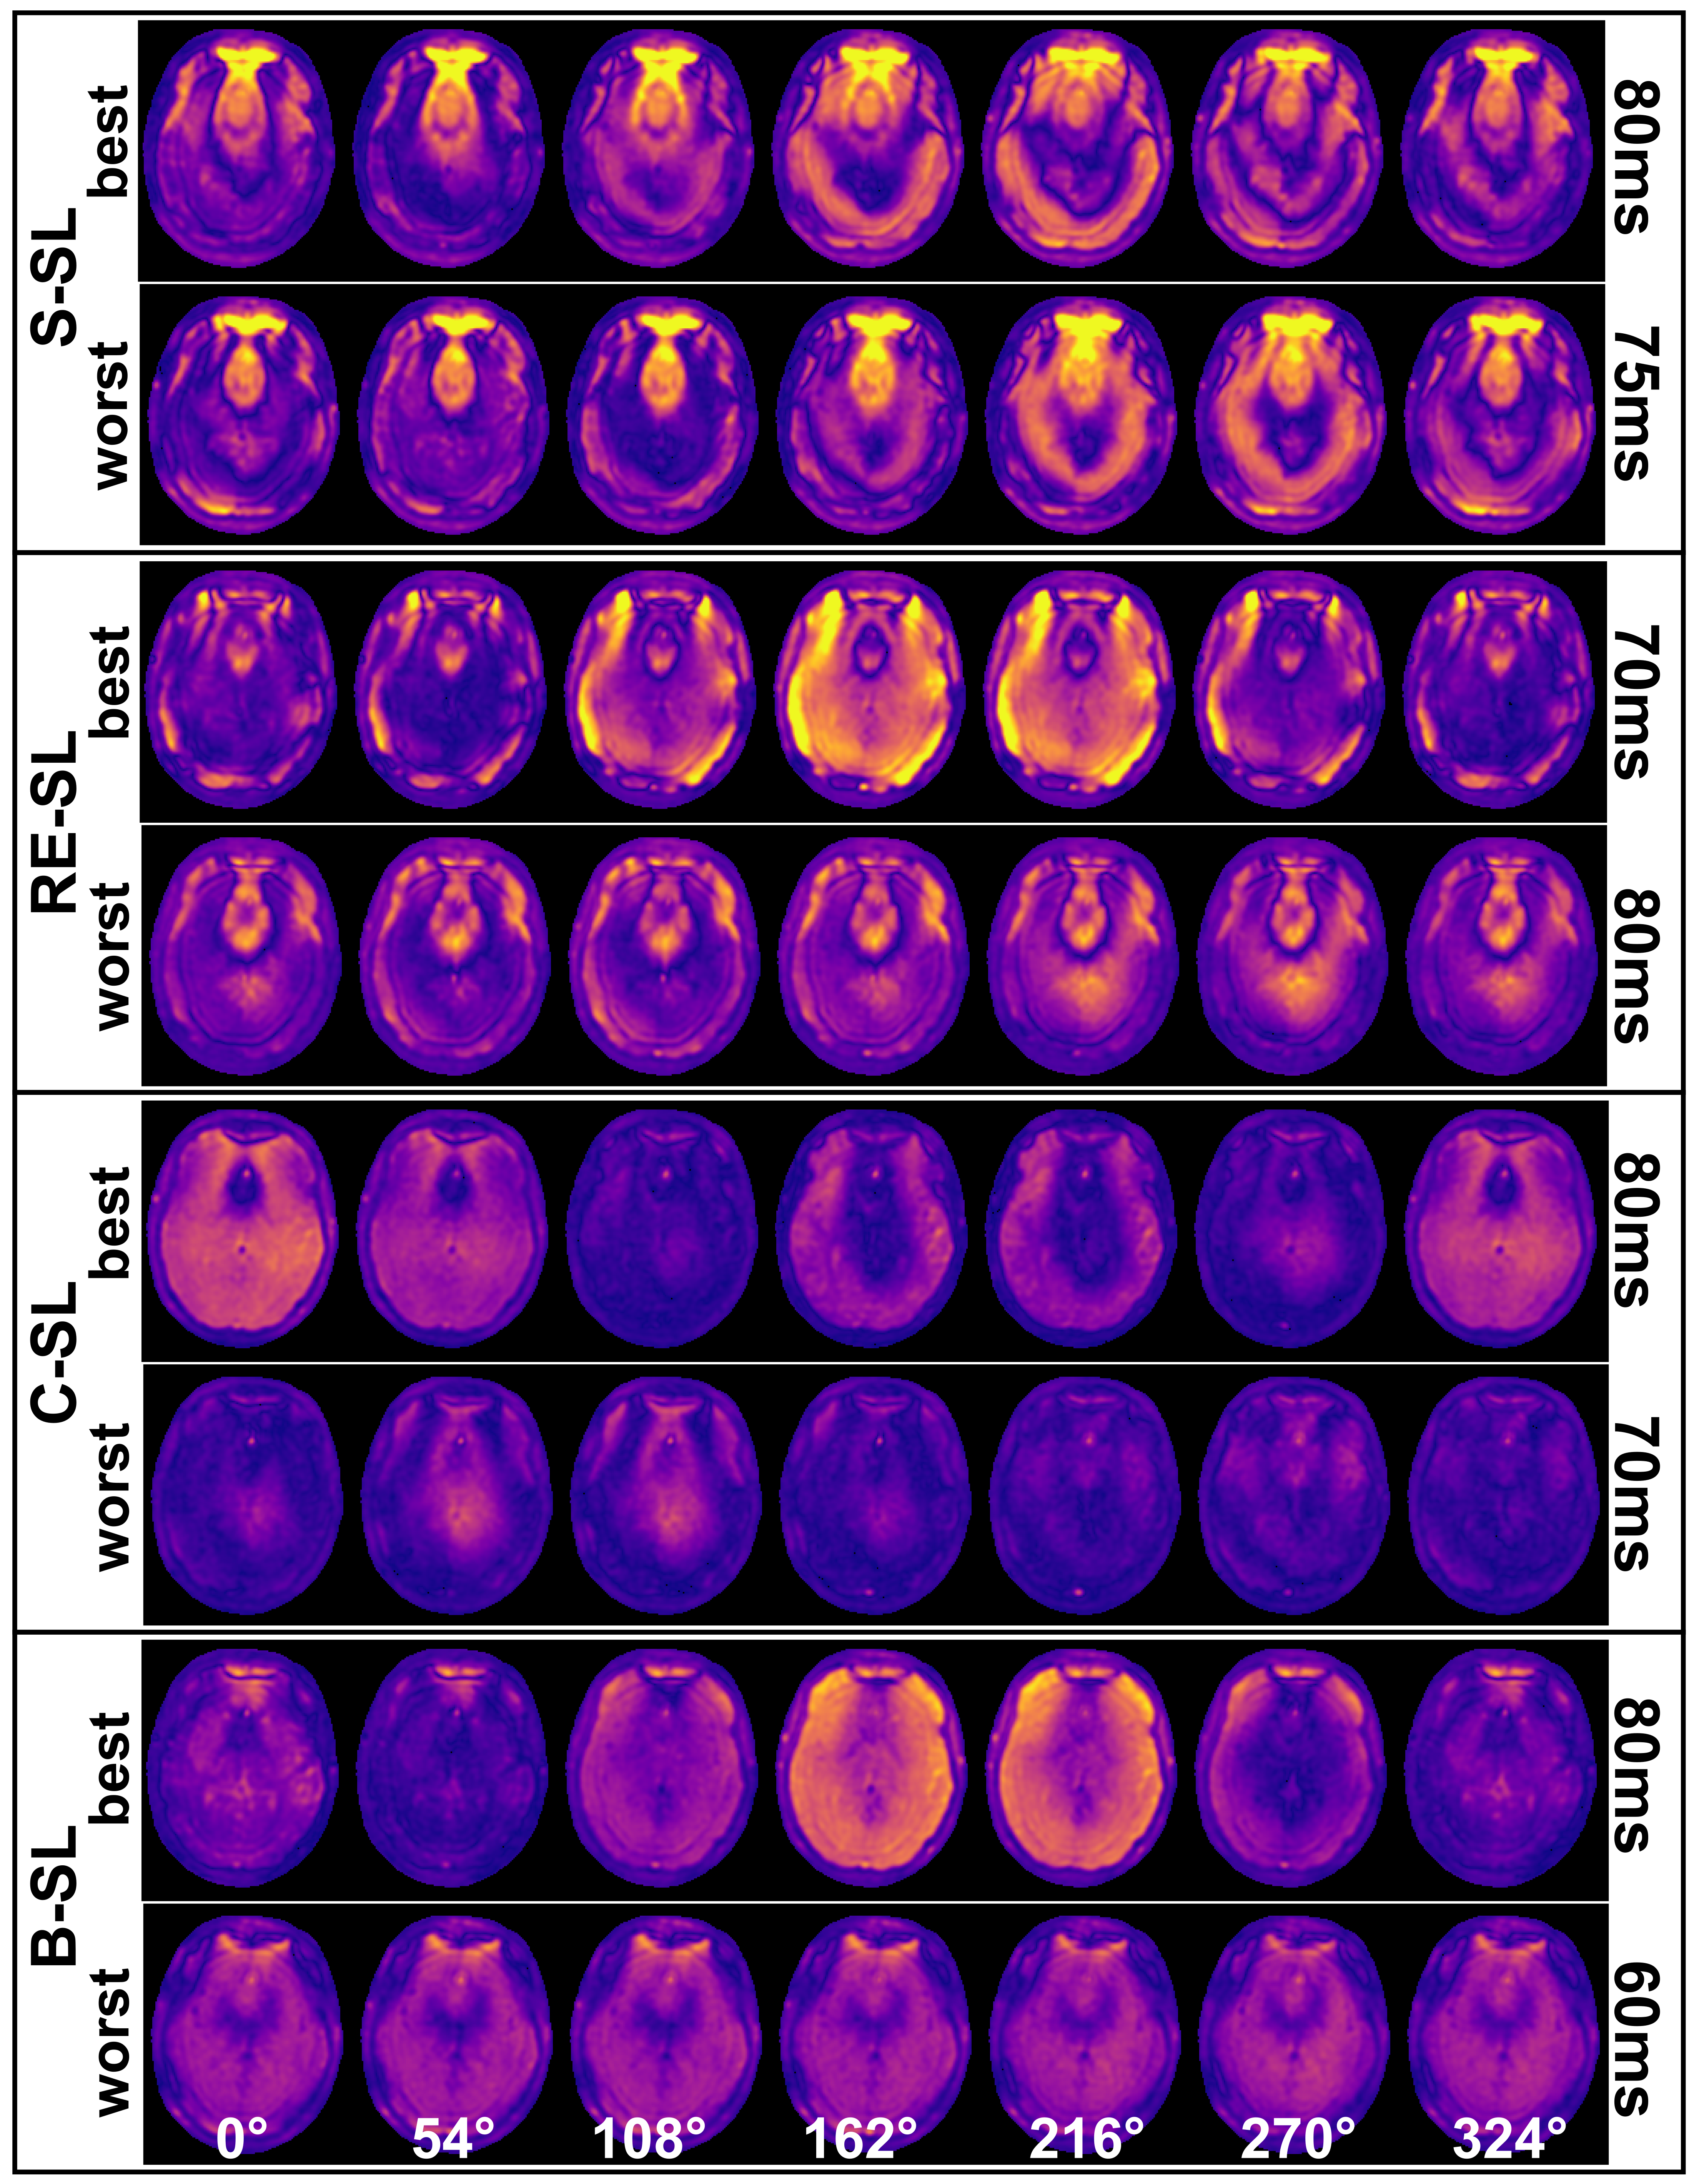
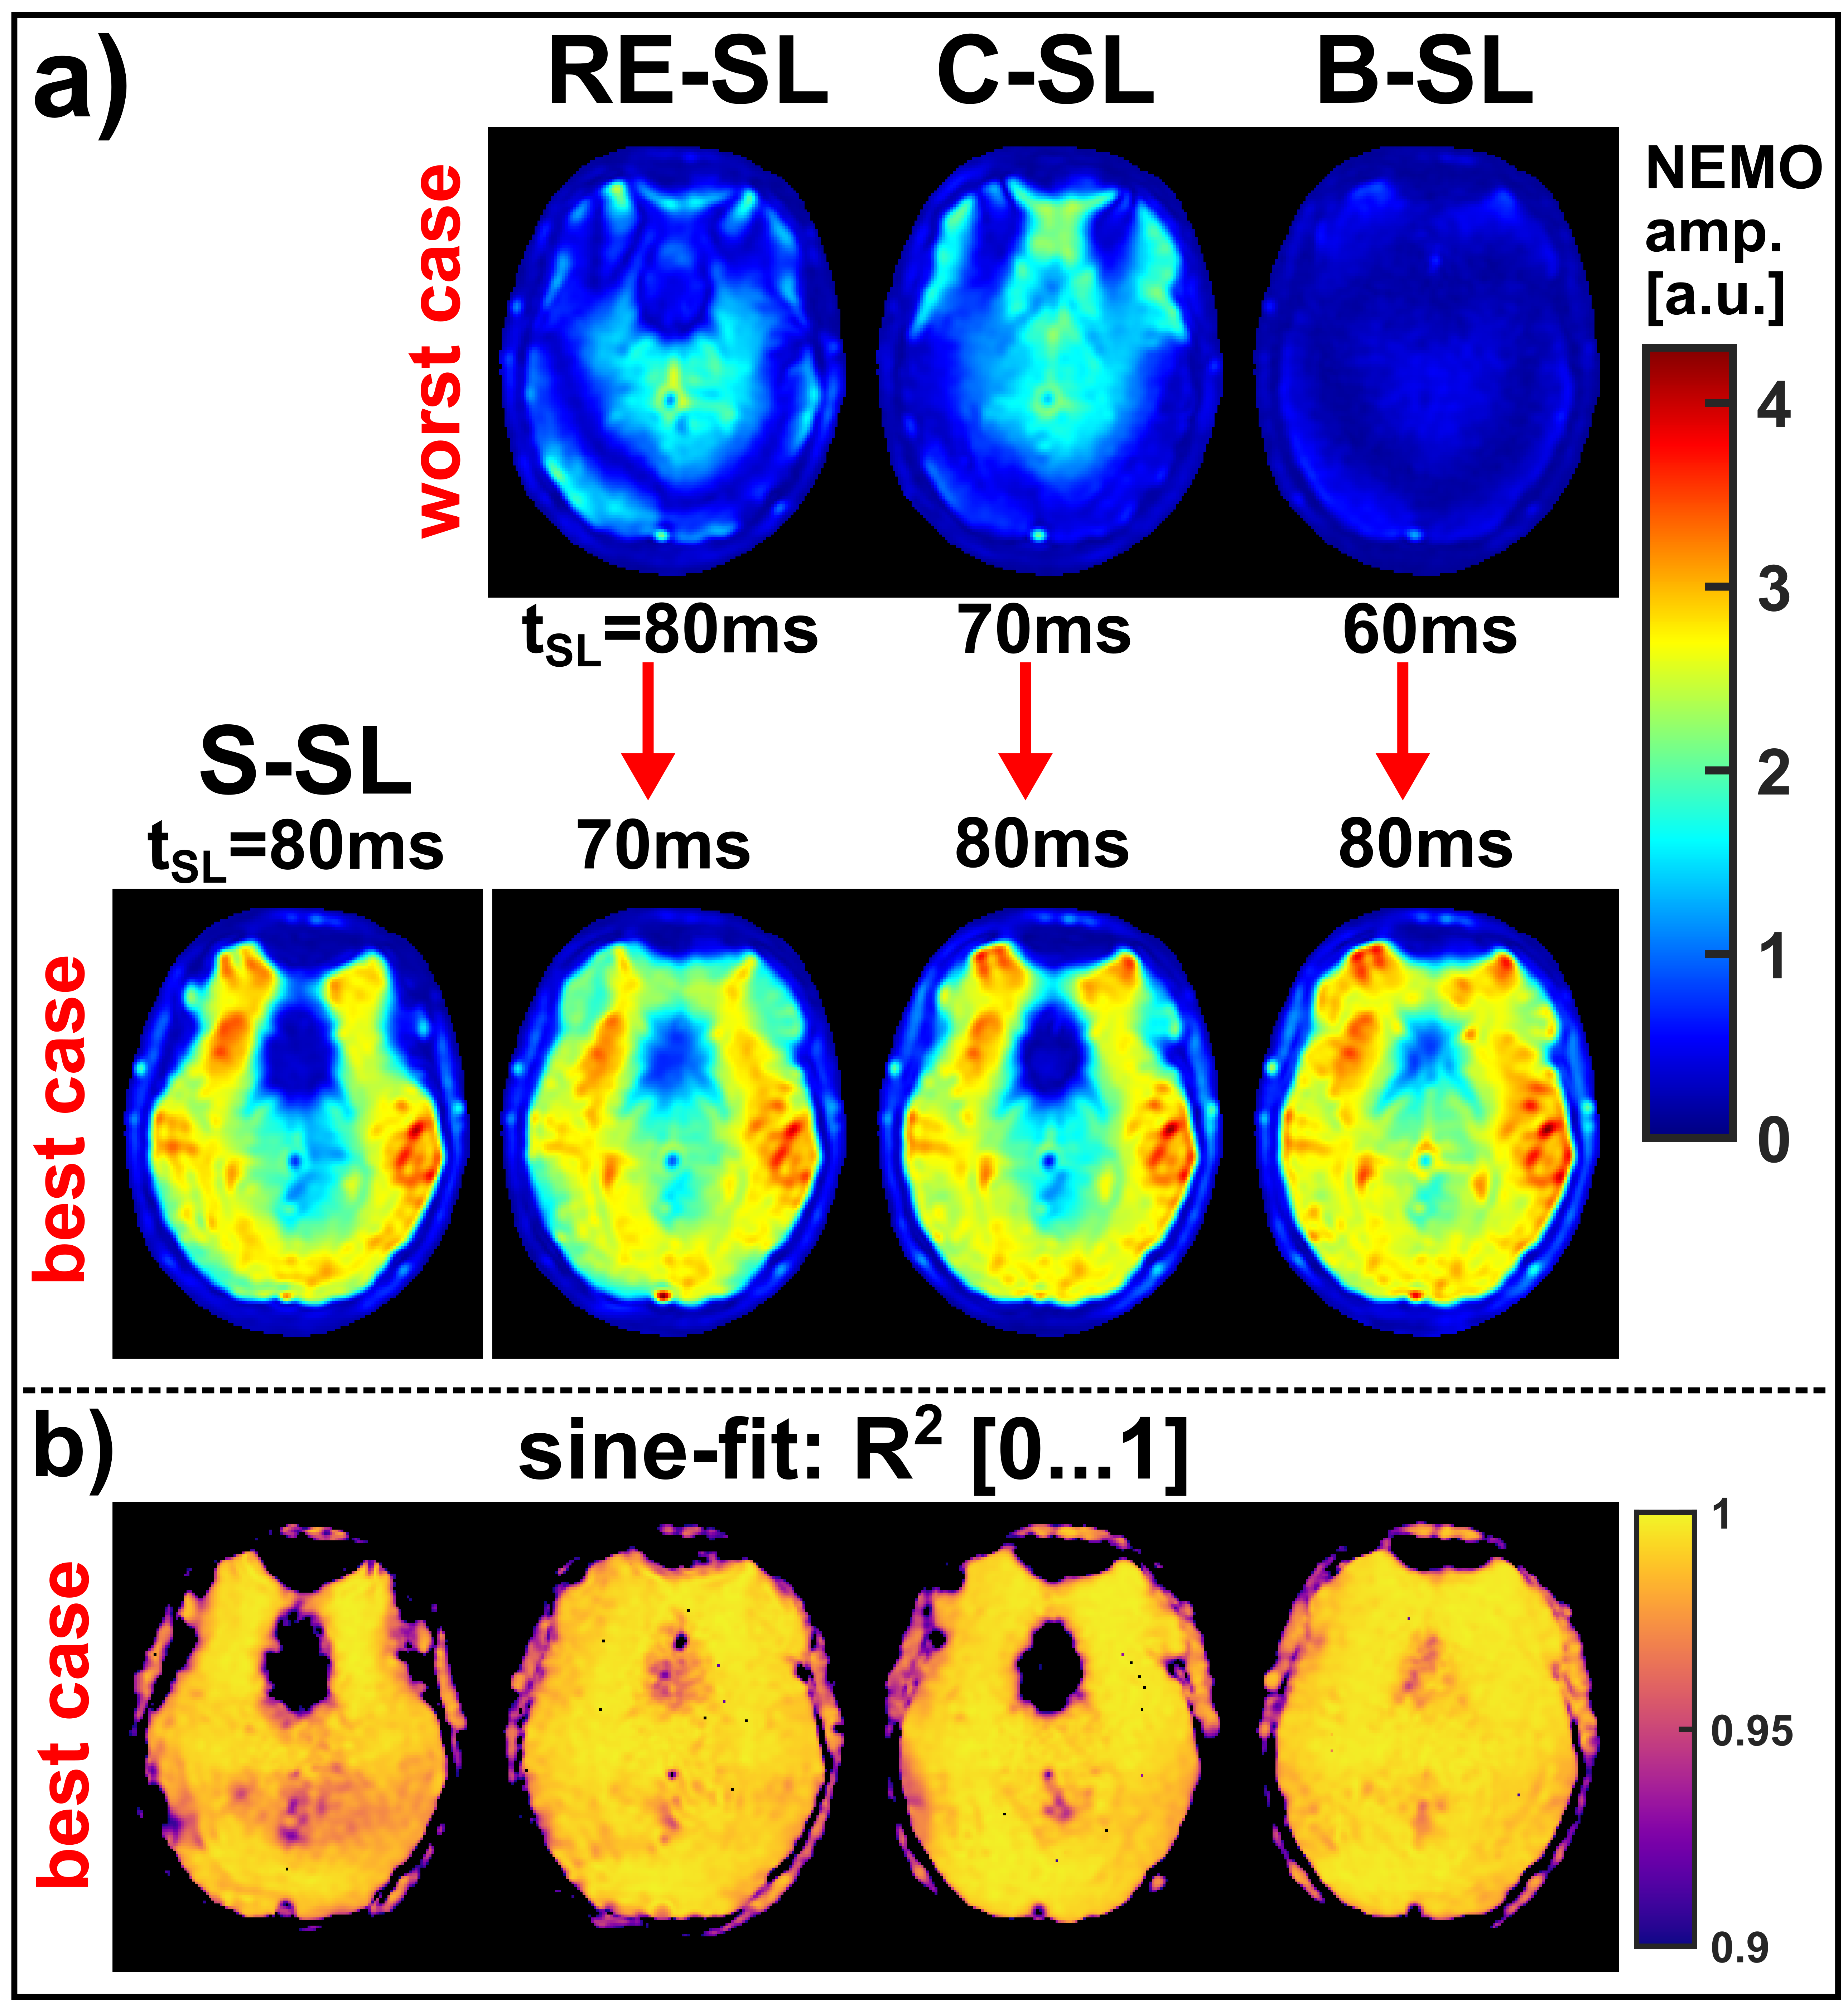
Based on the new findings of the tSL characteristics, in vivo measurements with mimicking neuronal field oscillations in the brain were carried out in worst-case and best-case scenarios, for each preparation module. Here, 20 relative phases between spin-lock pulse and external oscillation were measured for each data set. The detected NEMO amplitude was determined pixel-wise from the standard deviation of the complex signals. Furthermore, the complex signal was fitted with a sinusoidal function and R2 maps were calculated.
Results
Figure 2a exemplarily illustrates banding artifacts in NEMO-weighted images. With S-SL, the calculated amplitude map was also strongly affected, while when using B-SL (Fig. 2b) a significant reduction in artifact formation was observed. The results depicted in Figure 3 indicate, that the detected NEMO amplitude also strongly depends on the spin-lock time used. Here, an excellent agreement between simulation and measurement could be demonstrated. The compensated modules RE-SL, C-SL and B-SL show distinct minima and maxima. For RE-SL and C-SL maxima occur at intervals of ≈20ms, while B-SL has intervals of ≈40ms. Using S-SL, amplitude variations can be seen every ≈10ms. Distinct minima and maxima, however, were not observed.In Figure 4, the in vivo results of tSL signal minima (worst-case) and maxima (best-case) are shown for mimicked oscillations in the brain. Here, it can be seen that S-SL and RE-SL offer poor performance due to local B0 and B1 inhomogeneities. C-SL and B-SL show a significantly increased robustness in NEMO contrast. This was also determined in the amplitude and R2 maps in Figure 5. Here, using the frontal sinus as an example, the highest performance could be identified for the B-SL module. Furthermore, best-case measurements in tSL maxima with RE-SL, C-SL and B-SL show a dramatically increased amplitude of the detected NEMO signal.
Discussion
The present work shows that spin-lock based detection of magnetic oscillations by means of rotary saturation, in contrast to T1ρ-quantification, requires an optimized selection of spin-lock times. The choice of tSL is essential for the resulting magnitude of the detected NEMO amplitude. We were able to show that minima and maxima occur at different tSL for different preparation modules. Due to the compensation of static B0 and B1 inhomogeneities, the B-SL and C-SL modules provided more homogeneous amplitude maps under in vivo conditions. However, in this work, simulations and measurements were carried out only for fSL=50Hz. Future studies will derive a general approach for determining NEMO-maxima depending on the stimulus frequency. This could potentially enable direct imaging of oscillatory neuronal activity in the brain by means of optimized spin-lock preparation.Acknowledgements
This work was supported by the Federal Ministry for Education and Research of the Federal Republic of Germany (BMBF 01EO1504).References
[1] Karbowski K. Sixty years of clinical electroencephalography. Eur Neurol. 1990;30(3):170-5. doi: 10.1159/000117338.
[2] Witzel T, et al. Stimulus-induced Rotary Saturation (SIRS): a potential method for the detection of neuronal currents with MRI. Neuroimage. 2008 Oct 1;42(4):1357-65. doi: 10.1016/j.neuroimage.2008.05.010.
[3] Truong TK, et al. Toward direct MRI of neuro-electro-magnetic oscillations in the human brain. Magn Reson Med. 2019 Jun;81(6):3462-3475. doi: 10.1002/mrm.27654.
[4] Ito Y, et al. Neural magnetic field dependent fMRI toward direct functional connectivity measurements: A phantom study. Sci Rep. 2020 Mar 25;10(1):5463. doi: 10.1038/s41598-020-62277-4.
[5] Charagundla SR, et al. Artifacts in T(1rho)-weighted imaging: correction with a self-compensating spin-locking pulse. J Magn Reson. 2003 May;162(1):113-21. doi: 10.1016/s1090-7807(02)00197-0.[6] Witschey WR, et al. Artifacts in T1 rho-weighted imaging: compensation for B(1) and B(0) field imperfections. J Magn Reson. 2007 May;186(1):75-85. doi: 10.1016/j.jmr.2007.01.015.
[7] Gram M, et al. Balanced spin-lock preparation for B1 -insensitive and B0 -insensitive quantification of the rotating frame relaxation time T1ρ. Magn Reson Med. 2021 May;85(5):2771-2780. doi: 10.1002/mrm.28585.
[8] Coletti C, et al. Functional MRI of neuro-electro-magnetic oscillations: Statistical processing in the presence of system imperfections. IECBES. 2021. doi: 10.1109/IECBES48179.2021.9398751.
[9] Layton KJ, et al. Pulseq: A rapid and hardware-independent pulse sequence prototyping framework. Magn Reson Med. 2017 Apr;77(4):1544-1552. doi: 10.1002/mrm.26235.
Figures