2918
Mapping of weak current-induced magnetic fields in a 3D volume of the human brain at high resolution: 2D vs. Simultaneous multi slice1Danish Research Centre for Magnetic Resonance, Centre for Functional and Diagnostic Imaging and Research, Copenhagen University Hospital, Amager and Hvidovre, Denmark, 2High-Field Magnetic Resonance Center, Max-Planck-Institute for Biological Cybernetics, Tübingen, Germany, 3Department of Biomedical Magnetic Resonance, University of Tübingen, Tübingen, Germany, 4Section for Magnetic Resonance, DTU Health Tech, Technical University of Denmark, Kgs Lyngby, Denmark, 5Sino-Danish Center for Education and Research, Aarhus, Denmark, 6Department of Neurology, Copenhagen University Hospital, Bispebjerg, Denmark, 7Institute for Clinical Medicine, Faculty of Medical and Health Sciences, University of Copenhagen, Copenhagen, Denmark
Synopsis
Exact knowledge of current distributions induced by transcranial electrical stimulation (TES) in the brain is important for effective clinical use of TES. MRCDI uses MRI to measure the TES-induced magnetic fields for estimating the underlying current flow distributions. The estimation methods can benefit from highly sensitive volume MRCDI measurements at a high spatial resolution. Here, we advanced our 2D spoiled gradient-echo-based MRCDI method for a sparse volume acquisition by using simultaneous-multi-slice (SMS) acquisition. Our SMS strategy demonstrated 25% improvement in noise floors against 2D. We test the performance of our methods by phantom and human in-vivo experiments using cable-loop currents.
Introduction
Effective clinical use of transcranial electrical stimulation (TES) requires knowledge of the current flow distribution in the brain. MRCDI combines MRI with TES to measure the TES-induced magnetic fields based on phase imaging, and uses the field component ∆Bz,c that is parallel to the main scanner field to reconstruct the current density distribution in the head1. The accuracy of reconstruction methods can be enhanced by highly-sensitive volume measurements at high spatial resolution.We have recently reported reliable ∆Bz,c recordings with 84 pT sensitivity for a total scan time of 4:20 mins based on an optimally spoiled gradient echo based 2D MRCDI method with acquisition weighting (AW)2. Here, we enhance our method to measure a 3D volume comprised of sparsely distributed slices by using simultaneous multi slice acquisition (SMS)3 and compare it against our 2D benchmark method.
Methods
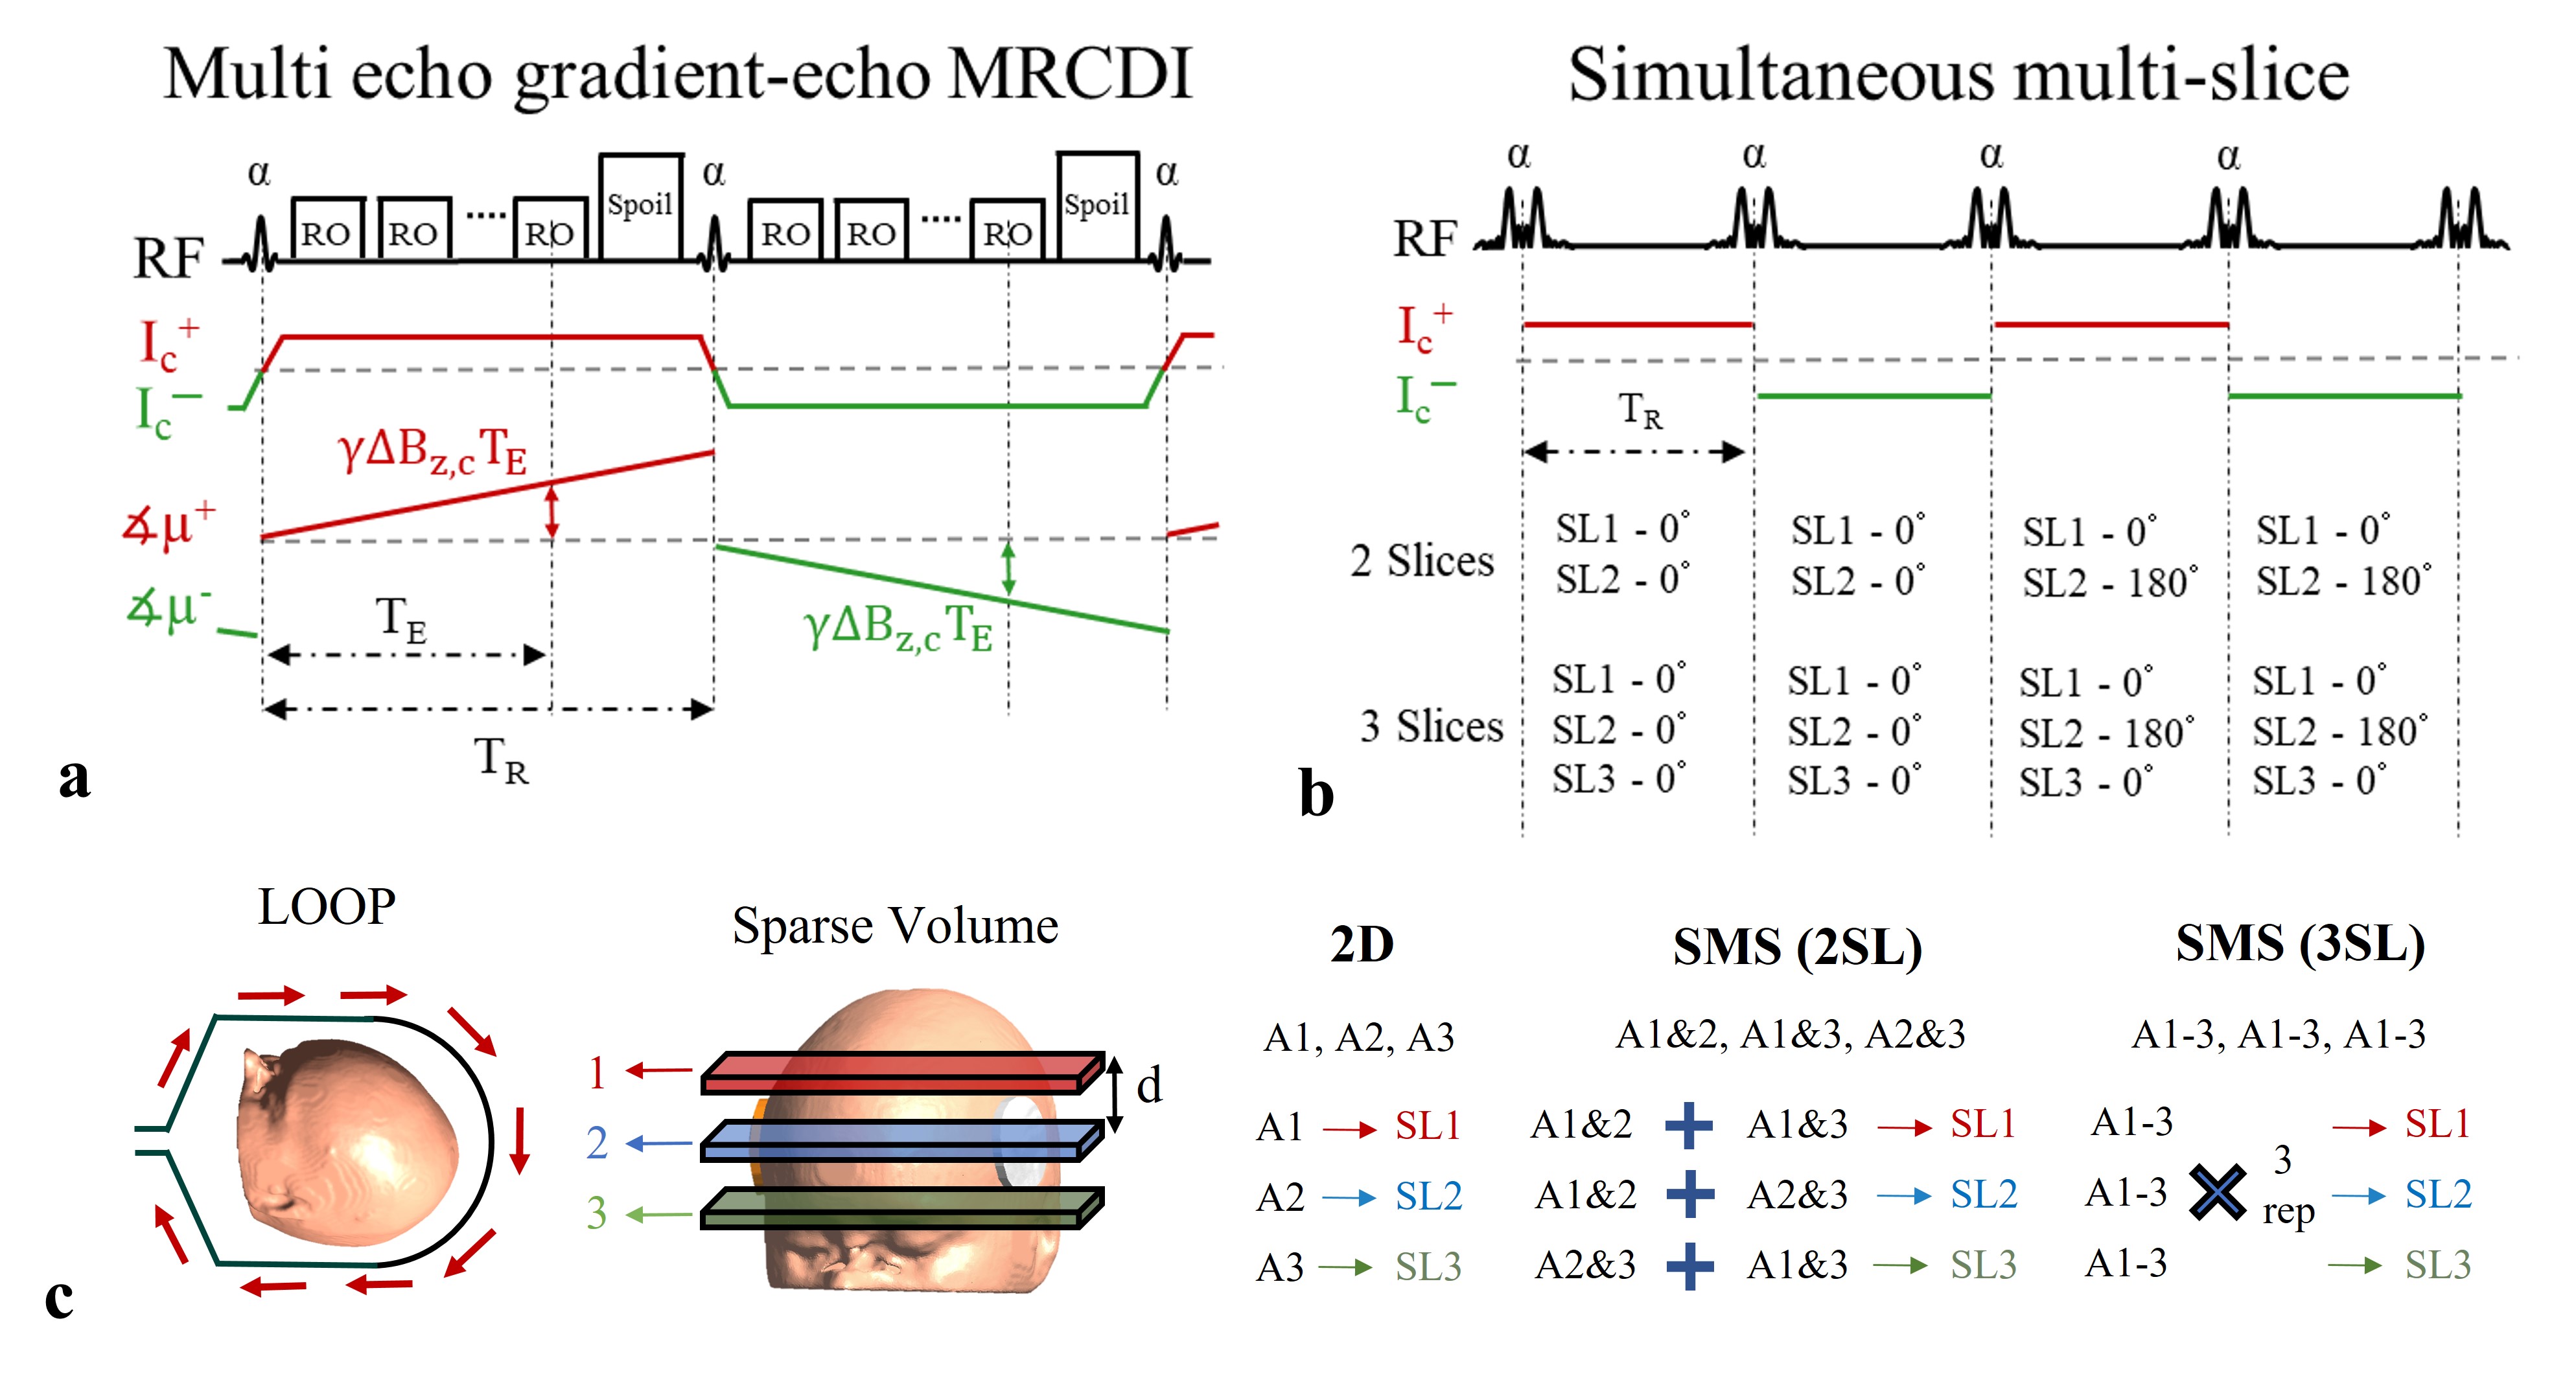
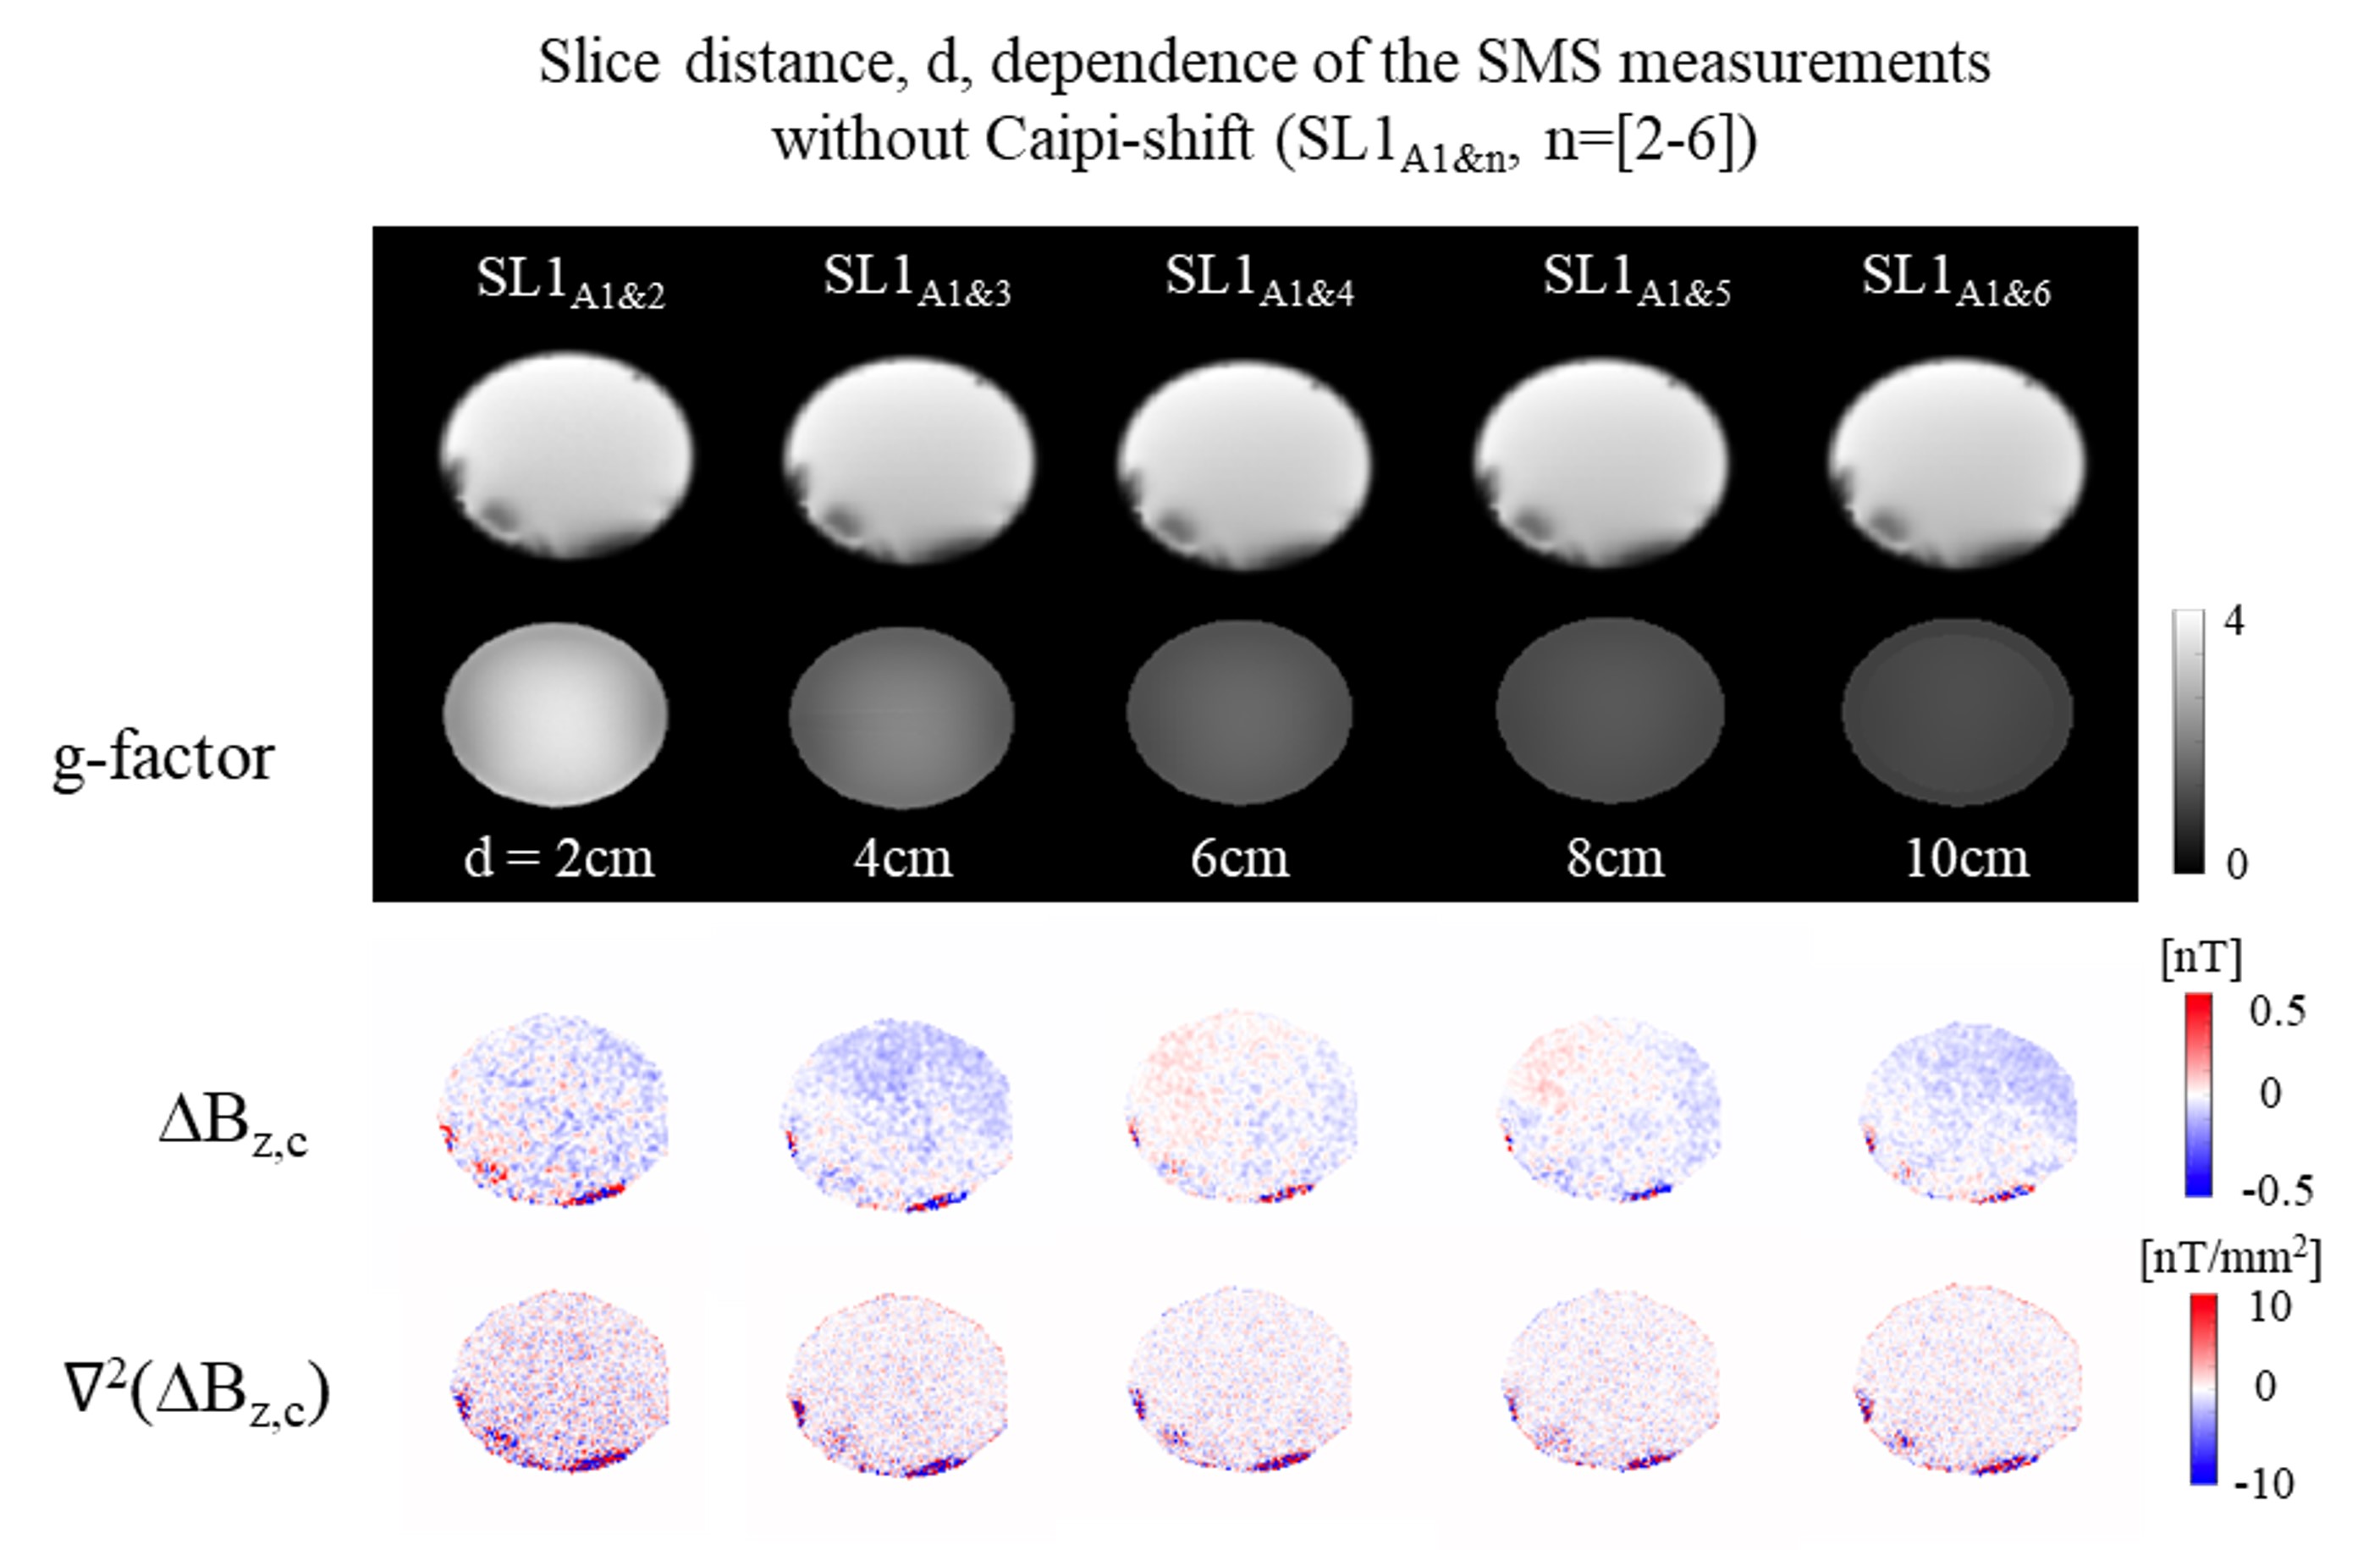
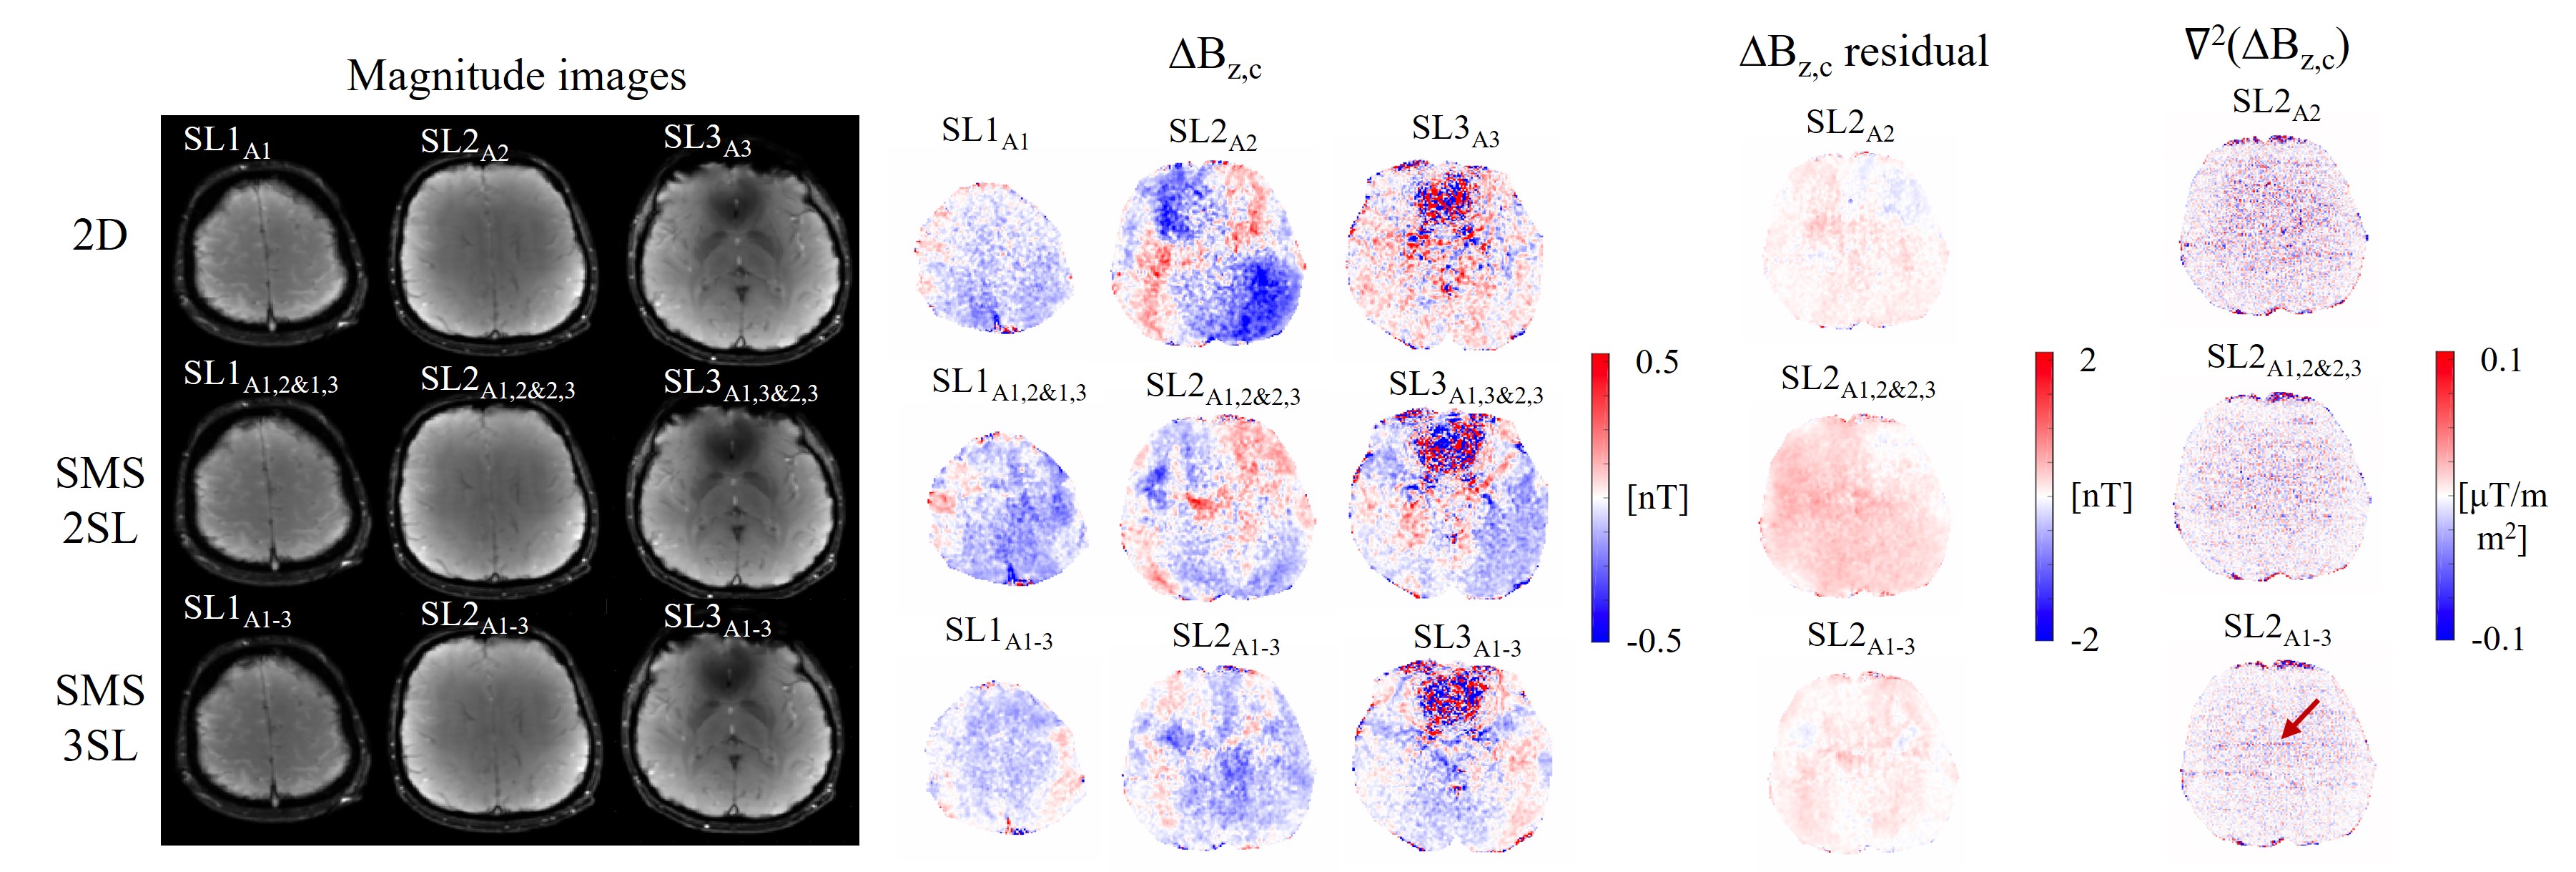
All experiments were performed using a 3T MR scanner (MAGNETOM Prisma, SIEMENS Healthcare) equipped with 64-channel head coils. First, we performed MRCDI control measurements without any currents to observe the noise floors in a spherical phantom (0.1 mM MnCl2 + 1.5 g/L NaCl) with a tube inside (filled with a gel-solution, 0.1 mM MnCl2 + 1.5 g/L NaCl + 1 g/L TX151). We selected six slices SL1-6 with a slice distance of 2 cm and performed six separate measurements with our prior single-slice MRCDI approach2: FOV = 224×183 mm2, tip-angle =30°, = [6.5, 15.1, 23.7, 32.3, 40.9, 49.5 58.1, 66.7] ms, TR=80 ms, and slice thickness ∆z = 3 mm. Strong gradient spoiling with Φsp=16π intra-voxel phase dispersion combined with RF-spoiling was applied. We employed acquisition weighting for an improved point-spread-function similar to 2. An imaging matrix of 176×144 was used. Just after 2D measurements, we employed our SMS sequence to simultaneously excite the first slice and the others in pairs of two (A1&[2-6]) to determine the minimal gap with an acceptable SNR compromise for SMS. Then, we demonstrated the limitations of SMS: 1) SNR is severely compromised for multi (>2) slice acquisition unless a CAIPIRINHA scheme4 ensures a controlled phase shift between slices. 2) CAIPIRINHA schemes with an acceleration factor of R>2 cause an undesirable phase shift between (+) and (-) TES-induced fields (examined using SIEMENS’s spherical phantom D165-10496625). Therefore, SMS was tested in-vivo with two SMS acquisitions of up to three slices with CAIPIRINHA R=2 ensuring a sufficient gap between slices excited simultaneously and overlapping. The superimposed images were separated using a sensitivity encoding (SENSE) reconstruction5. We obtained the coil sensitivity maps required for SENSE reconstruction by “sum-of-squares” normalization. We recruited five subjects to test the in-vivo performance of the two suggested SMS methods against our 2D benchmark method. Both 2D and SMS strategies used the same parameters as in the phantom experiments. We used the LOOP-SETUP (Fig. 1) and selected three slices 2.5 cm apart. First, we acquired three separate 2D measurements (A1, A2, A3). Second, we performed SMS to simultaneously measure each two-slice combination (A1&2, A1&3, A2&3). Last, we used an SMS strategy to measure all three slices simultaneously (A1-3), repeated three times. SMS measurements used CAIPIRINHA with R=2, and combined fields were calculated via simple averaging of repeated measurements. Each strategy involved a total scan time constraint of <10 mins. The experiments were repeated with no currents and 2 mA flowing in the cable-loops to measure noise floors and residuals, respectively. Some MRCDI reconstruction algorithms rely on the Laplacian of ∆Bz,c and the corresponding noise floors were therefore also calculated.Results and discussions
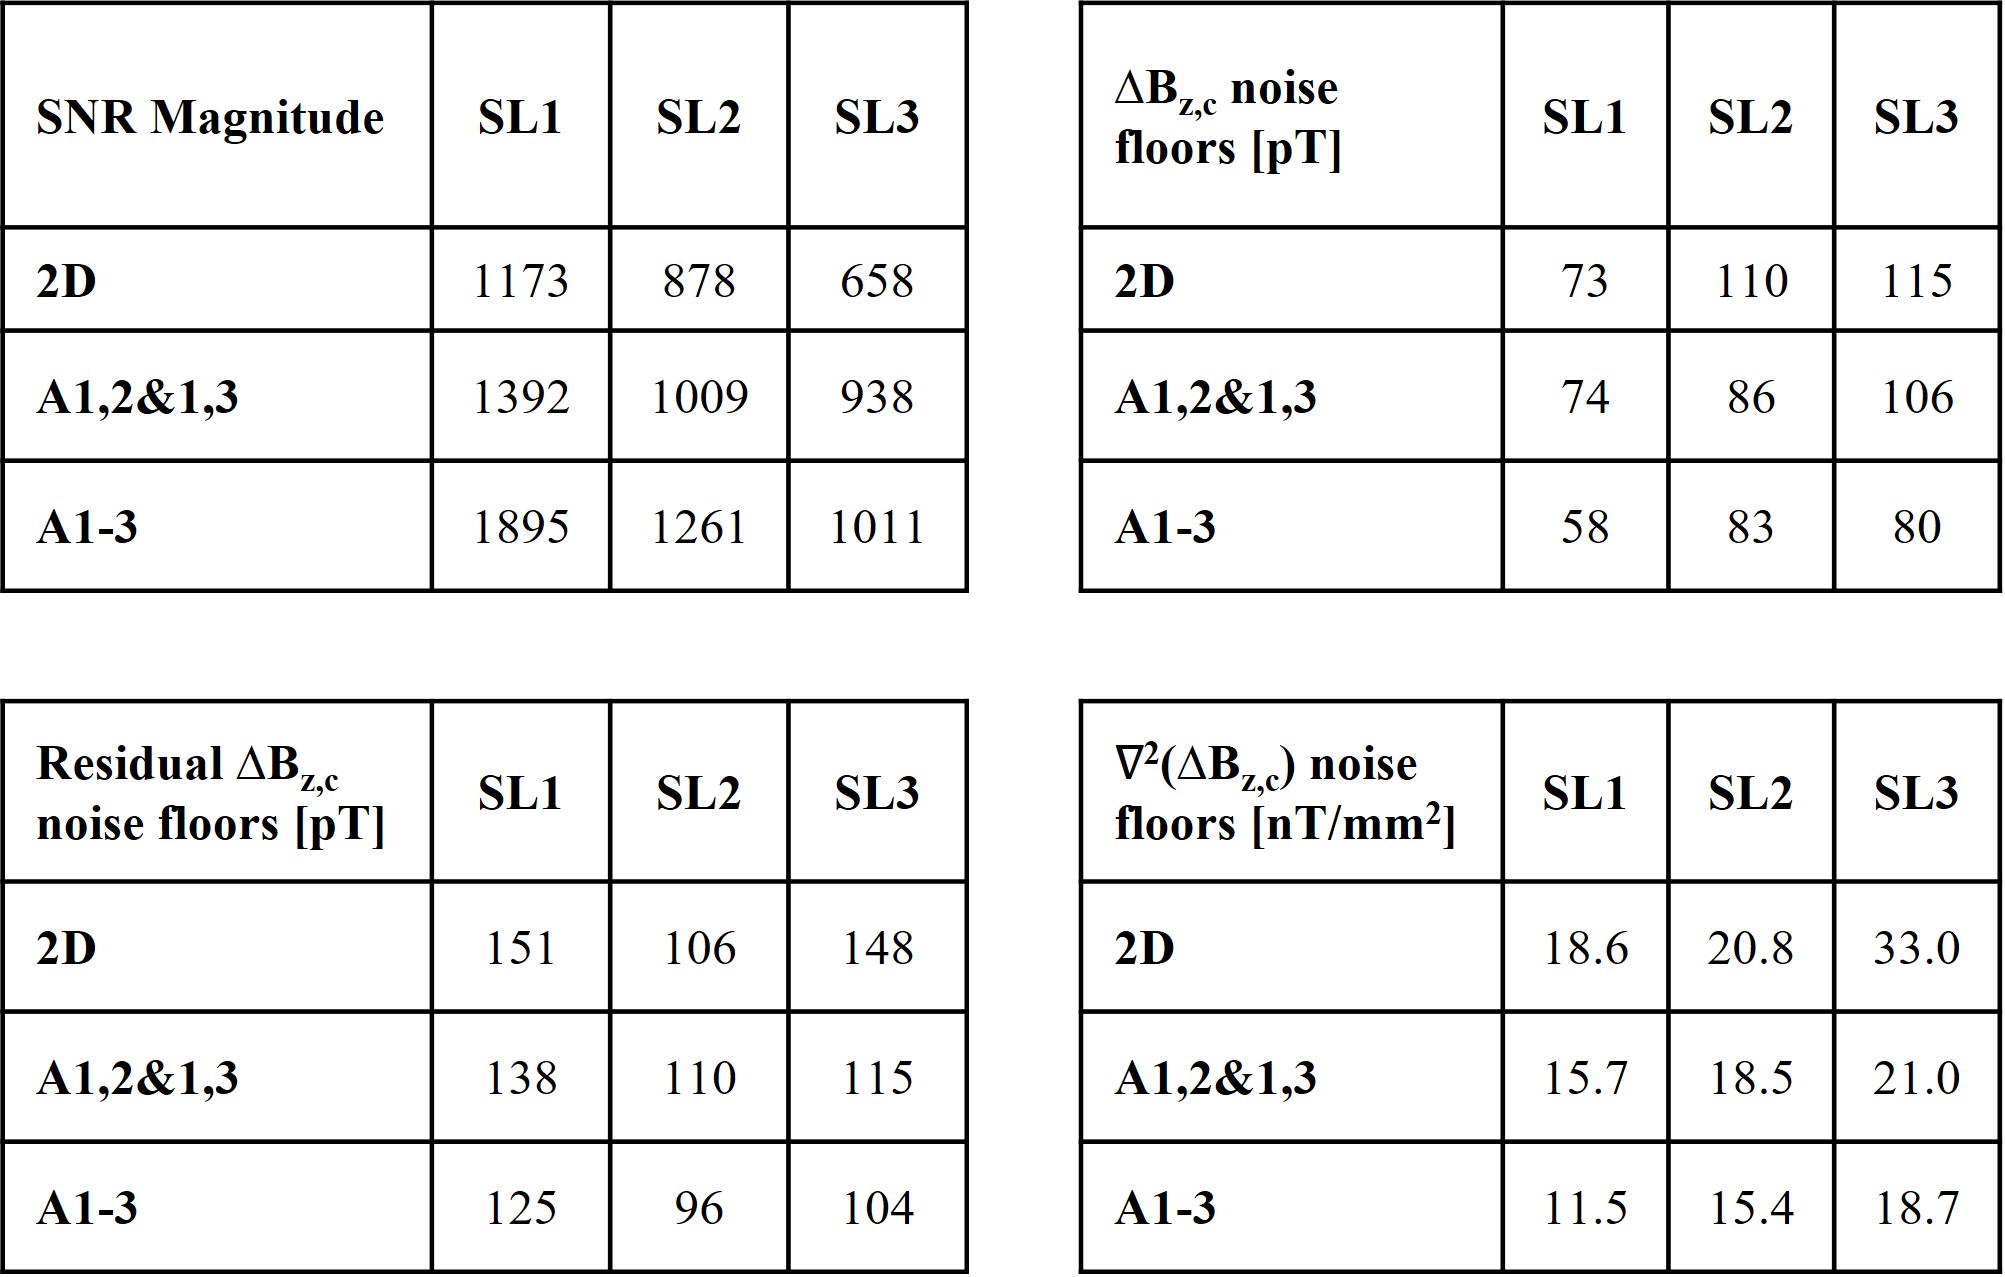
Phantom experiments: MR magnitude, ∆Bz,c, and Laplacian images of SL1 are artifact-free and suggest the use of at least 4 cm gap between simultaneously excited slices for an acceptable SNR compromise (Fig. 2). SMS acquisition of three slices cause significant SNR losses (Fig. 3a). Employing CAIPIRINHA preserved SNR, but it interfered with RF spoiling and hence caused inaccuracies in ∆Bz,c images for R=3. They are resolved for R=2 (Fig. 3b), without any need of using longer TRs as in 6 that may compromise method’s sensitivity in-vivo. Therefore, phantom results suggested acquisition of two or three slices with R=2 for human experiments. SMS strongly improves the quality of MR magnitude images, ∆Bz,c maps, residuals (difference between the measured and simulated ∆Bz,c calculated from the delineated cable paths by using the Biot-Savart law 7), and Laplacian images (Fig. 4). SMS acquisition of three slices with R=2 (noting the sufficient gap of 5 cm between slices excited in-phase) performed best with a 74 pT field sensitivity representing 25% improvement in ∆Bz,c estimation and 37% in Laplacian noise floors against the 2D-benchmark (averaged across five subjects and three slices; Table 1).Conclusion
Our advanced MRCDI method boosted the sensitivity and spatial resolution of MRCDI measurements, and allowed for 3D-volume measurements of TES-induced fields in a reasonable 10 min scan time. The achieved sensitivity is promising for accurate measurements of TES currents in the brain and can provide useful information important for clinical TES.Acknowledgements
The project is supported by Lundbeck foundation with grant numbers R288-2018-236, R244-2017-196, and R313-2019-622 and the Max Planck Society and the German Research Foundation with Reinhart Koselleck Project, DFG SCHE 658/12.References
1. Scott et al. J. Magn. Reson. 1992;97:235–254.
2. Göksu et al. Magn. Reson. Med. 2021;86:3131–3146
3. Barth et al. Magn. Reson. Med. 2016;75:63–81.
4. Breuer et al. Magn. Reson. Med. 2005;53:684–691.
5. Pruessmann et al. Magn. Reson. Med. 1999;42:952–962.
6. Chauhan et al. ISMRM 27th Annual Meeting & Exhibition. Montreal, Canada; 2019. p. 5046.
7. Göksu et al. Eur. J. Med. Phys. 2019;59:142–150.
Figures