2917
In vitro MR-based Electric Properties Tomography during Temperature Increase
Jessica A. Martinez1, Alessandro Arduino1, Kevin Moulin2,3, Adriano Troia1, Oriano Bottauscio1, and Luca Zilberti1
1Advanced Materials Metrology and Life Science, Istituto Nazionale di Ricerca Metrologica, Turin, Italy, 2CREATIS, Lyon, France, 3University Hospital of Saint-Etienne, Saint-Etienne, France
1Advanced Materials Metrology and Life Science, Istituto Nazionale di Ricerca Metrologica, Turin, Italy, 2CREATIS, Lyon, France, 3University Hospital of Saint-Etienne, Saint-Etienne, France
Synopsis
The feasibility of EPT to obtain electrical conductivity data during temperature increase was analyzed. Experiments were performed in two homogeneous phantoms with different saline concentrations during temperature increase.
Introduction
Quantitative MRI is clinically used to provide biomarkers for differentiating tissue type and for analyzing disease progression. Standard quantitative MRI techniques are based on the quantification of the magnetic relaxation properties of the tissues (T1, T2). MR Electrical Property Tomography (EPT) is an emerging technique that permits non-invasive characterization of the tissues’ electrical properties, such as the electrical conductivity (σ)1. EPT allows the use of electrical properties as potential biomarkers to monitor Specific Absorption Rate (SAR)2 and thermal dosimetry during MR examinations.The change of magnetic properties with temperature during MRI examinations has been widely evaluated3. However, the ability to estimate σ during temperature increase is still a subject of examination. This work analyzes the ability of EPT to monitor the evolution of the electrical conductivity of two homogeneous phantoms previously cooled down and allowed to return to thermal equilibrium.
Methods
Temperature varying σ maps were continuously acquired for 2 hours at 3 T (Siemens, Prisma). Acquisitions were performed consecutively on two cylindrical homogeneous gelatine phantoms (Fig.1-A). Phantom 1 had a greater concentration of salt compared to Phantom 2 (0.5% vs. 0.1%).The phantoms were previously cooled down and allowed to return to room temperature during the MRI acquisitions. Temperature increase was monitored using fiber optic probes (Opsens, MultiSens, sample rate: 5 seconds, accuracy: ±0.30 °C, resolution: 0.01 °C).
The two phantoms were placed vertically at the scanner isocenter. Phase data was acquired using a 3D bSSFP sequence (Fig.1-B) using the birdcage coil as TX/RX. Maps of σ were reconstructed offline by applying a phase-based Helmholtz-EPT approach implemented in EPTlib4, with cuboid Savitzky-Golay kernel of size 4.
Results
Temperature increased ~8 °C for phantom 1 and ~6 °C for phantom 2. Median conductivity values with respect to temperature increase are shown in Fig. 2-A. Measured conductivity values increased with temperature. For phantom 1, median values increased from 2.9 S/m to 3.2 S/m. For phantom 2, conductivity increased from 1.2 S/m to 1.3 S/m. Linear fit suggests that the conductivity will increase with a rate of 0.04 S/m/°C and 0.02 S/m/°C for phantom 1 and phantom 2, respectively. Fig 2-B shows the boxplot distribution of conductivity on the center slice for the initial and final temperature. Sigma variability was increased for phantom 1 (IQR: σ0=1.6 S/m, σf=2.2 S/m), whereas for phantom 2, variability did not change (IQR: σ0=σf=0.5 S/m)Conductivity maps generated using EPT at the start and at 2 hours after the beginning of the acquisition for the center slice are shown in Fig 3. The maps suggest that EPT analysis during temperature increase will be prone to susceptibility artifacts, characteristic of bSSFP acquisitions, and possibly enhanced by the temperature drift.
Discussion and Conclusion
In this work, we demonstrated the feasibility of obtaining EPT-based electrical conductivity maps during temperature increase using a Helmholtz-EPT approach. To do so, the phase of a bSSFP sequence was acquired. bSSFP-based examinations are fast and efficient acquisitions that provide a reliable phase comparable to Spin-echo approaches. However, bSSFP is heavily sensitive to off-resonance due to changing temperatures. Nonetheless in the range of a ~8°C increase studied here, reliable conductivities were estimated. Further work needs to be performed to develop a more robust protocol to obtain artifact-free data and to analyze phantoms with different ranges of temperature increase and electrical conductivities.Acknowledgements
The results here presented have been developed in the framework of the 18HLT05 QUIERO project. This project has received funding from the EMPIR programme co-financed by the Participating States and from the European Union’s Horizon 2020 research and innovation programme.References
1. Comput Math Meth Med, vol.2013, art.no.546562
2. MRM, vol.68, pp.1117-26;
3. Int Mag Res Im, vol. 2011,pp 271-288.
4. Applied Sciences, vol.11, art.no.3237, doi:10.3390/app11073237
Figures
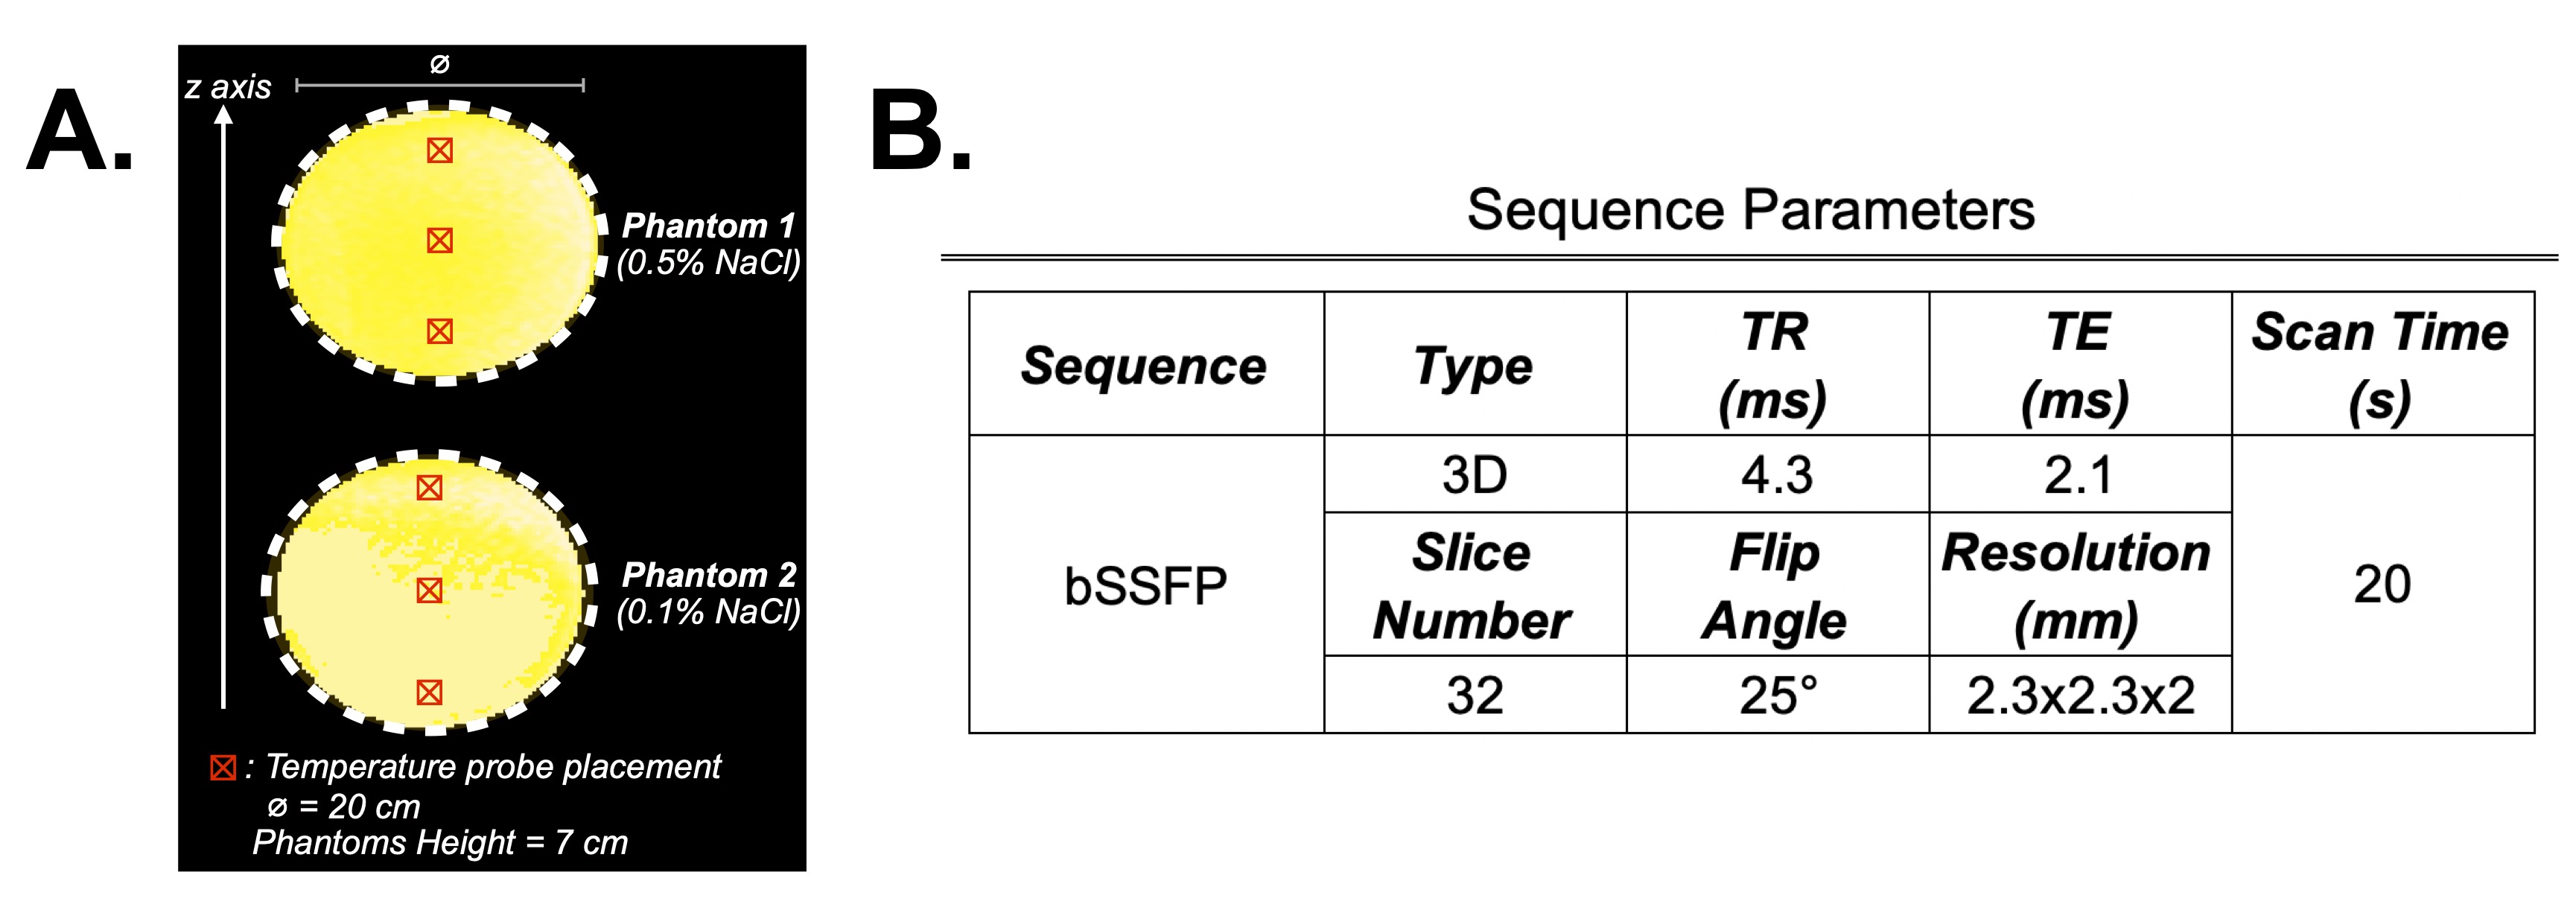
Fig. 1. (A) Analyzed setup, Two cylindrical gelatine-based phantoms with different saline (NaCl) concentrations. Temperature data was acquired using fiber optic Temperature probes at three locations in the phantom and averaged out. (B) Sequence parameters used. Phase data were acquired for 2 hours to reconstruct σ maps using a phase-based Helmholtz-EPT approach.
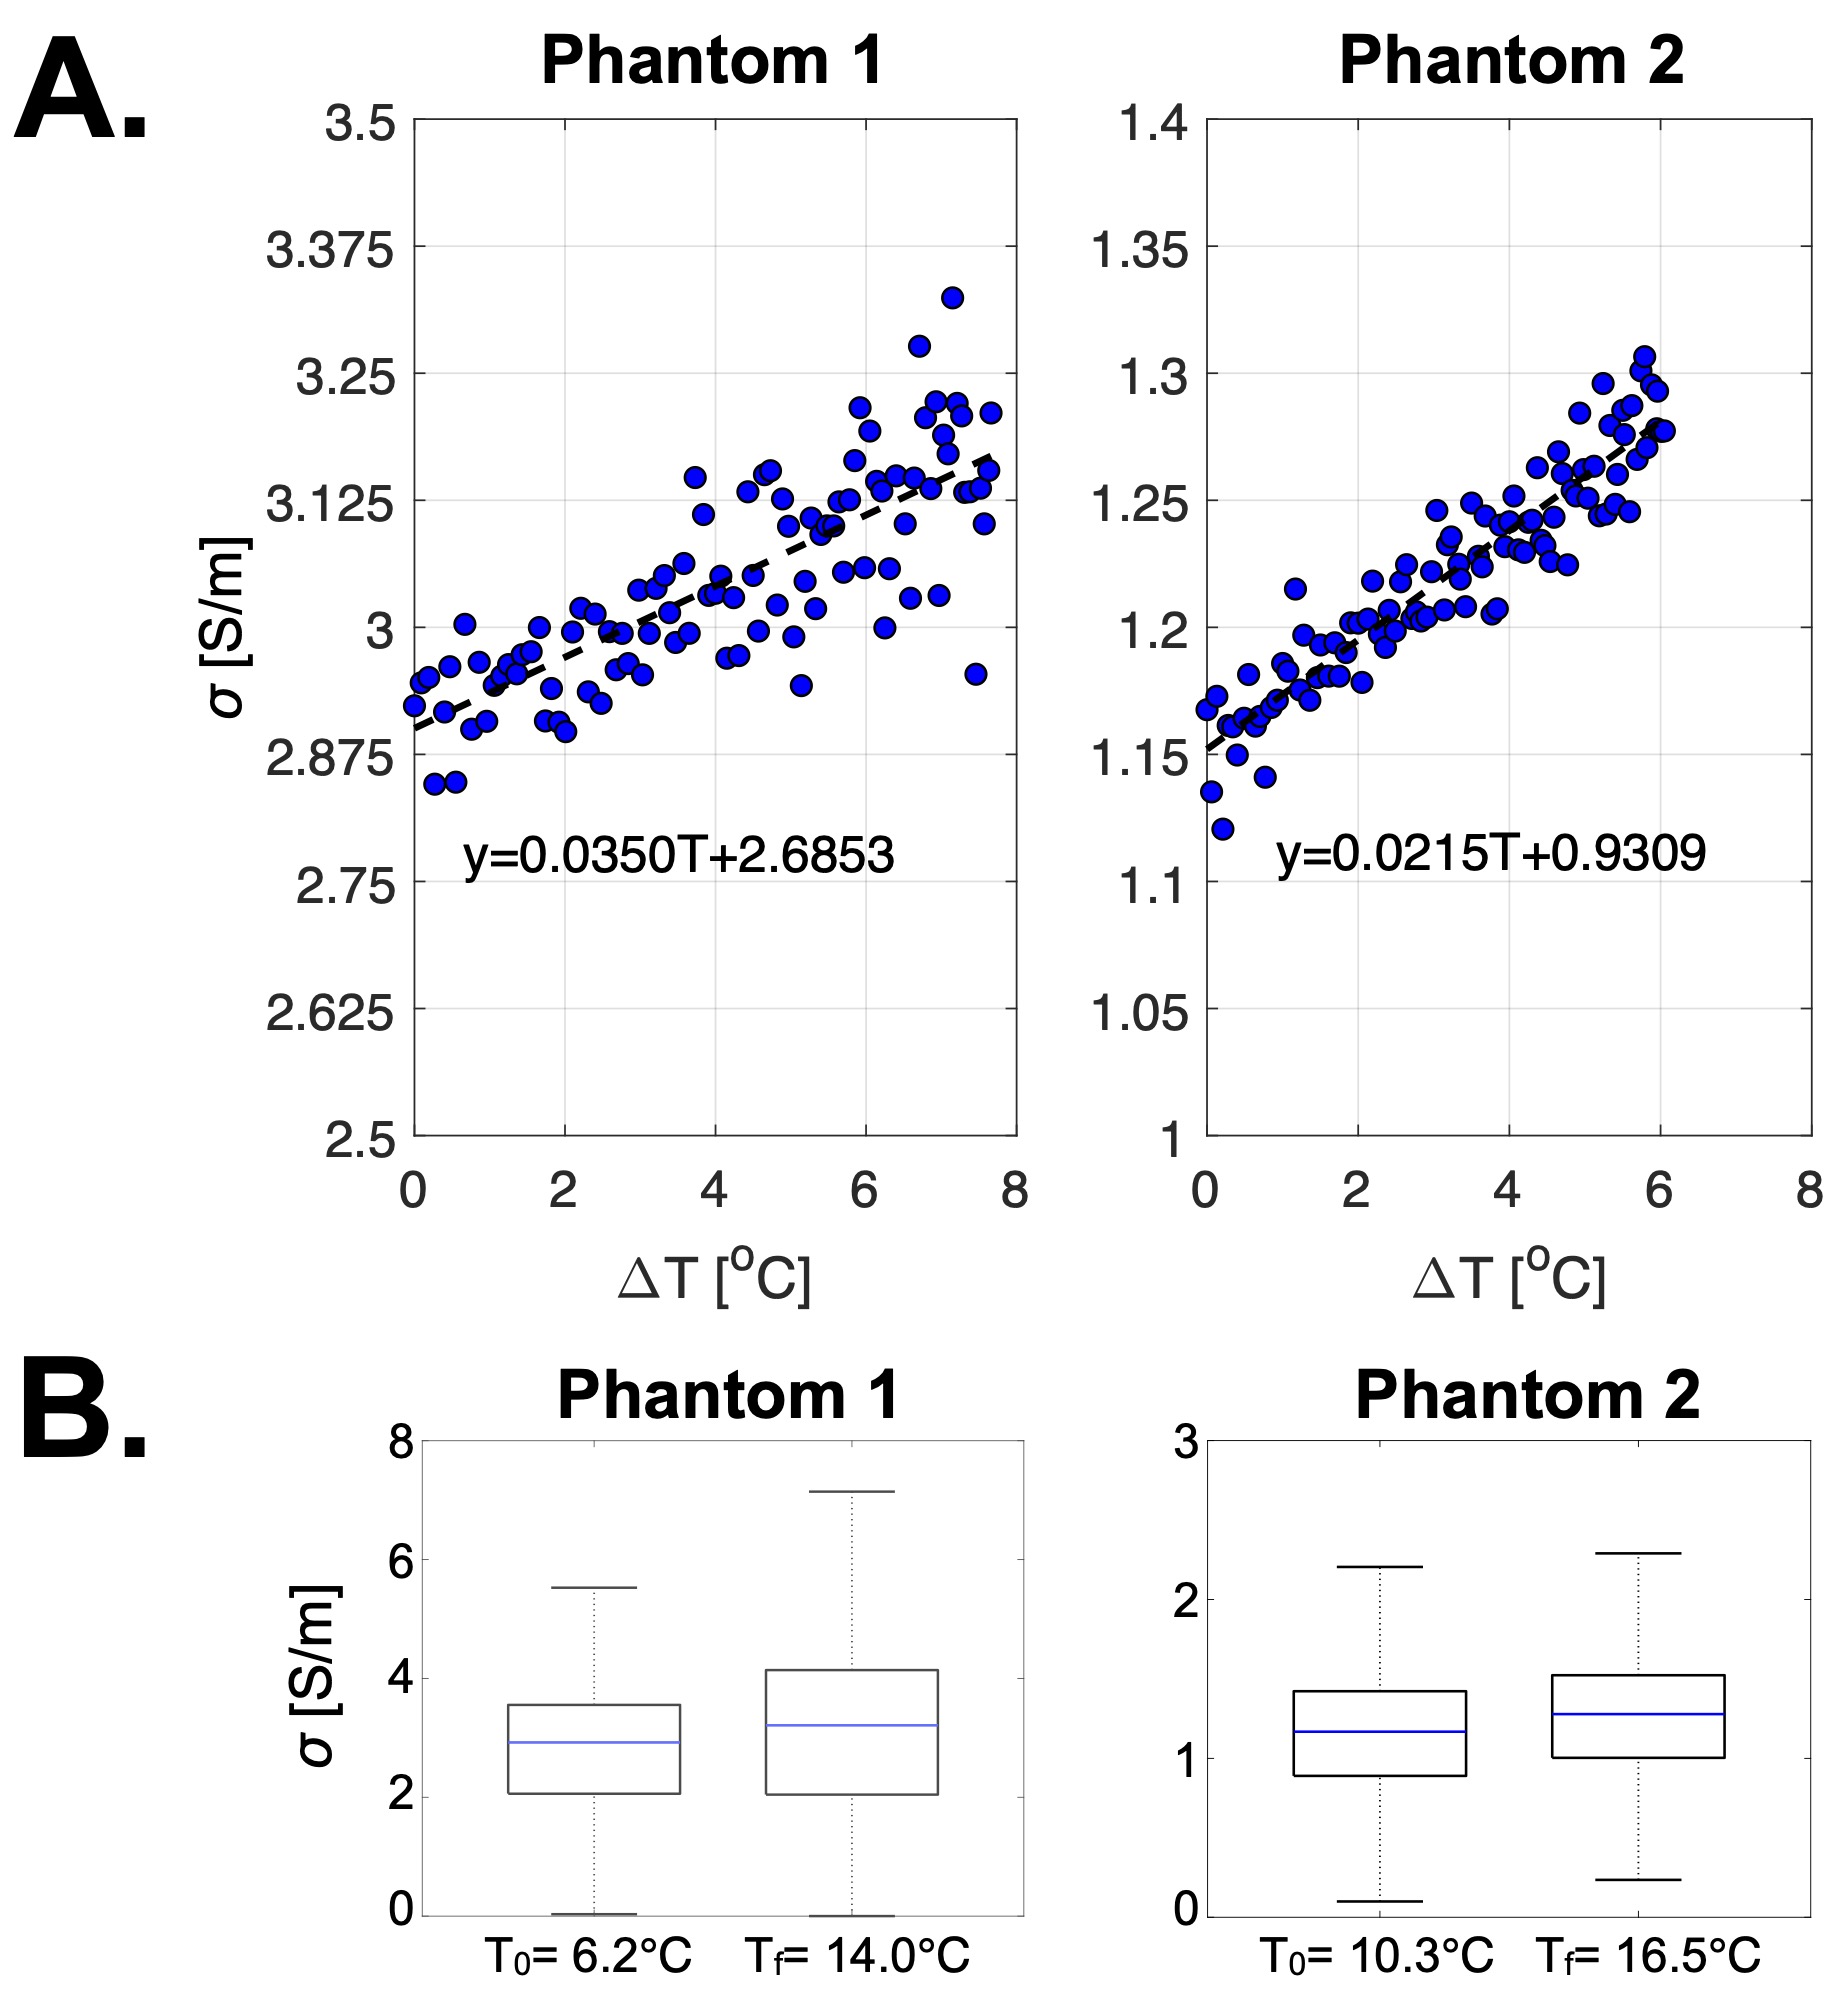
Fig. 2. (A) Median electrical conductivity values as a function of temperature for the two phantoms. Electrical conductivity increased with temperature. For the two phantoms, the fitting equation was calculated from the absolute values of the measured temperature. (B) Electrical conductivity boxplot distribution for the initial and final temperature. Note: y-axes have different limits.
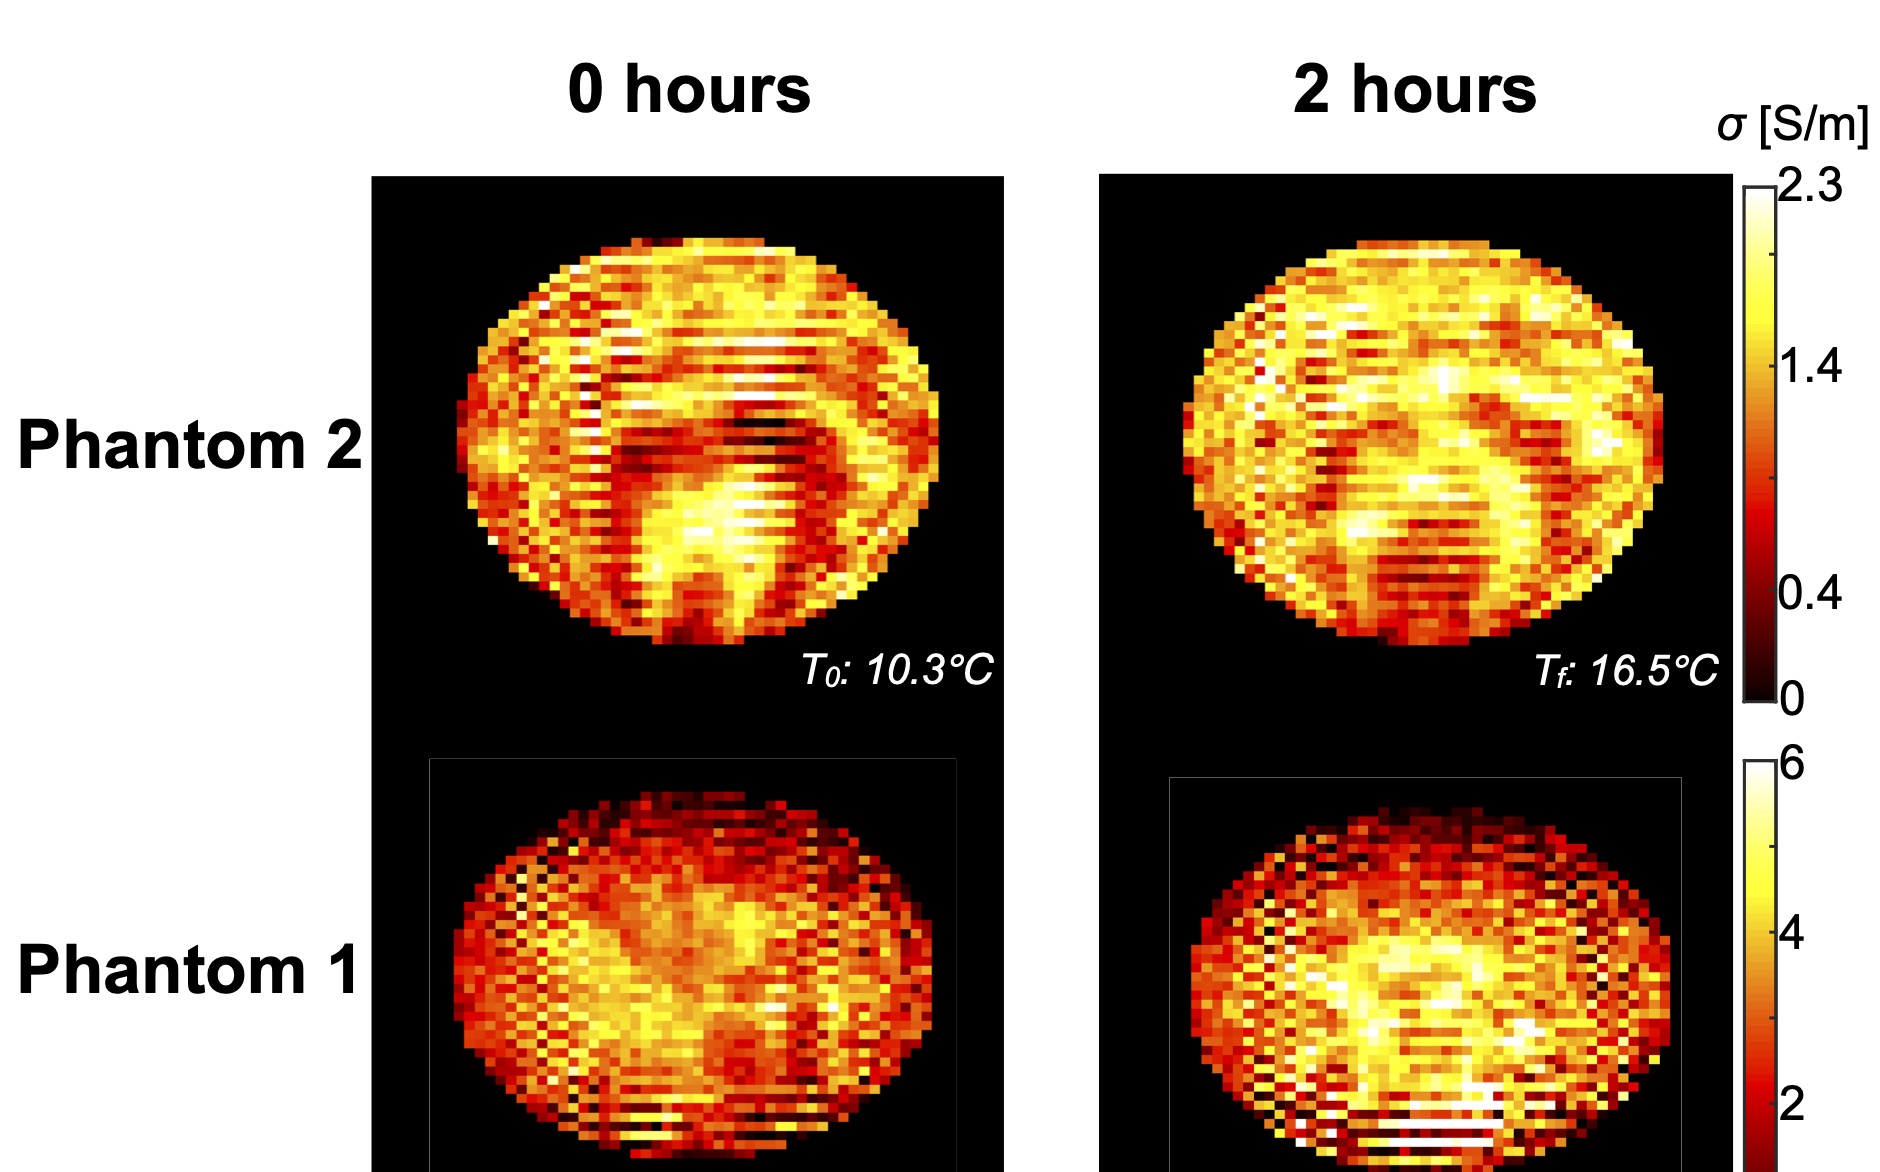
Fig. 3. Central Slice electrical conductivity maps (S/m) during temperature increase of the two analyzed phantoms at the initial and last time point of MRI scans. While the change of conductivity is evident, data acquisition was sensitive to image artifacts.
DOI: https://doi.org/10.58530/2022/2917