2915
Investigating Spiral Trajectories for Sub-second Conductivity Imaging in MREPT1Computer Assisted Clinical Medicine, Medical Faculty Mannheim, Heidelberg University, Mannheim, Germany, 2Mannheim Institute for Intelligent Systems in Medicine, Medical Faculty Mannheim, Heidelberg University, Mannheim, Germany
Synopsis
Magnetic Resonance Electrical Properties Tomography (MREPT) technique is used to obtain conductivity (σ) and permittivity (ε), using phase of the B1+ information. While spin echo and bSSFP based pulse sequences were shown to successfully obtain phase images, they are either very slow or suffer from artifacts and require multi-acquisitions. To overcome these limitations, in this work we investigate the use of spiral trajectory-based sequences in MREPT. Our results indicate that even for sub-second acquisition times, conductivity maps can be successfully acquired via spiral trajectory-based sequence, and therefore can improve the utility of MREPT techniques by shortening the acquisition time drastically.
Introduction
Magnetic Resonance Electrical Properties Tomography (MREPT) aims to obtain electrical properties, namely conductivity ($$$\sigma$$$) and permittivity ($$$\varepsilon$$$), which can be useful for diagnosing and monitoring various diseases. However, in order to utilize this technique, transceive phase ($$$\phi_{tr}$$$) should be known. In literature, spin-echo and bSSFP based sequences are commonly used for obtaining $$$\phi_{tr}$$$1. However, spin-echo based sequences suffer from lengthy acquisition time, while bSSFP based sequences are susceptible to B0 inhomogeneity (banding artifacts) and require multiple acquisitions to overcome that issue. Therefore, especially for the challenging tissue types such as heart or lung, a fast and reliable pulse sequence is required.To this end, we investigate the utilization of spiral trajectory-based sequences for the use in MREPT, since they were shown to provide high acquisition speed, high SNR efficiency, low minimum TE, and robustness against motion artifacts; and were successfully demonstrated in different rapid imaging applications2,3. For this purpose, we have developed a gradient-echo based spiral sequence and implemented a reconstruction framework for obtaining conductivity images from the non-Cartesian trajectory. We present phantom measurements to demonstrate the performance of the spiral trajectory in conductivity imaging.
Methods
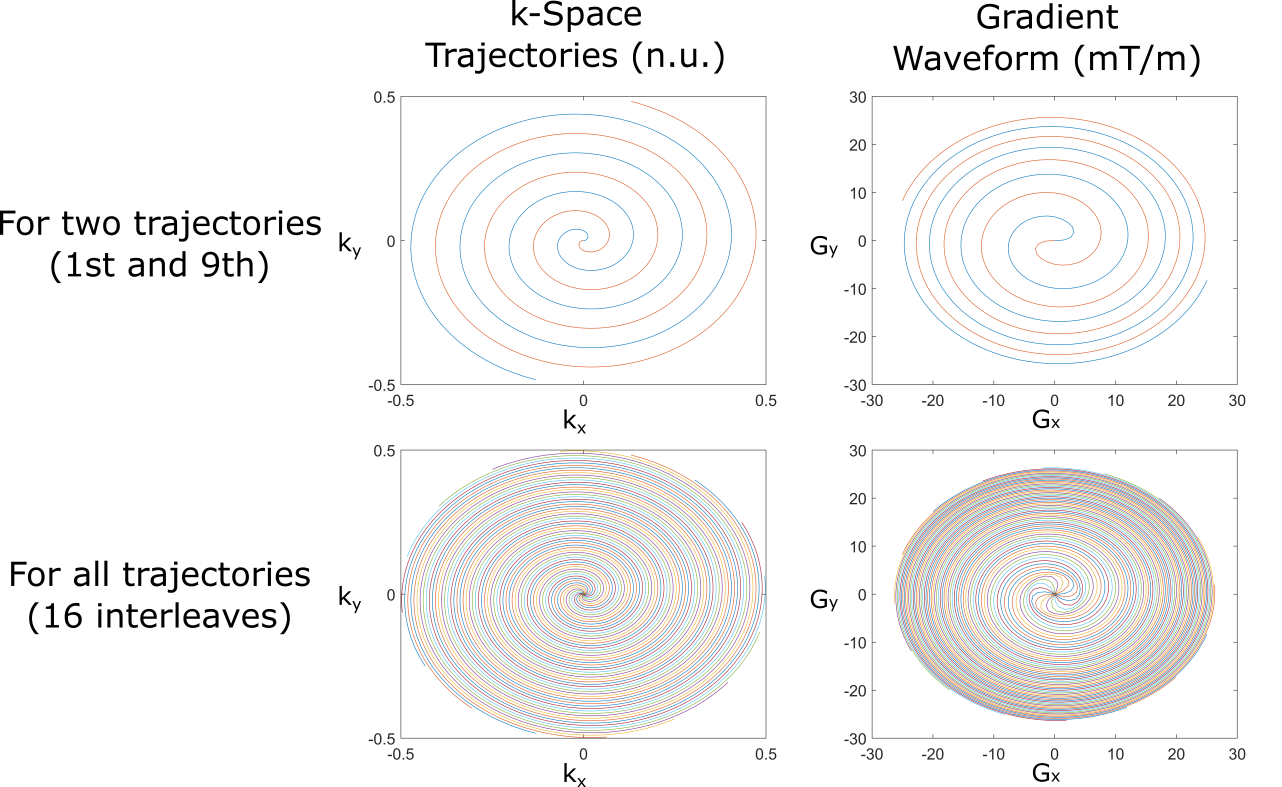
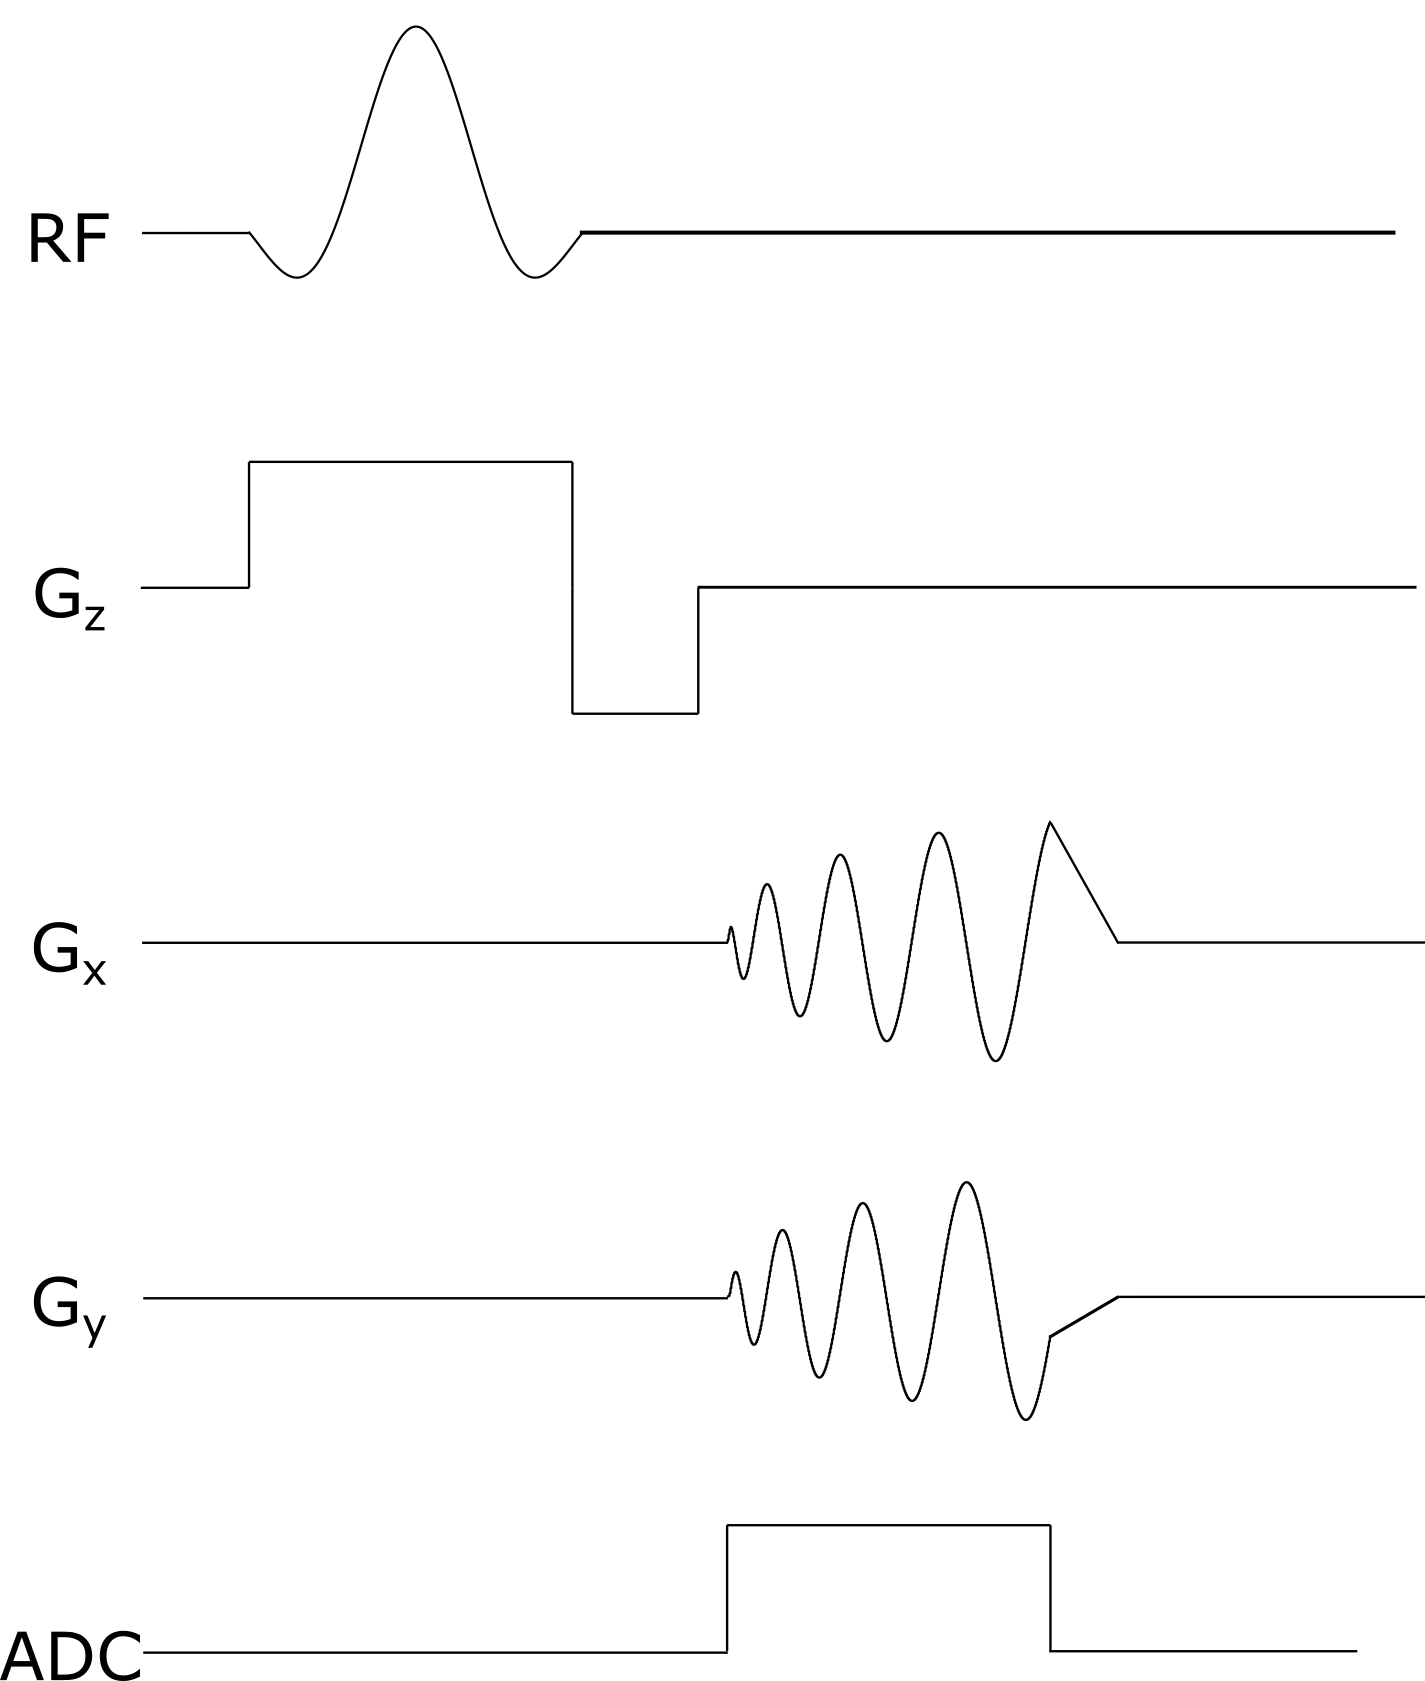
For sampling k-space uniformly, widely used Archimedean spiral trajectories4 were implemented as shown in Figure 1. To stay within the safety limits, maximum gradient strength and slew rate were chosen 28 mT/m and 120 mT/m/ms, respectively.For the MRI measurements, a gradient-echo based pulse sequence with spiral trajectory is used (Figure 2) with the following parameters: TR/TE = 10/1.6 ms, FOV = 240mmx240 mm, in-plane resolution = 2mmx2mm, 2.5 mm slice thickness, 16 spiral interleaves, 20 slices, 15° flip angle, 18 averages. It should be noted that with these parameters, a single image can be obtained in 0.16 seconds (6.25 frames per second).
For the phantom experiment, a cylindrical z-independent phantom with a diameter of 16 cm and height of 20 cm was constructed. For background, agar-saline gel (20 g agar-agar, 2 g/L NaCl, 1.5 g/L NiCl2), and for structures, saline solution (6 g/L NaCl, 1.5 g/L NiCl2) was prepared. Structures in the sample have diameter of 3.5 cm. Experiments were conducted on 3T scanner (Magnetom Skyra, Siemens Healthineers, Germany).
Due to the nature of the spiral trajectory, the outer part of the k-space is less-densely sampled than the central part. To recover the missing data points, iterative self-consistent parallel imaging reconstruction (SPIRiT)5 framework was utilized. This method uses Nyquist‐sampled calibration data to train a calibration kernel, and then applies the kernel to synthesize unacquired data samples. To obtain reconstructions efficiently from the non-Cartesian acquisitions, image domain SPIRiT reconstructions were utilized and were solved via iterative least squares (LSQR) method.
For obtaining conductivity images from the reconstructions, 2D generalized phase based convection-reaction-diffusion equation MREPT (cr-MREPT) technique with artificial diffusion term is used6. Conductivity images were generated for individual receiver coil elements and then combined by simple averaging to obtain final conductivity images.
Results
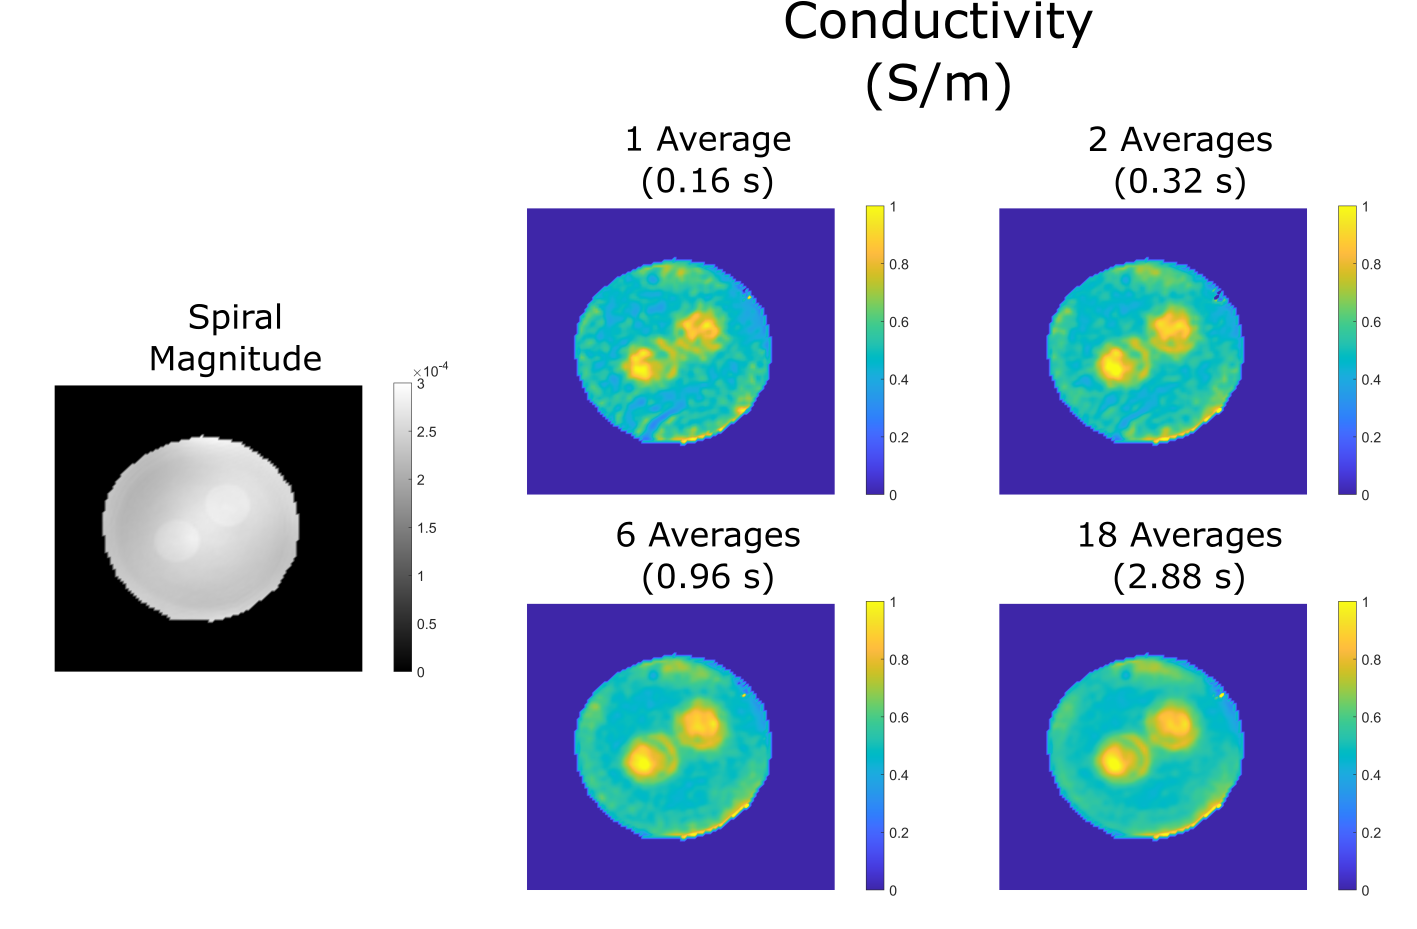
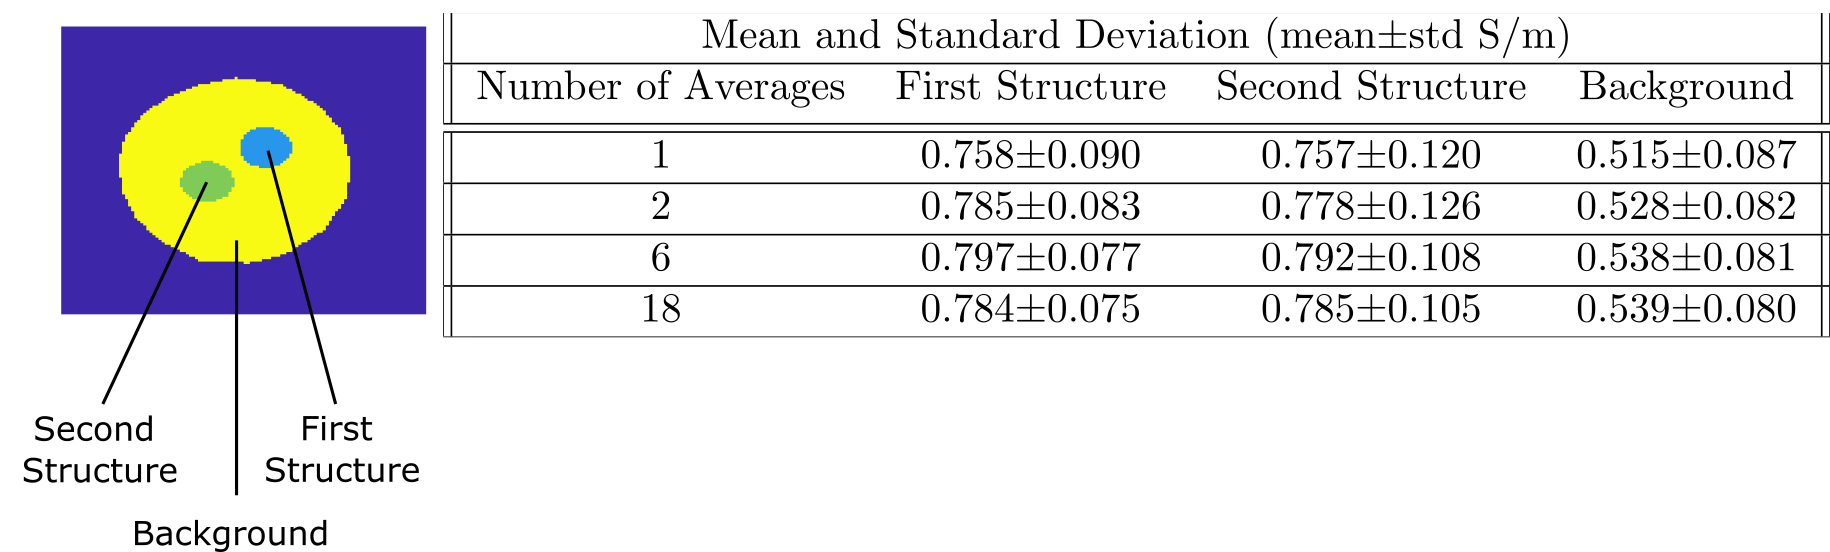
In Figure 3, a magnitude image obtained via the spiral acquisition and SPIRiT reconstruction is displayed in grayscale. In addition, conductivity images obtained with different number of averages are shown. Though affected by noise, even in the conductivity image obtained with one average structures could be visualized. With increasing the number of averages, the SNR is improved and structures can be seen more clearly.In Figure 4, region masks are applied via visual inspection on the spiral magnitude image. Mean and standard deviation of conductivity values for both structures and background region are reported for several number of averages. Both structures have similar mean conductivity: With 18 averages, mean±std is 0.784±0.075 S/m for first structure and 0.785±0.106 S/m for second structure. They provide distinct contrast with respect to the background region (0.539±0.080 S/m, 18 averages).
Discussion and Conclusion
As seen in Figure 4, for the first couple of averages standard deviation reduces, afterwards it stays almost constant. One of the possible explanations is that there are many different sources of error in MREPT technique and rather than noise induced, the standard deviation is affected heavily by these errors. In phase-based MREPT techniques, strong assumptions must be used, especially the transceive phase assumption7 or constant transmit B1 (B1+) magnitude1 assumption can affect final conductivity images significantly.We have developed a spiral trajectory-based acquisition and reconstruction framework to attain conductivity images rapidly and displayed promising results with a phantom experiment. Our initial results indicate that robust conductivity images can be obtained successfully even for sub-second acquisition times. While further studies are warranted, this framework can enable conductivity imaging in challenging tissue types, and can further improve its practical utility.
Acknowledgements
No acknowledgement found.References
1. U. Katscher, D.-H. Kim, and J. K. Seo, “Recent progress and future challenges in MR Electric Properties Tomography,” Computational and Mathematical Methods in Medicine, vol. 2013, pp. 1–11, 2013.
2. J. G. Pipe and D. D. Borup, “Generating spiral gradient waveforms with a compact frequency spectrum,” Magnetic Resonance in Medicine, 2021.
3. Z. Li, H. H. Hu, J. H. Miller, J. P. Karis, P. Cornejo, D. Wang, and J. G. Pipe, “A spiral spin-echo MR imaging technique for improved flow artifact suppression in T1-weighted postcontrast brain imaging: A comparison with Cartesian turbo spin-echo,” American Journal of Neuroradiology, vol. 37, no. 4, pp. 642–647, 2015.
4. J. G. Pipe and N. R. Zwart, “Spiral trajectory design: A flexible numerical algorithm and base analytical equations,” Magnetic Resonance in Medicine, vol. 71, no. 1, pp. 278–285, 2013.
5. M. Lustig and J. M. Pauly, “SPIRiT: Iterative Self‐consistent Parallel Imaging Reconstruction from arbitrary k‐space,” Magnetic Resonance in Medicine, vol. 64, no. 2, pp. 457–471, 2010.
6. N. Gurler and Y. Z. Ider, “Gradient‐based electrical conductivity imaging using MR phase,” Magnetic Resonance in Medicine, vol. 77, no. 1, pp. 137–150, 2016.
7. A. L. H. M. W. van Lier, D. O. Brunner, K. P. Pruessmann, D. W. J. Klomp, P. R. Luijten, J. J. W. Lagendijk, and C. A. T. van den Berg, “B1+ phase mapping at 7T and its application for in vivo electrical conductivity mapping,” Magnetic Resonance in Medicine, vol. 67, no. 2, pp. 552–561, 2011.
Figures