2910
Comparison and validation of multiple MR-EPT methods with ground truth vector network analyzer measurements1IADI U1254, INSERM, Université de Lorraine, Nancy, France, 2ICube, Université de Strasbourg, CNRS, Strasbourg, France, 3CIC-IT 1433, CHRU Nancy, INSERM, Université de Lorraine, Nancy, France
Synopsis
Many MR-EPT reconstruction methods have been published, however, there is a lack of comparative experiments to verify the reconstructed electrical properties (EP) maps. In this work, we compared and validated the phase-based (PB), complex-image-based (CIB), and their simplified methods with ground truth vector network analyzer measurements on different conductivity phantoms. After serval comparative experiment repetitions, the complex-image-based method by Soullié et al.[1] was the most consistent to the VNA ground truth measurements. The proposed setup can be used to compare other MR-EPT reconstruction methods.
INTRODUCTION
Different reconstruction methods for magnetic resonance electrical properties tomography (MR-EPT) have now been published to estimate the conductivity and permittivity of tissues from MR measurements. However, there is a lack of comparative experiments between ground truth values, as measured by a vector network analyzer (VNA), and the reconstructed EP maps. In this work, we evaluated several phase-based (PB) and complex-image-based (CIB) methods, including the method by Soullié et al.[1], which was shown to overperform others in numerical simulations. Conductivity phantoms were made and scanned to evaluate the inter-session reproducibility of MR-EPT, and ground truth measurements were obtained using a VNA and a dedicated probe.METHODS
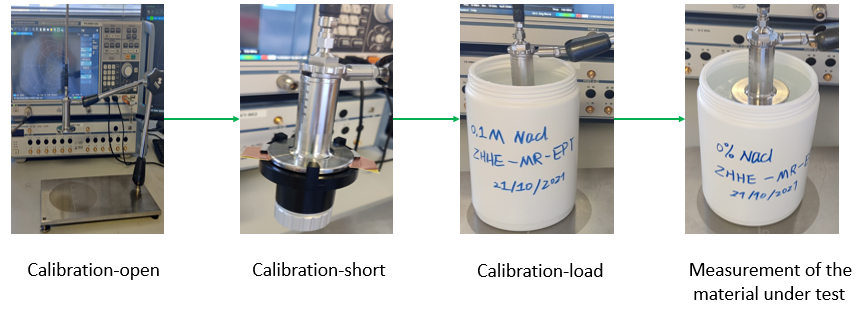
Phantoms: We made five simple gel tube phantoms (diameter = 10 cm, height=15 cm) consisting of 1 liter of deionized water, 15 g agar and different mass concentrations of NaCl, 0%, 1%, 2.5% and 5%, respectively.Ground truth measurements: The reflection coefficient of dielectric materials (Γ) can be expressed by the complex relative permittivity (εr) and conductivity (σ), Γ= εr - jσ/( ε0) where ω is the angular velocity and ε0 is the vacuum permittivity. We used the dedicated probe from a commercial dielectric assessment kit (DAK 12, from SPEAG, Zurich, Switzerland), which was connected to a VNA (VNA ZNB 4, Rhodes & Schwartz), see Figure1. Reflection coefficients were measured by the VNA at high frequencies [50MHz, 150MHz], in open, short, and loaded circuit modes respectively, to calibrate the instrument. A reference saline solution (0.1 M NaCl) with known EP values was used for the loaded circuit mode. Finally, reflection coefficients from our phantoms were measured and permittivity and conductivity values were inferred [2], at the Larmor frequency of our scanner (Siemens Prisma 3T), i.e. 123MHz. Using a known EP value TSL-HU16 gel, we ensure that the measurement error is below 2.5%. Measurements, including the calibration procedure, were repeated over 4 sessions (4 different days, within 6 hours of the MR-EPT session) and temperatures were reported each time.
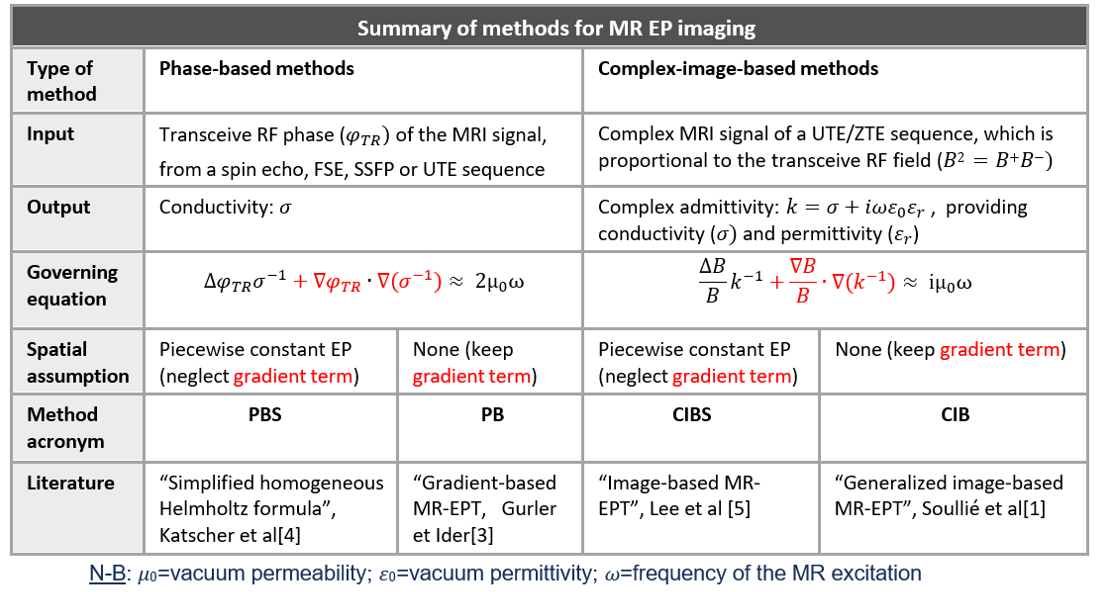
Phase-based and Complex-image-based MR-EPT: MR-EPT methods aim at reconstructing EP maps from images with strong RF weighting (B1+ and B1- weighting), which are spatially modulated by local EP changes. We used two categories of MR-EPT methods (see Figure 2): phase-based (PB) methods [3] and complex-image-based methods (CIB) [1]. Phase-based methods use a phase image as an input, assumed to be the transceive RF phase (i.e. the phase of 𝐵1+𝐵1−) to reconstruct conductivity(σ). Complex-image-based methods use the complex MRI signal of a UTE/ZTE sequence with a low flip angle, which is proportional to the complex transceive RF field (𝐵2 = 𝐵1+𝐵1−), to provide conductivity (σ) and permittivity (εr). Both PB and CIB methods involve a numerical solver to invert a regularized Helmholtz-type equation (regularization parameter was tuned manually for each method). Both methods have a simplified version, called phase-based simplified (PBS) [4] and complex-image-based simplified (CIBS) [5], in which EP values are considered piecewise constant, resulting in a simple and direct reconstruction formula. Therefore 4 MR-EPT maps were reconstructed (PBS, PB, CIBS, CIB).
RESULTS
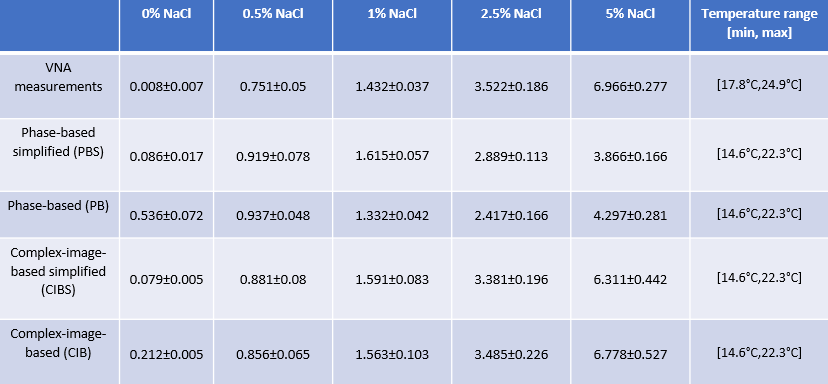
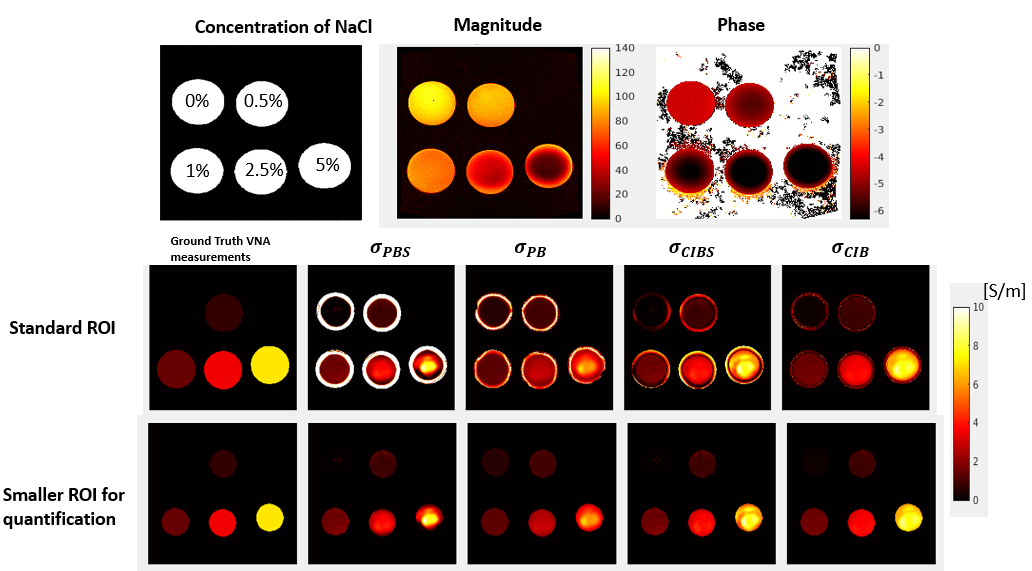
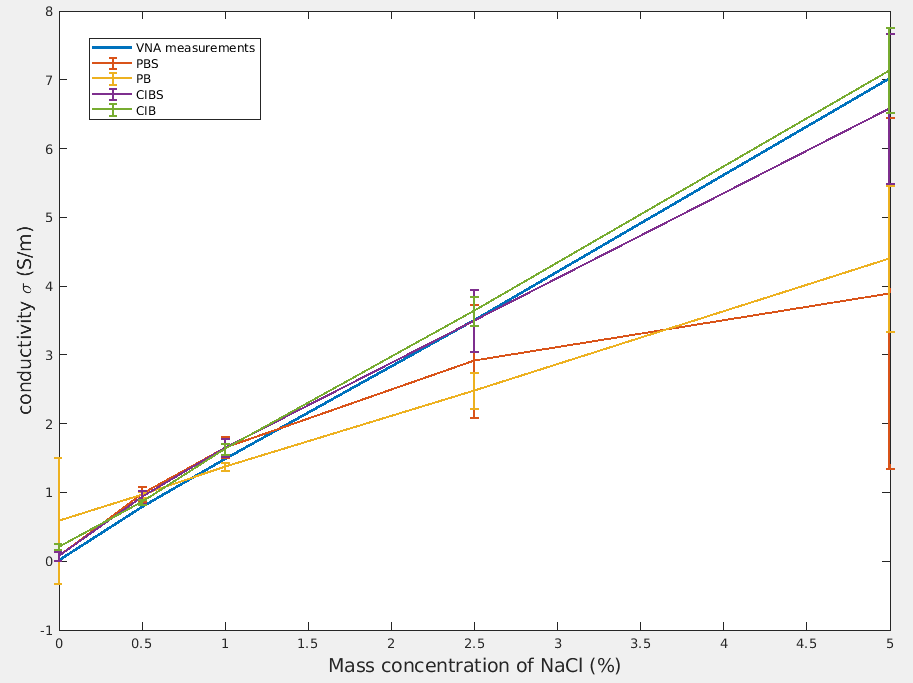
EP values obtained by MR-EPT and VNA are summarized in Figure 3. For all concentrations, except 0%, CIB provided the conductivity values closest to VNA measurements. However, at 0% NaCl, CIB exhibited overestimated values and CIBS was the closest. For all values, including VNA ones, the inter-session standard deviation was strongly dependent on the NaCl concentration and temperature. Examples of raw UTE images and reconstructed maps are shown in Figure 4. The raw maps are shown: the typical boundary artifacts can be seen for all reconstructions, especially for the simplified methods (PBS and CIBS). Masks used to calculate the values in Figure 3 are also displayed. The CIB method provided more uniform maps and the highest spatial resolution. Figure 5 shows the CIB values and the VNA values obtained at session 4 (22.2 °C), where the temperature was the most consistent between the MRI and VNA experiments.DISCUSSION AND CONCLUSION
Standard deviations of conductivity values in the VNA measurements can be explained mainly by temperature differences between different sessions. All MR-EPT methods provided conductivity maps that were reproducible over different sessions and strongly correlated with the VNA ground truth. However, all MR-EPT methods seemed to slightly overestimate low conductivities (< 1 S/m), and phase-based methods seemed to slightly underestimate high conductivities (> 1 S/m). MR-EPT maps all showed a boundary artifact, which was more pronounced in simplified methods. The proposed setup can be used to compare other MR-EPT reconstruction methods. In future work, we will design more complex phantoms of different sizes and with multiple compartments to mimic in-vivo conditions.Acknowledgements
Funding: French ANR project ELECTRA (ANR-21-CE19-0040).References
[1] P. Soullié, A. Missoffe, K. Ambarki, J. Felblinger, et F. Odille, « MR electrical properties imaging using a generalized image‐based method », Magn. Reson. Med., vol. 85, no 2, p. 762‑776, févr. 2021, doi: 10.1002/mrm.28458. (CIB method)
[2] J. S. Bobowski et T. Johnson, « PERMITTIVITY MEASUREMENTS OF BIOLOGICAL SAMPLES BY AN OPEN-ENDED COAXIAL LINE », Prog. Electromagn. Res. B, vol. 40, p. 159‑183, 2012, doi: 10.2528/PIERB12022906.
[3] N. Gurler et Y. Z. Ider, « Gradient-based electrical conductivity imaging using MR phase », Magn. Reson. Med., vol. 77, no 1, p. 137‑150, janv. 2017, doi: 10.1002/mrm.26097. (PB method)
[4] U. Katscher, T. Voigt, C. Findeklee, P. Vernickel, K. Nehrke, et O. Dössel, « Determination of electric conductivity and local SAR via B1 mapping », IEEE Trans. Med. Imaging, vol. 28, no 9, p. 1365‑1374, sept. 2009, doi: 10.1109/TMI.2009.2015757. (PBS method)
[5] S.-K. Lee, S. Bulumulla, F. Wiesinger, L. Sacolick, W. Sun, et I. Hancu, « Tissue Electrical Property Mapping from Zero Echo-Time Magnetic Resonance Imaging », IEEE Trans. Med. Imaging, vol. 34, no 2, p. 541‑550, févr. 2015, doi: 10.1109/TMI.2014.2361810. (CIBS method)
Figures