2908
Comparison of intra-voxel spatial distributions of diffusion coefficients with intra-voxel spatial distributions of kurtosis coefficients
Suguru Yokosawa1, Toru Shirai1, Yoshitaka Bito2, and Hisaaki Ochi1
1Innovative Technology Laboratory, FUJIFILM Healthcare Corporation, Tokyo, Japan, 2Radiation Diagnostic Systems Division, FUJIFILM Healthcare Corporation, Chiba, Japan
1Innovative Technology Laboratory, FUJIFILM Healthcare Corporation, Tokyo, Japan, 2Radiation Diagnostic Systems Division, FUJIFILM Healthcare Corporation, Chiba, Japan
Synopsis
Previously, we have proposed the method for characterizing the intra-voxel spatial distribution of apparent diffusion coefficients (ADC) by using texture analysis and showed that texture features can provide different information from the conventional diffusion tensor imaging. In this study, we extended our method to the apparent kurtosis coefficients (AKC). We compared the features of the intra-voxel spatial distribution of ADC with that of AKC. We found that there is no significant difference in the spatial distribution of AKC from that of ADC, and a short scanning time with a single b-value may be sufficient to obtain information on diffusion distribution.
Introduction
DWI (diffusion-weighted imaging) is a promising method for characterizing microstructural changes or differences in neuropathological features. Several approaches for apparent diffusion coefficient (ADC) modeling and the estimation of the probability density function (PDF) have been proposed to better understand tissue microstructures. Especially for PDF, the spherical harmonic-based analysis, which is mainly used to map the exact fiber orientation, is useful to improve the reliability of tractography1, 2. However, these techniques are not suited to extract information on non-fibrous microstructures from diffusion orientation distribution. Previously, we proposed the method for characterizing the intra-voxel spatial distribution of diffusion by using texture analysis with GLCM (gray level co-occurrence matrix) to extract non-fibrous tissue information from the diffusion orientation distribution. We applied the method on Gaussian diffusion model and found that texture features obtained from the spatial distribution of ADC can provide different information from the conventional DTI (diffusion tensor imaging)3. In this study, we extended our method to the diffusion kurtosis model. This time we compared the features of the intra-voxel spatial distribution of ADC with that of apparent kurtosis coefficients (AKC).Methods
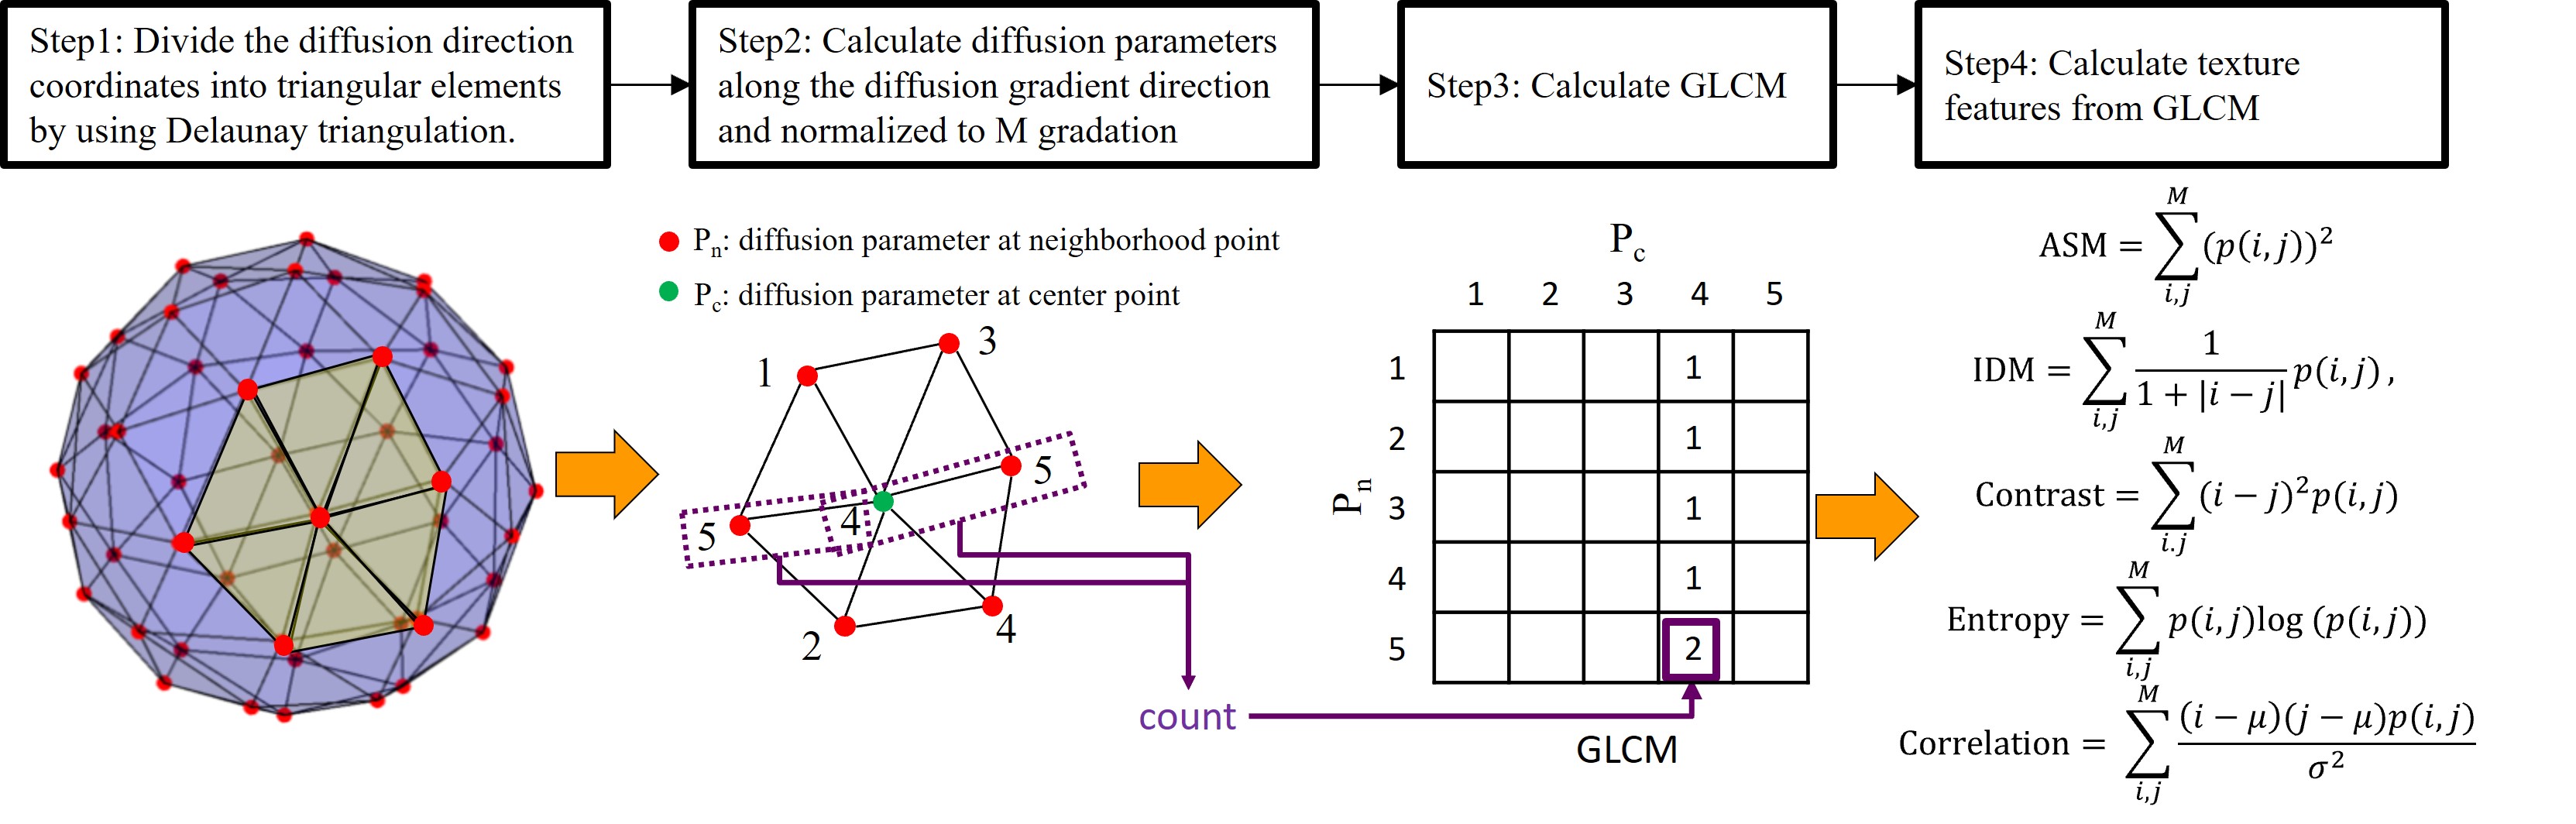
Figure 1 shows the diagrammatic illustration of characterizing the intra-voxel spatial distribution of diffusion parameters by using texture analysis. First, triangular elements are created using the Delaunay triangulation from the diffusion gradient directions used in the measurement. Next, the diffusion parameters along the diffusion gradient directions are calculated and normalized to M gradation. Then GLCM is created, and texture features are calculated for each voxel. In this study, we calculated the uniformity (ASM: angular second moment), a local difference (IDM: inverse difference moment), contrast (Contrast), randomness (Entropy), and local correlation (Correlation) as the texture features. As a measurement, two-dimensional spin-echo diffusion-weighted echo planner imaging was performed on a healthy volunteer brain using a 3 T MRI system. Images of 60 gradient directions and three b-values (0, 1000, and 2500 s/mm2) were obtained. Other parameters were as follows: TR/TE, 4000/86.7 ms; FOV, 240 mm; matrix, 128×96; thickness/interval, 4/5 mm; a number of slices, 20. Figure 2 shows the data processing flow. ADCs along the diffusion gradient directions, mean diffusivity (MD) image and fractional anisotropy (FA) image were calculated using two b-values (0 and 1000 s/mm2). AKC along the diffusion gradient directions and mean kurtosis (MK) image were calculated using three b-values (0, 1000, and 2500 s/mm2). The regions were segmented into white matter (WM), gray matter (GM), and cerebral spinal fluid (CSF), and the texture feature images of ADC and AKC were calculated in each region, respectively. The segmentation was performed according to the following rules: CSF is a region with MD ≥ 1.2×10⁻³ mm2/s, WM is a region with MD < 1.2×10⁻³ mm2/s and FA ≥ 0.2, GM is a region with MD < 1.2×10⁻³ mm2/s and FA < 0.2. This study was approved by the ethics committee of FUJIFILM Healthcare Corporation. Data from volunteers were obtained following the receipt of written informed consent.Results
Figure 3 shows the MD, FA, and MK images and texture feature images (ASM, IDM, Contrast, Entropy, and Correlation) of ADC and AKC. Focusing on the regions of high FA in white matter, Contrast accentuates the regions of high anisotropy. On the other hand, IDM and Entropy show high signals even in the low FA regions including gray matter. In addition, IDM and Entropy show different contrast from MD, FA, and MK. The texture features images calculated from ADC and AKC are very similar. Figure 4 shows scatter plots between texture features of ADC and that of AKC. Table 1 shows the correlation coefficient between texture features of ADC and that of AKC. There was a high correlation between the intra-voxel spatial distribution of the ADC and that of AKC in all regions of WM, GM and CSF.Discussion
The texture features calculated from the spatial distribution of the diffusion parameters have a different contrast from the conventional diffusion indices MD, FA, and MK. The results suggest that texture features have different information about the spatial distribution from MD, FA, and MK. On the other hand, there was a high correlation between the texture features calculated from the spatial distribution of ADC and those calculated from the spatial distribution of AKC. This suggests that there is no significant difference in the information on the spatial distribution of AKC from that of ADC. In other words, the multi b-value measurement for non-Gaussian analysis may not be necessary to obtain the information of spatial distribution. As a limitation, the present study was conducted on healthy subjects. Previous studies have suggested that MK is a promising indicator for the early diagnosis of neurodegenerative diseases and the differentiation of high-grade and low-grade gliomas4,5, and further studies in disease cases are needed.Conclusion
We have investigated the relationship between diffusion modeling and orientation distribution of diffusion parameters by comparing the features of the intra-voxel spatial distribution of ADC and that of AKC. It was shown that there is no significant difference in the information on the spatial distribution of AKC from that of ADC, and a short scanning time with a single b-value may be sufficient to obtain information on diffusion distribution.Acknowledgements
No acknowledgement found.References
- Tournier JD, Calamante F, Gadian DG, et al. Direct estimation of the fiber orientation density function from diffusion-weighted MRI data using spherical deconvolution, NeuroImage 2004;23(3):1176–1185.
- Descoteaux M, Angelino E, Fitzgibbons S, et al. Regularized, Fast, and Robust Analytical Q-Ball Imaging, Magn Reson Med. 2007;58(3):497-510.
- Yokosawa S, Toru S, Bito Y, et al. Characterizing intravoxel spatial distribution of diffusion based on texture analysis, proceedings of ISMRM 2020, 4378.
- Arab A, Wojna-Pelczar A, Khairnar A, Szabó N, Ruda-Kucerova J. Principles of diffusion kurtosis imaging and its role in early diagnosis of neurodegenerative disorders, Brain Res Bull. 2018;139:91-98.
- Abdalla G, Dixon L, Sanverdi E, et al. The diagnostic role of diffusional kurtosis imaging in glioma grading and differentiation of gliomas from other intra-axial brain tumours: a systematic review with critical appraisal and meta-analysis, Neuroradiology. 2020;62:791–802.
Figures
Figure
1 Diagrammatic illustration of characterizing intra-voxel
spatial distribution of diffusion parameters by using texture analysis. Where, i and j are GLCM coordinates, M is a GLCM size, μ is an average value
of i and j, and σ is a standard deviation of i and j.
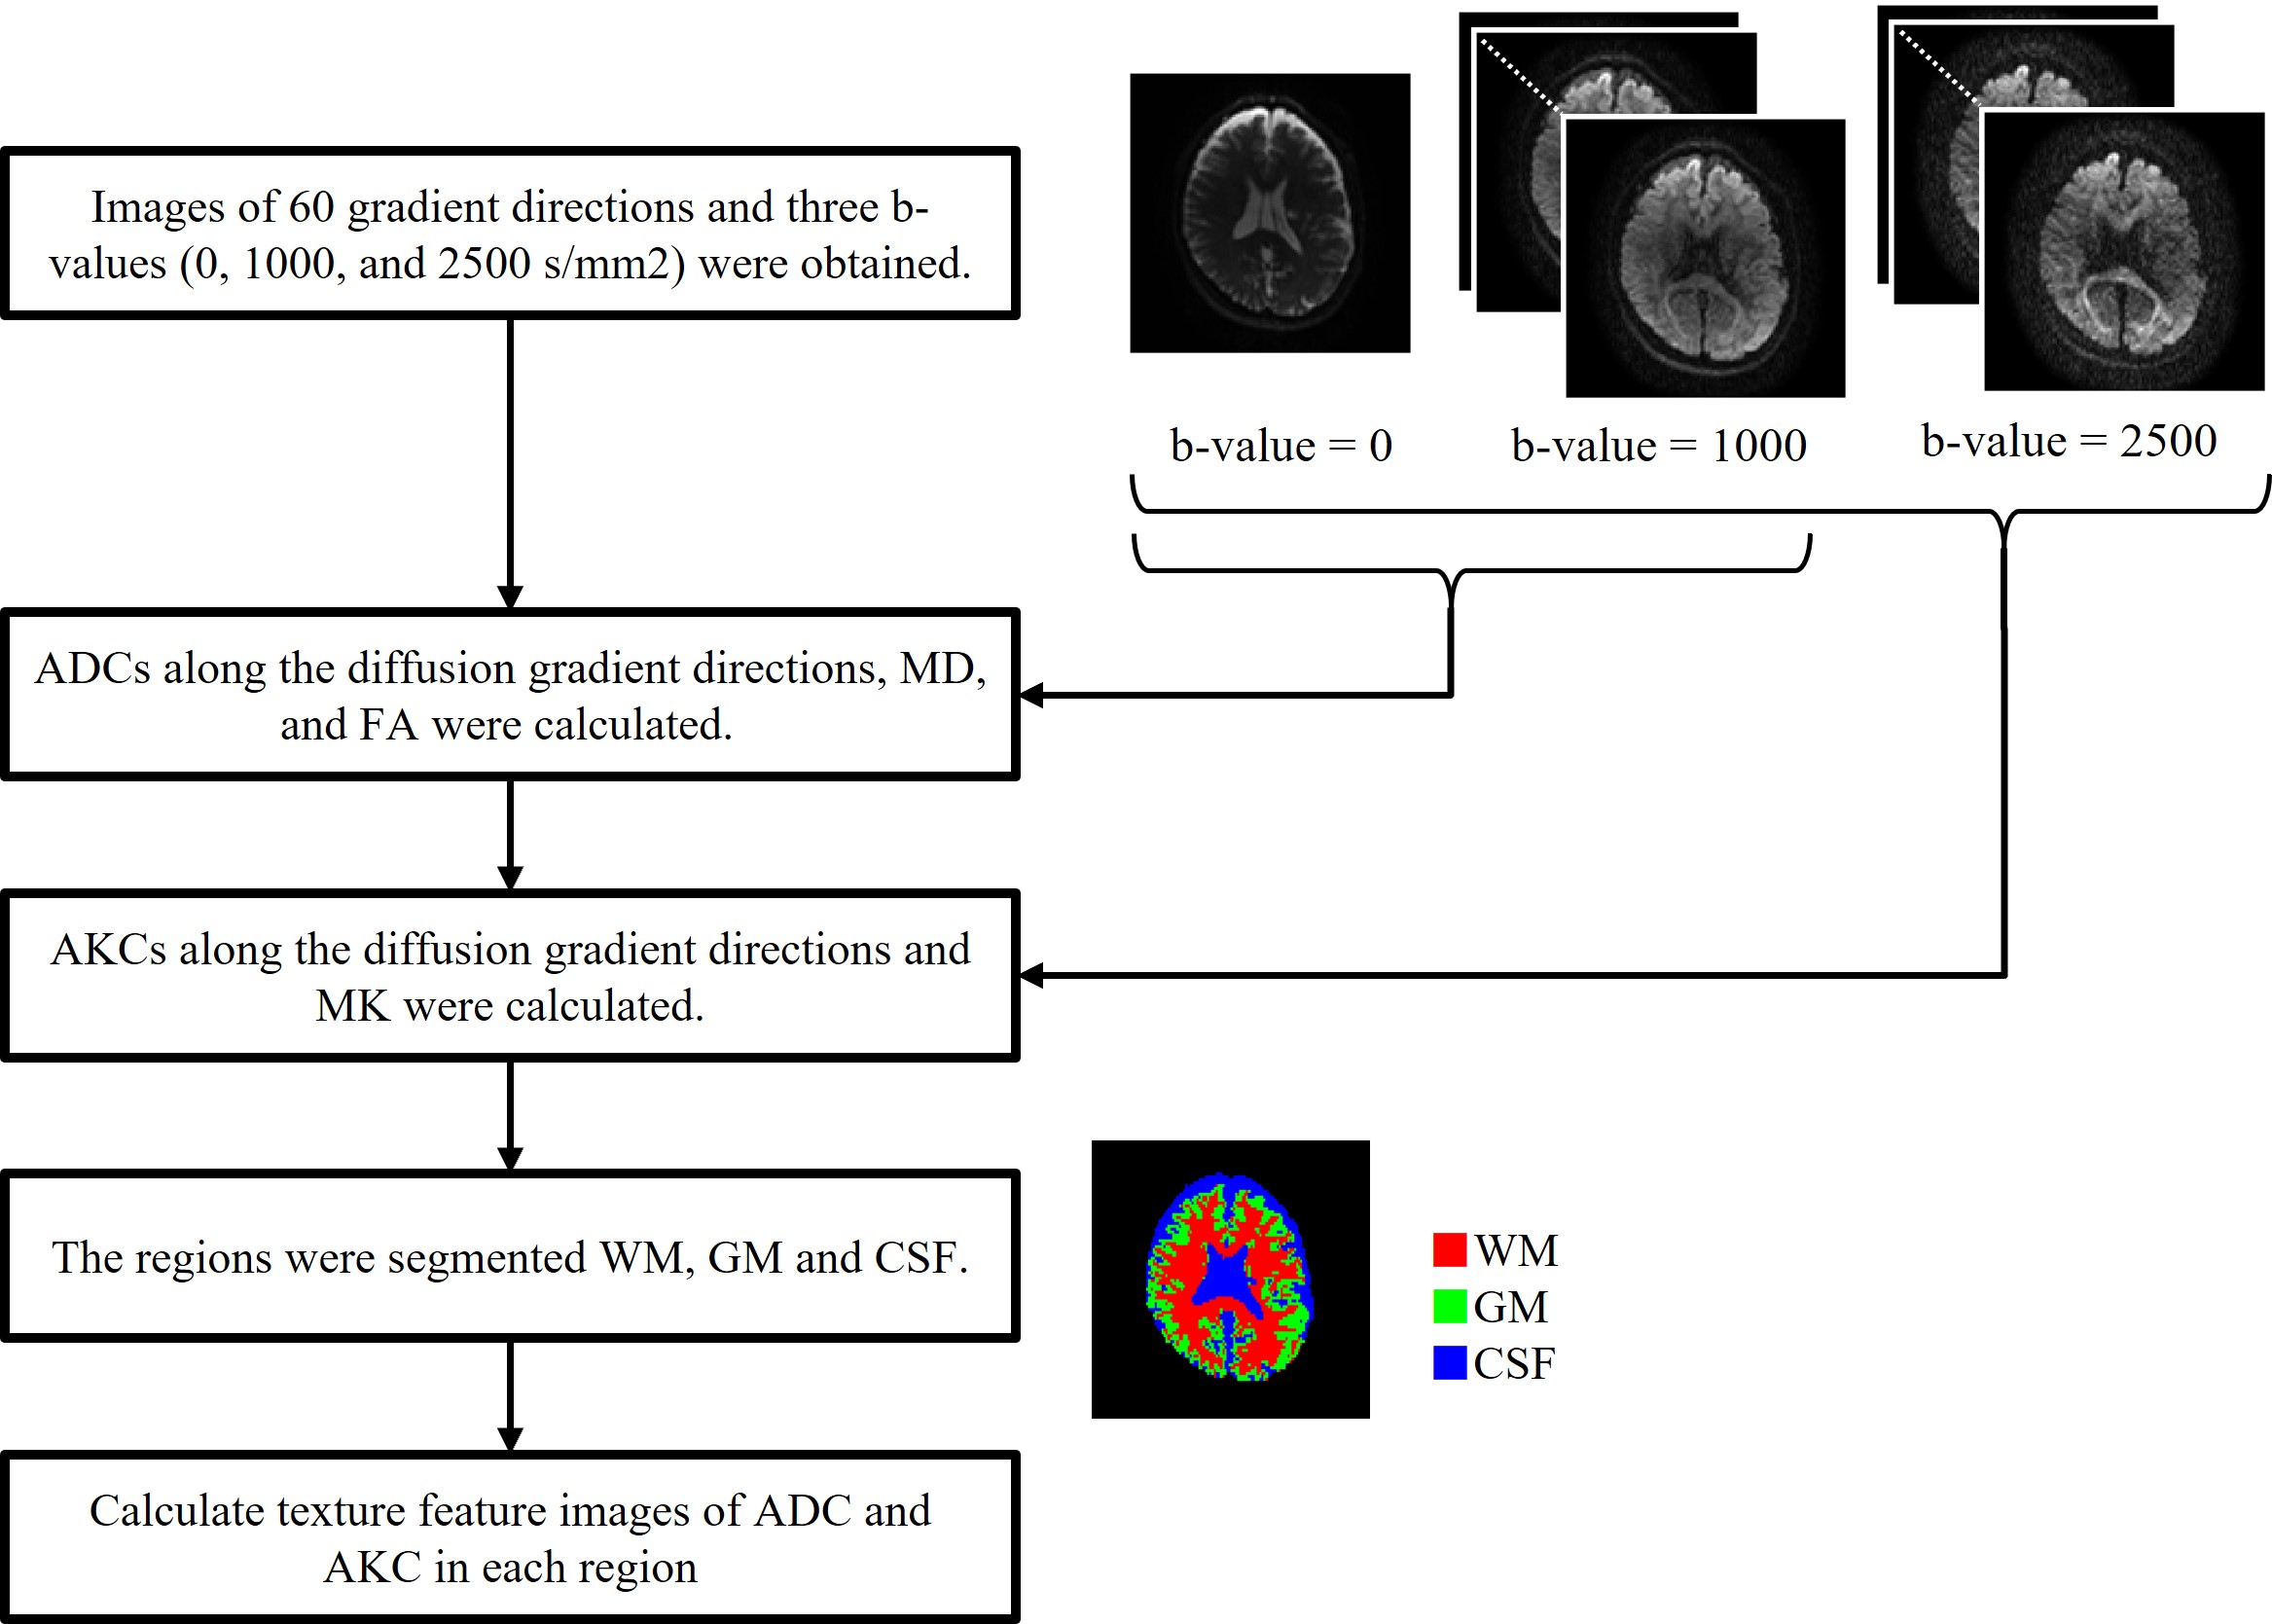
Figure
2 Data processing flow.
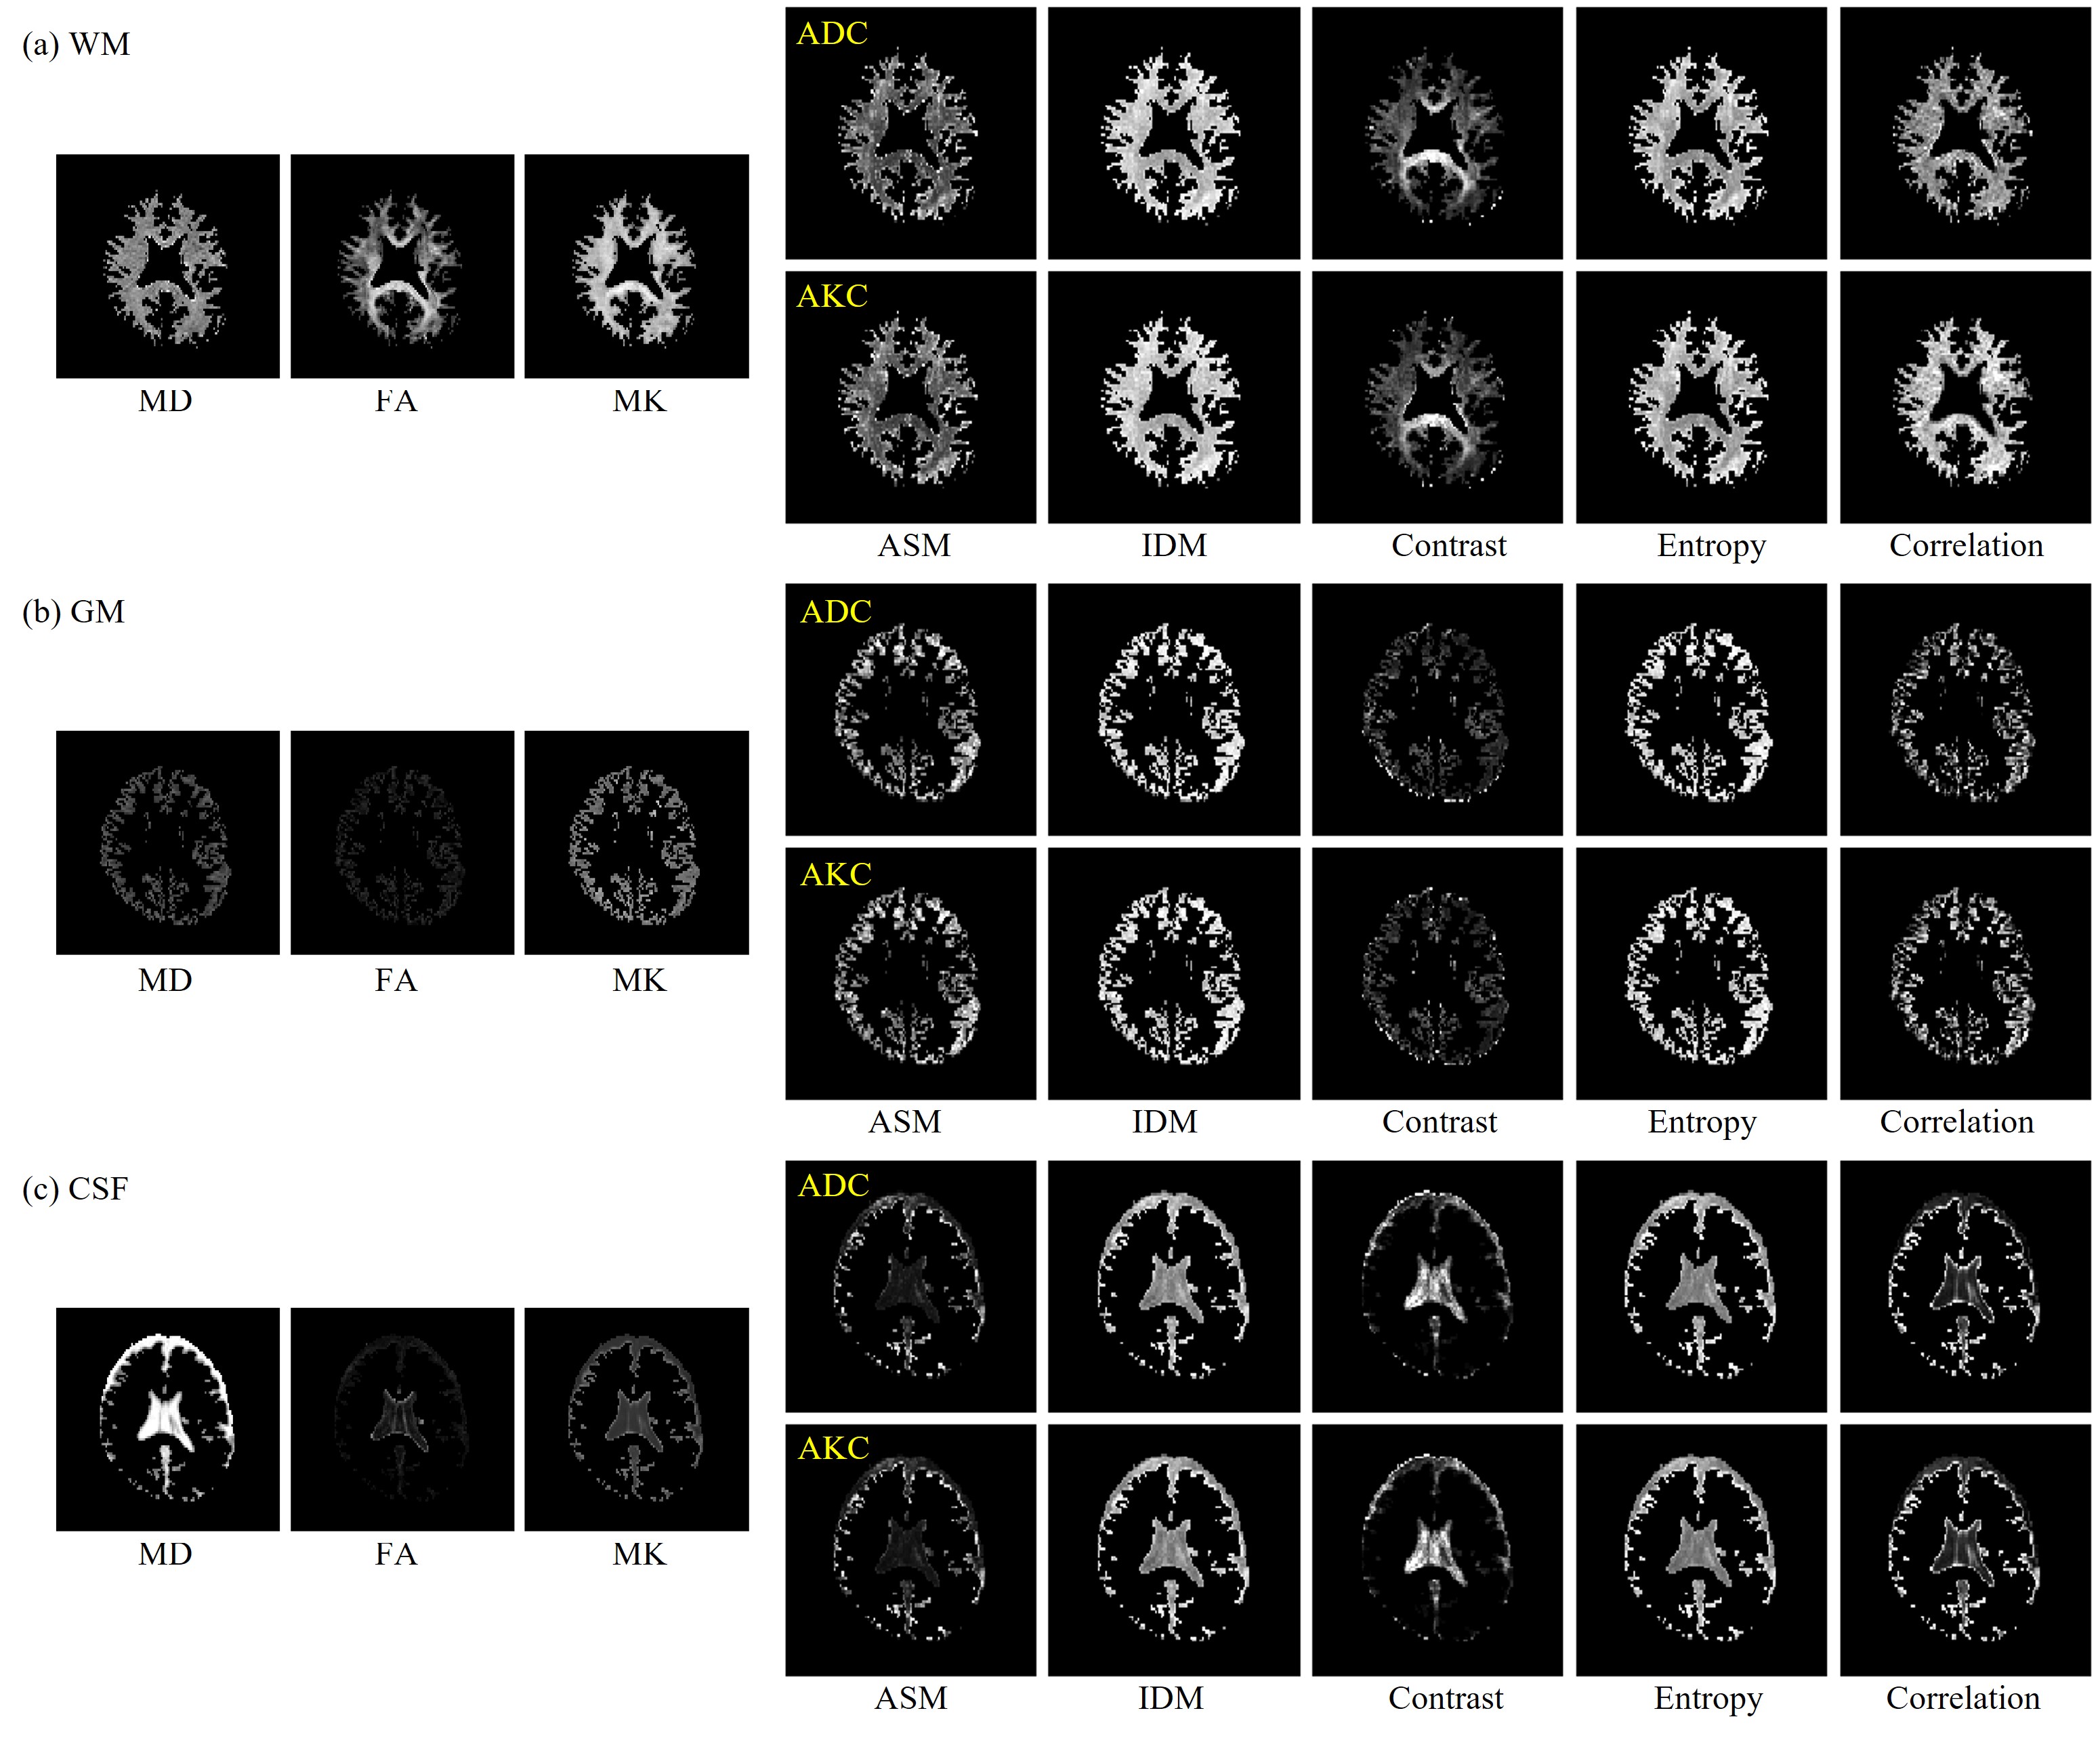
Figure 3 MD, FA, MK, ASM, IDM, Contrast, Entropy, and Correlation
images in (a) WM, (b) GM, and (c) CSF.
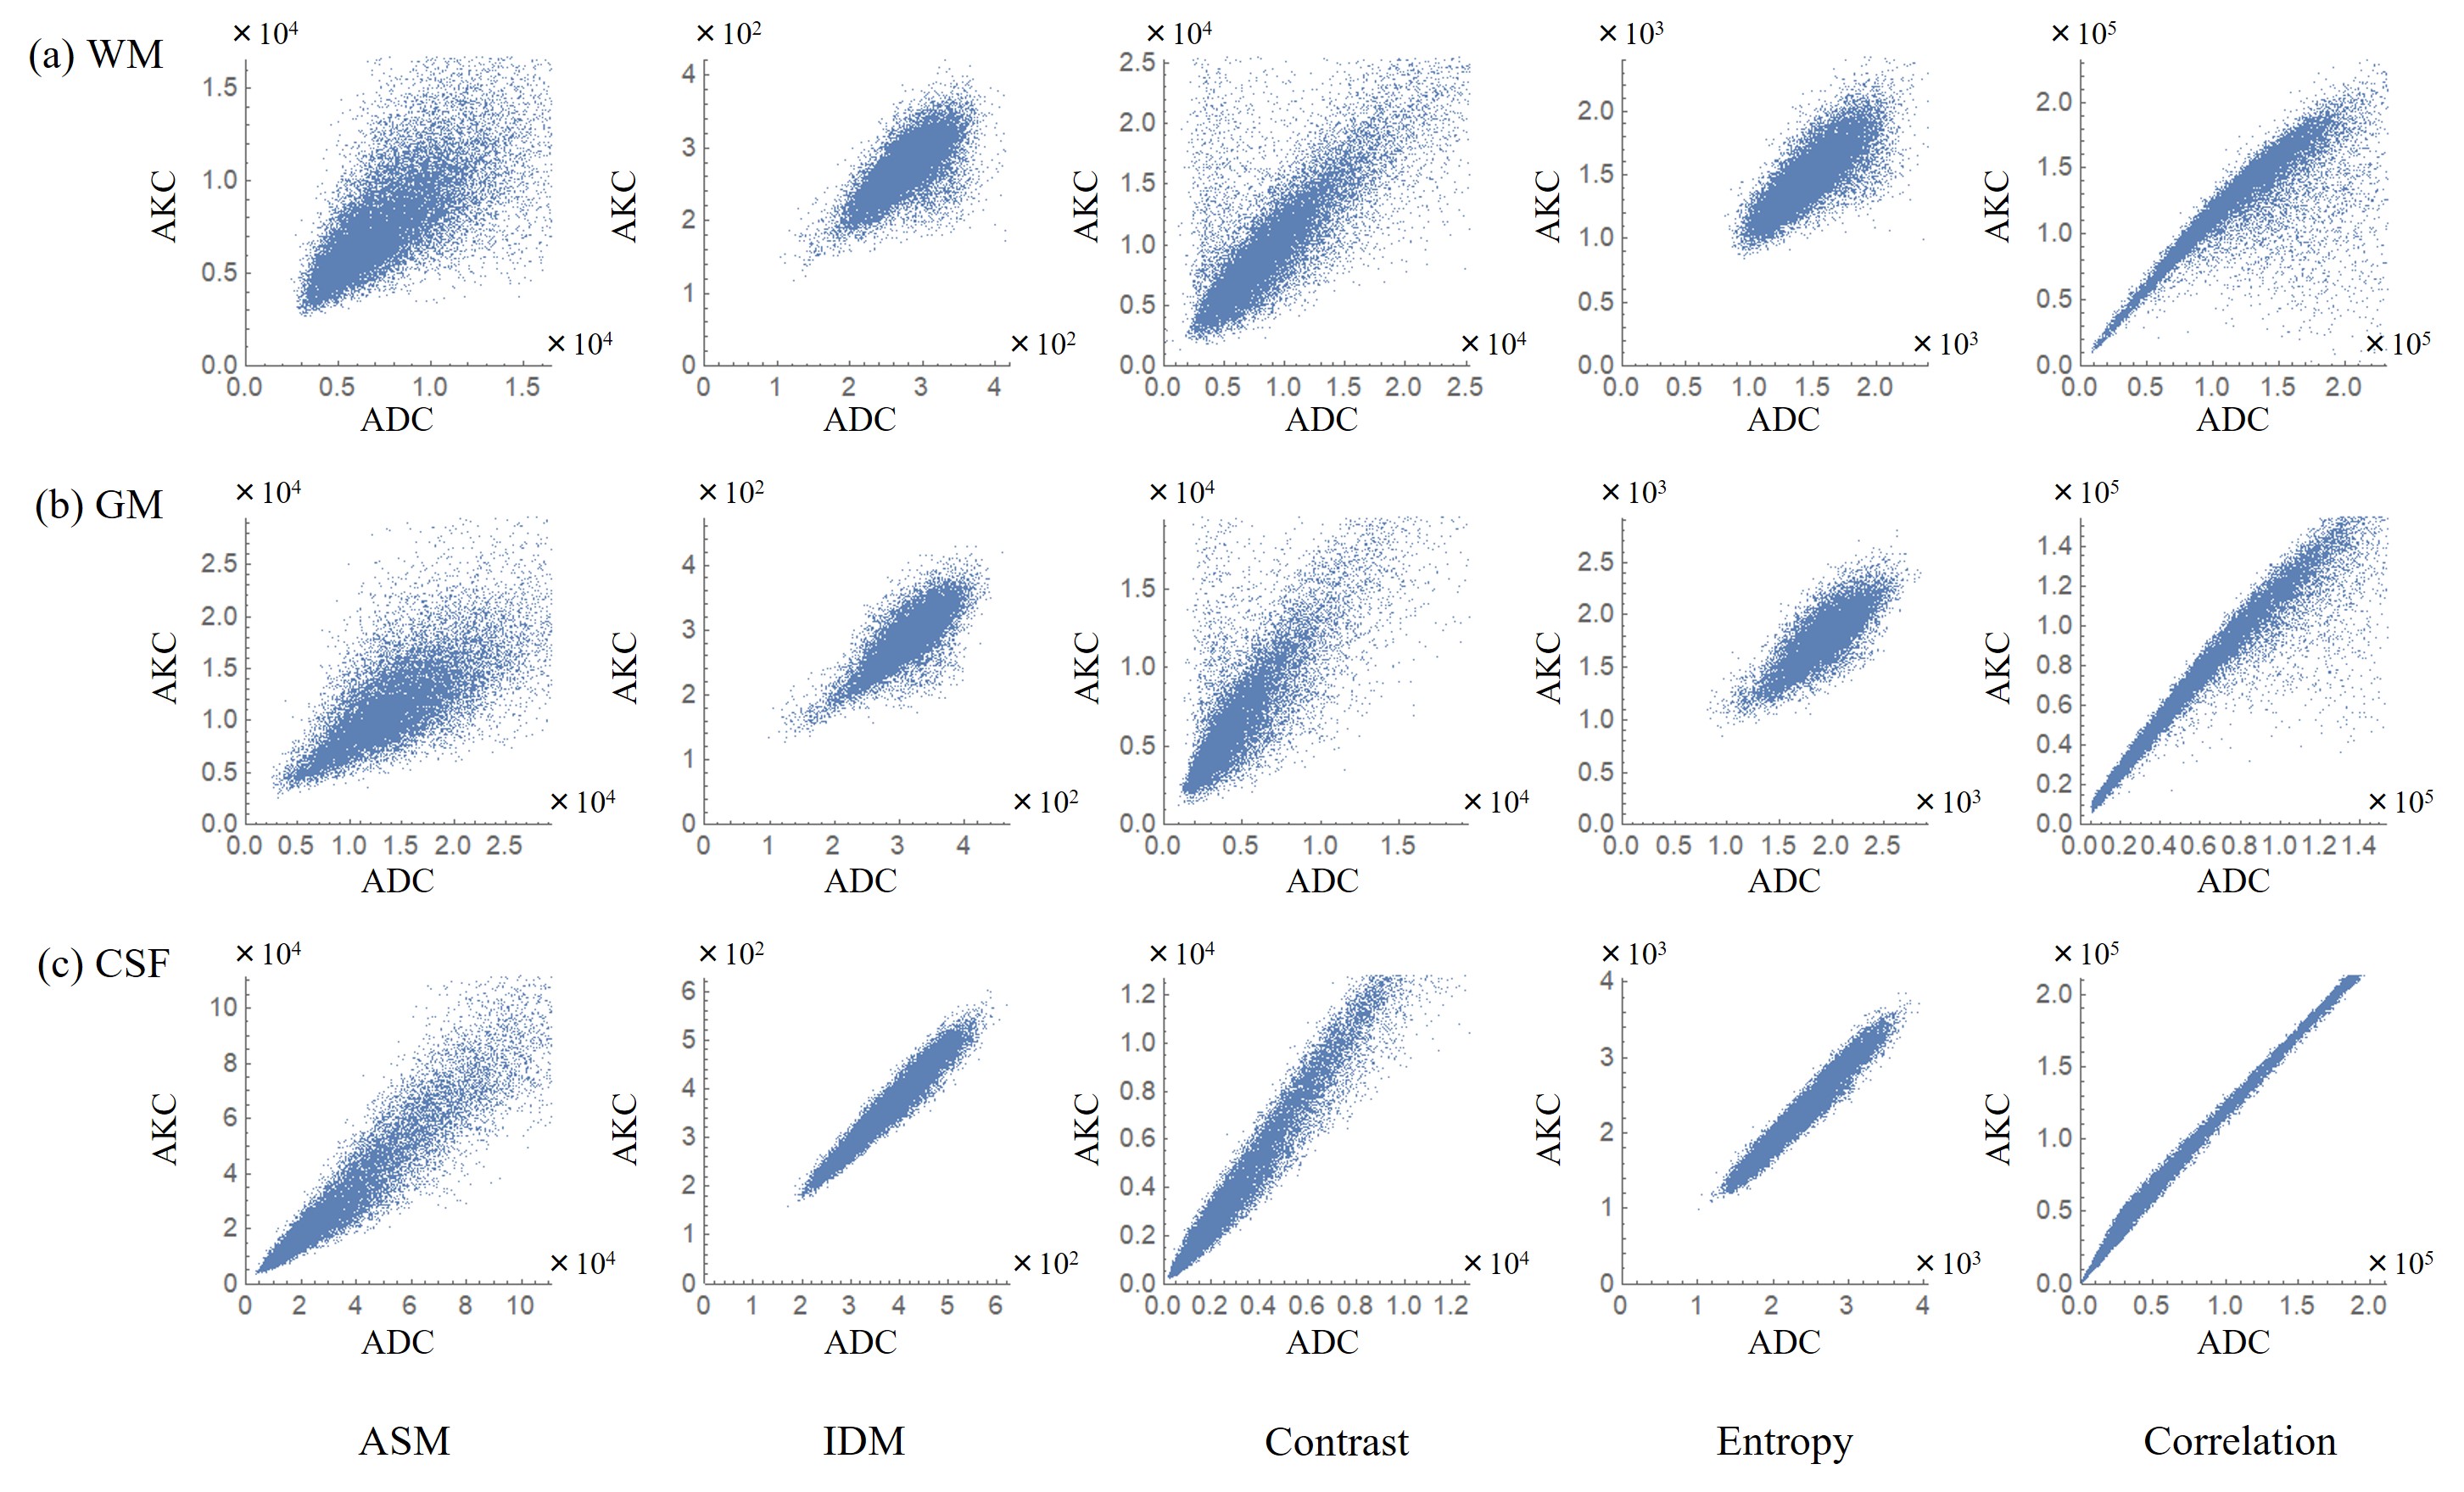
Figure 4
Scatter plots between texture features of ADC and that of
AKC in (a) WM, (b) GM, and (c) CSF.
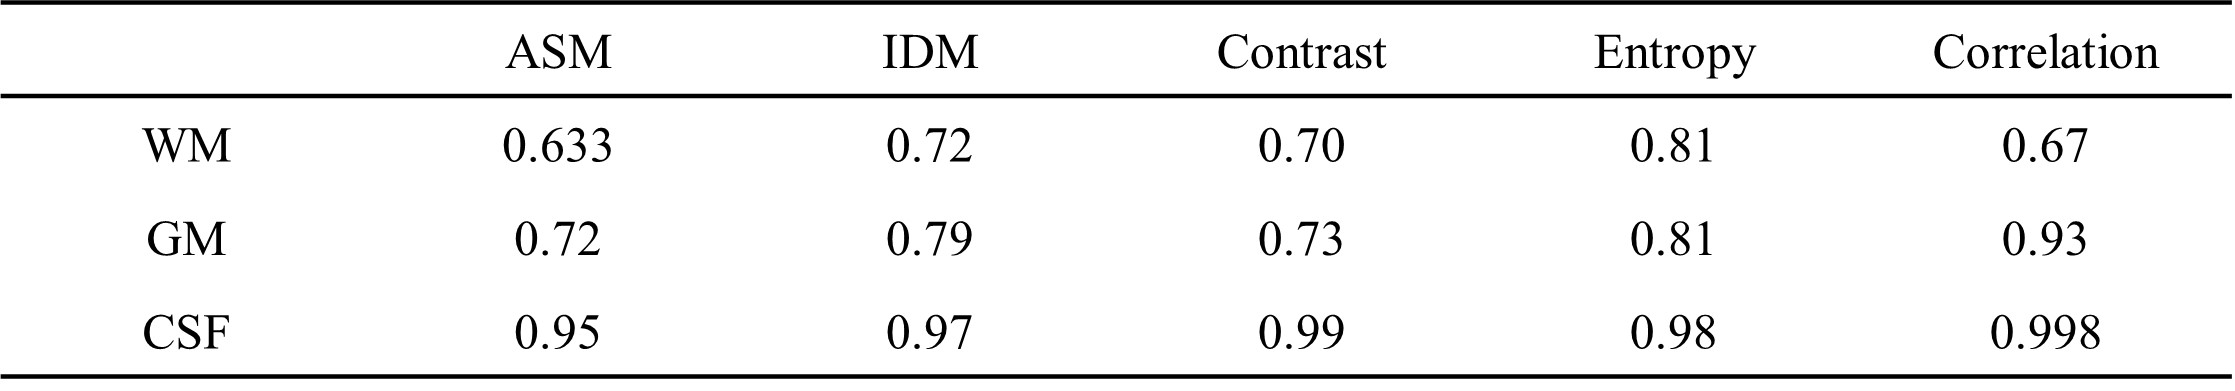
Table 1 Correlation coefficient between texture
features of ADC and that of AKC in WM, GM, and CSF.
DOI: https://doi.org/10.58530/2022/2908