2907
Evaluating Reproducibility and Repeatability of Penalty Function Based Methods for Quantitative Intravoxel Incoherent Motion Analysis1Indian Institute of Technology Delhi, Delhi, India, 2All India Institute of Medical Sciences Delhi, Delhi, India
Synopsis
Reproducibility and repeatability of penalty-based IVIM analysis methodologies BE+TV and BE+HPF have been evaluated using clinical dataset with osteosarcoma in comparison with existing IVIM analysis methods. IVIM datasets at three time-points during chemotherapy were analyzed and healthy muscle tissue was used as local control for IVIM analysis and evaluation of scan-rescan repeatability and reproducibility. Results showed, parametric maps estimated by BE+TV and BE+HPF methods were observed to have higher reproducibility and lower spatial inhomogeneity than the existing IVIM analysis methods and produced satisfactory inter-scan agreement in parameters estimation proving its repeatability in clinical scenario.
Introduction
Penalty-based intravoxel incoherent motion (IVIM) analysis methodologies bi-exponential model with adaptive Total Variation (TV) penalty function (BE+TV) and bi-exponential model with adaptive Huber penalty (HPF) function (BE+HPF) have shown promising results for quantitative IVIM analysis using simulation datasets and empirical clinical datasets of bone tumors and prostate cancer1-3. For clinical applications especially in oncology, use of these analysis methods needs evaluation for their reproducibility and repeatability. In this study, reproducibility and repeatability of BE+TV and BE+HPF methodologies have been evaluated in comparison with existing IVIM analysis methods using clinical dataset with osteosarcoma.Materials and Methods
Dataset: IVIM MRI datasets of ten patients (N=10, Age=16.4±2.3 years, M:F=8:2) with osteosarcoma were analyzed. All patients underwent 3 cycles of neoadjuvant chemotherapy NACT consisting of Cisplatin and Doxorubicin at every 3 weeks4. IVIM datasets were acquired at three time-points: 1) Baseline(t0); 2) after first cycle of chemotherapy(1st follow-up(t1)); and 3) after 3rd cycle of chemotherapy(2nd follow-up(t2)). Adjacent healthy muscle tissue was expected to remain unaffected during chemotherapy treatment and therefore, was used as internal control to evaluate the reproducibility and repeatability of the BE+TV and BE+HPF methodologies. The same region of interest(ROI) in health muscle tissue was selected at three time-points for analysis (Figure1.ii,v,viii). MRI was acquired using a 1.5 T Philips Achieva® scanner. IVIM MRI was acquired using free breathing Spin Echo-Echo Planar imaging at 11 b-values (0,10,20,30,40,50,80,100,200,400,800 s/mm2), with TR/TE=7541/67 msec, matrix-size=192×192 and slice thickness/Gap=5 mm/0.5 mm, field-of-view=250×250 mm2.Quantitative IVIM analysis: Quantitative IVIM parameters Diffusion coefficient (D), Perfusion coefficient (D*) and Perfusion fraction (f) were estimated at time-points t0, t1 and t2 using BE+TV and BE+HPF methodologies along with the exiting IVIM analysis methods5 a) Bi-exponential (BE) model, b) Segmented BE method with two-parameter fitting (BEseg-2), c) Segmented BE method with one-parameter fitting (BEseg-1). Apparent diffusion coefficient was estimated at three time-points for completion. For each individual patient same ROI for healthy muscle tissue volume was used across the three time-points for evaluation of parameters.
Statistical analysis: Reproducibility of BE+TV and BE+HPF methodologies was evaluated using Within-subject coefficient of variation (wCV) and between-subject coefficient of variation (bCV) as reported by 6-8 in comparison with existing IVIM analysis methods a) BE, b) BEseg-2, c) BEseg-1. wCV for each IVIM parameter was estimated as the as the ratio of standard deviation to the mean of the parameter and bCV for each parameter was estimated as the ratio of the mean of standard deviation to the mean of parameter across all subjects. wCV and bCV values for five analysis methods in healthy tissue volume was compared using paired t-test at each time-point separately. For assessing scan-rescan repeatability, inter-scan comparison of wCV values by BE+TV and BE+HPF was performed in same patient across the time-points (t0 versus t1; t1 versus t2; and t0 versus t2) using paired t-test as reported by 8. Inter-scan comparison of absolute mean of the IVIM parameters (D, D*, f) in healthy tissue volume was performed using paired t-test and Bland-Altman limits of agreement as reported by 9,10. A p-value<0.05 was considered as statistically significant.
Results
Table1 present the average wCV and bCV values in healthy tissue volume for five IVIM analysis methodologies at time-points t0,t1,t2. BE+TV and BE+HPF showed significantly (p<0.05) lower wCV in estimating D(22-26%) than BE(37-43%); however, were comparable to BEseg-2 and BEseg-1 methods (21-25%) across the time-points. BE+TV and BE+HPF consistently showed significantly (p<0.05) lower wCV in estimating D*(92-96%) and f(51-56%) than BE, BEseg-2 and BEseg-1 methods(D*-wCV:93–108% and f-wCV:94–130%) across the time-points. Comparing bCV among methods, BE+TV and BE+HPF both demonstrated overall lower variation in estimating IVIM parameters than the other methods.Table2 shows the average ADC and IVIM parameter values evaluated by five analysis methods at three time-points in healthy tissue volume. The parameter values and estimated wCV values in healthy tissue were not statistically different (p>0.05) across the time-points during treatment.
Figure1.A,B,C shows the IVIM parametric maps evaluated by analysis methods for a representative patient across time-points. Qualitatively the changes in the parameter values in tumor across the time-points can be observed; however, in healthy tissue the parameters were similar. BE+TV and BE+HPF both showed low spurious noise and improved interpretability of parametric maps across all time-points; whereas, D* and f, estimated using BE, BEseg-2 and BEseg-1 methods, showed comparatively higher variability and noise.
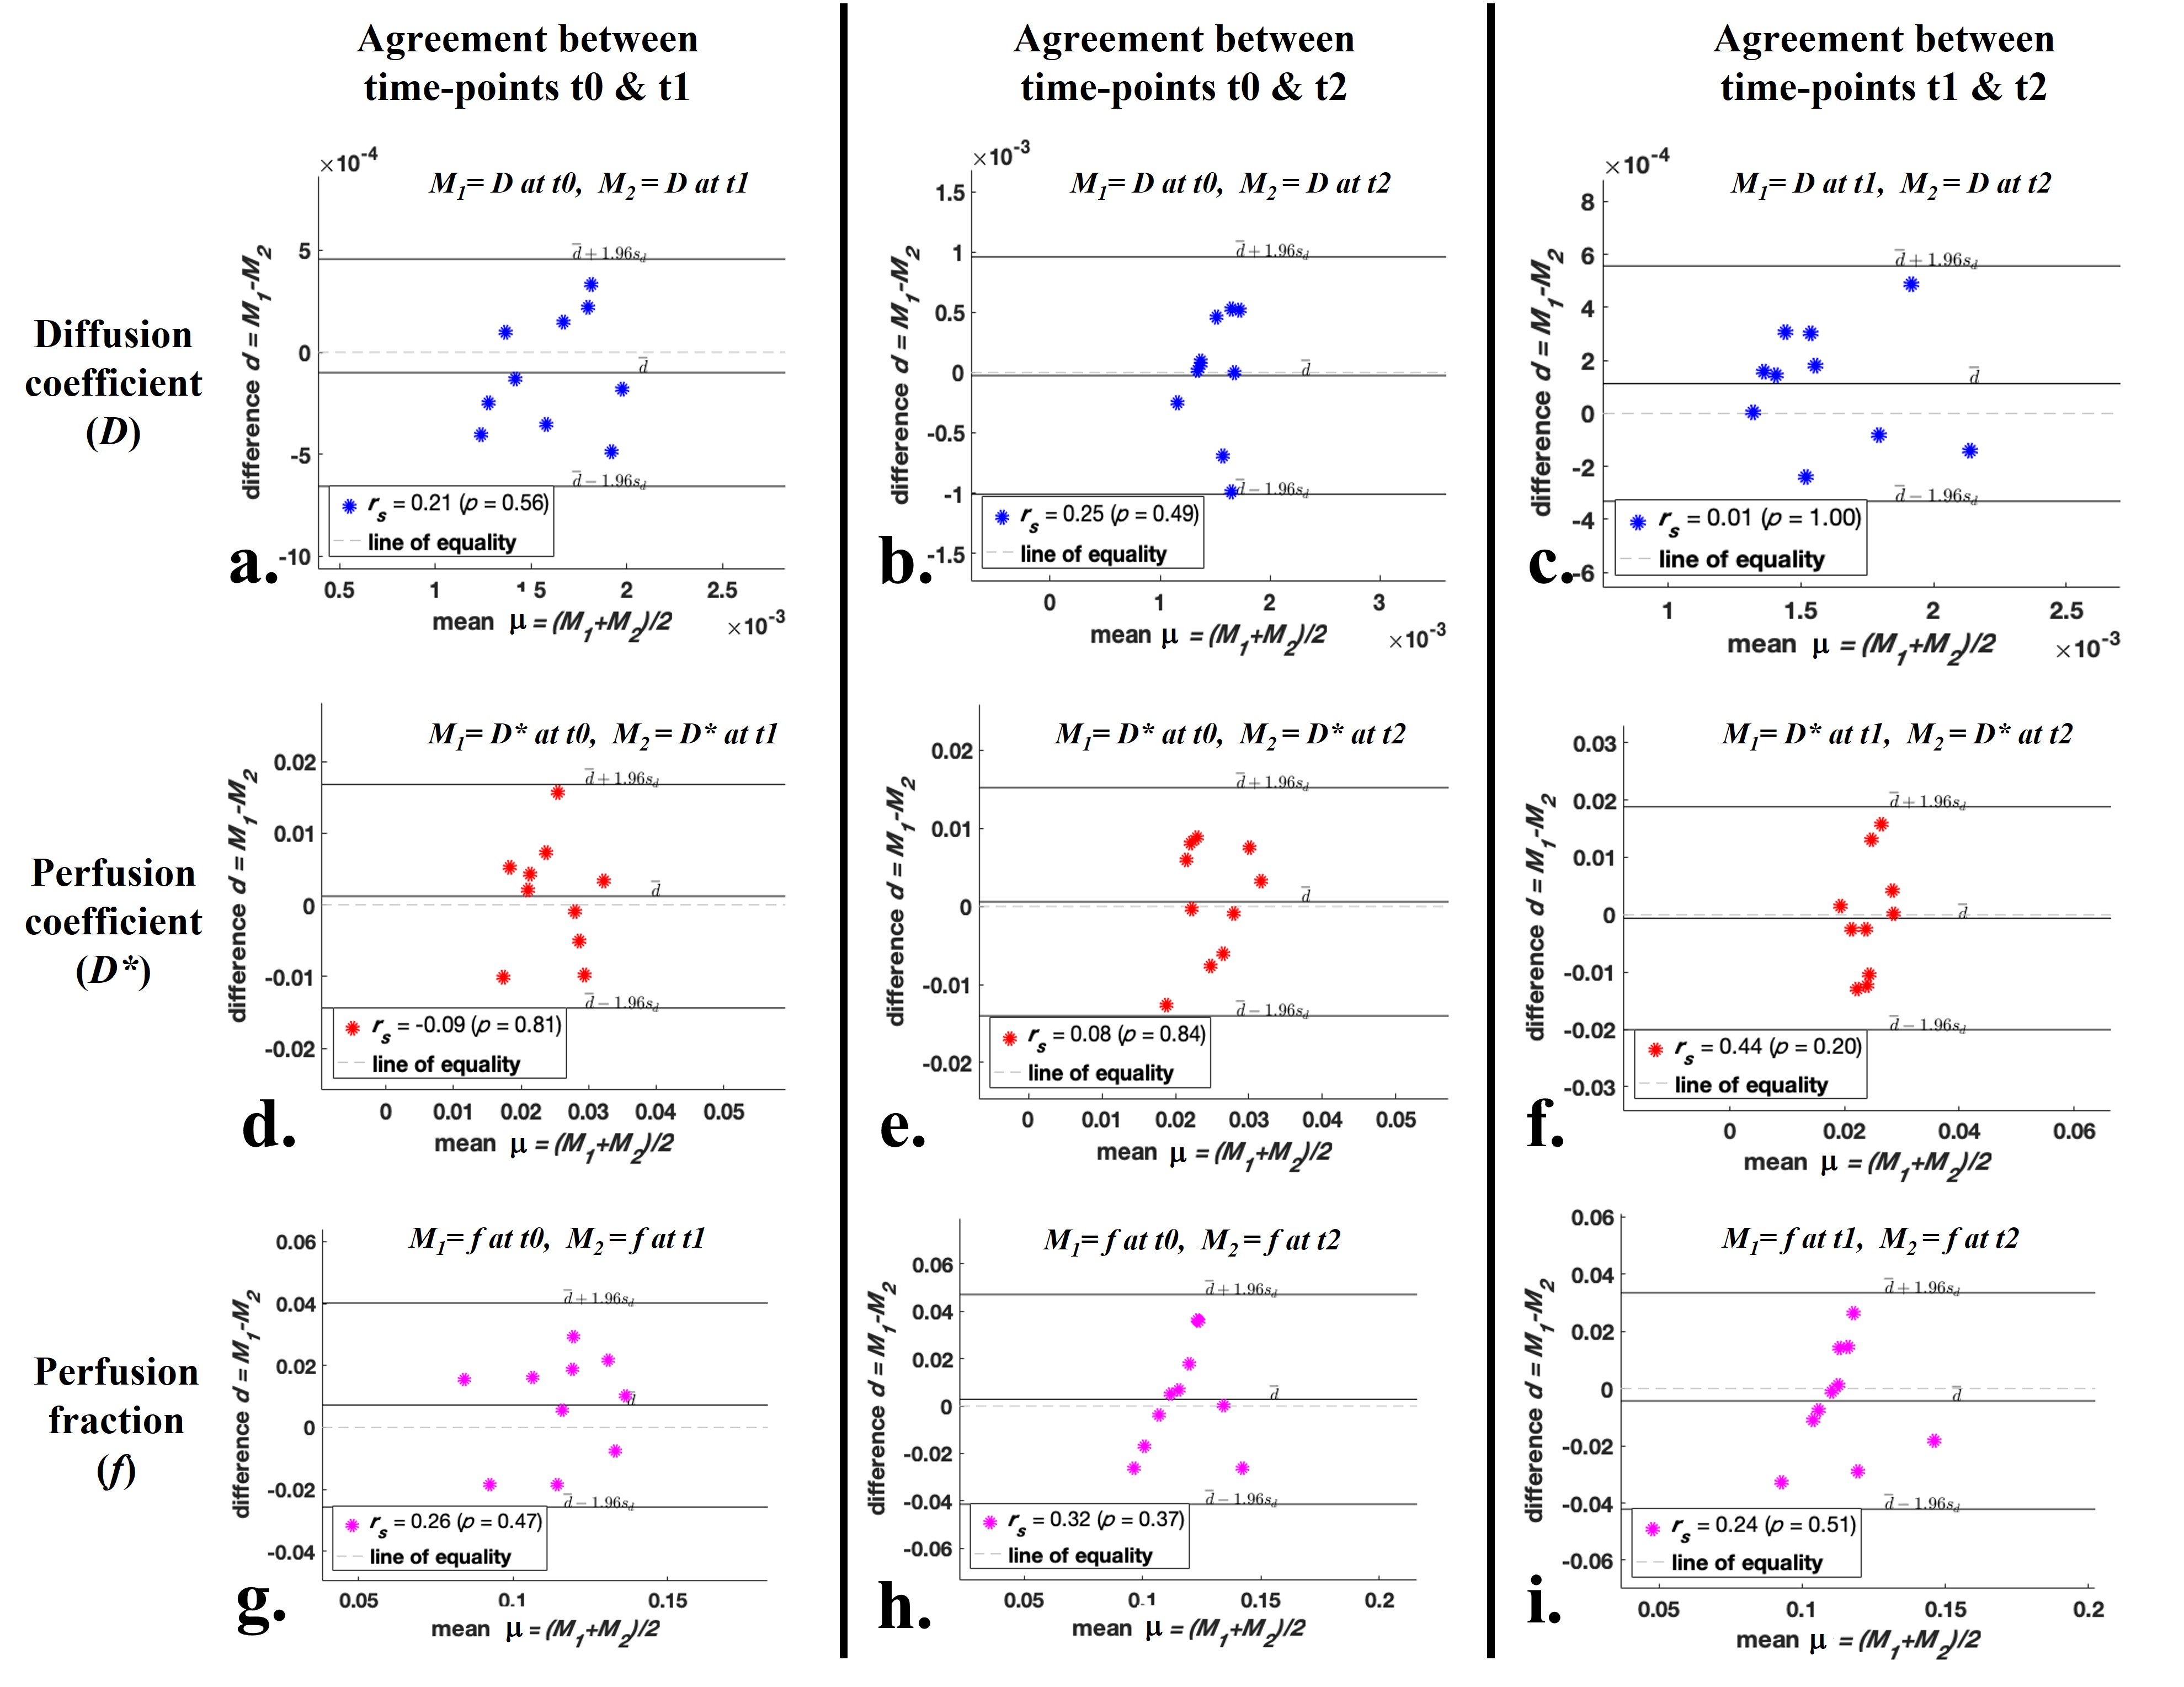
Figure2 and Figure3 demonstrate Bland-Altman plots showing inter-scan agreement of parameters D, D* and f estimated by BE+TV and BE+HPF methods respectively. Both the methods have demonstrated comparable agreement in estimating IVIM parameters across the time-points.
Discussion
Estimated wCV and bCV for BE+TV/BE+HPF methods were comparable with the previous studies 6,7,10 and lower than the existing IVIM analysis methods. Because of the adaptive nature of penalty functions TV/HPF, the parametric images evaluated by the BE+TV and BE+HPF methods are comparatively less noisy and observed to have higher reproducibility than the existing IVIM analysis methods. The results are evaluated on limited number of clinical datasets; however, experiment on larger dataset is desirable.Conclusion
Penalty-based IVIM analysis methods BE+TV and BE+HPF demonstrated lower variability and satisfactory inter-scan agreement in parameters estimation proving its reproducibility and repeatability in clinical scenario.Acknowledgements
No acknowledgement found.References
1. Baidya Kayal E., Kandasamy D., Khare K., Alampally J.T., Bakhshi S., Sharma R., Mehndiratta, A. Quantitative Analysis of Intravoxel Incoherent Motion (IVIM) Diffusion MRI using Total Variation and Huber Penalty Function. Med Phys. 2017 Nov;44(11):5849-5858. doi: 10.1002/mp.12520.
2. Baidya Kayal E., Kandasamy D., Khare K., Bakhshi S., Sharma R., Mehndiratta, A. Intravoxel Incoherent Motion (IVIM) for Response Assessment in Patients with Osteosarcoma undergoing Neoadjuvant Chemotherapy. European Journal of Radiology. 2019,10;119:108635. doi: 10.1016/j.ejrad.2019.08.004.
3. Malagi AV, Das CJ, Khare K, Calamante F, Mehndiratta A. Effect of combination and number of b values in IVIM analysis with post-processing methodology: simulation and clinical study. Magn Reson Mater Physics, Biol Med. 2019;32(5):519-527. doi:10.1007/s10334-019-00764-0.
4. The ESMO / European Sarcoma Network Working Group, Bone sarcomas : ESMO clinical practice guidelines for diagnosis, treatment and follow-up, Ann. Oncol. 23 (2012), https://doi.org/10.1093/annonc/mds254 vii100–vii109.
5. Merisaari H, Movahedi P, Perez IM, et al. Fitting methods for intravoxel incoherent motion imaging of prostate cancer on region of interest level: repeatability and gleason score prediction. Magn Reson Med. 2017;77:1249–1264.
6. Doudou NR, Liu Y, Kampo S, Zhang K, Dai Y, Wang S. Optimization of intravoxel incoherent motion (IVIM): variability of parameters measurements using a reduced distribution of b values for breast tumors analysis. Magn Reson Mater Physics, Biol Med [Internet]. 2019;33(2):273–81. Available from: https://doi.org/10.1007/s10334- 019-00779-7
7. Taimouri V, Afacan O, Perez-rossello JM, Callahan MJ, Mulkern R V, Warfield SK, et al. Spatially constrained incoherent motion method improves diffusion-weighted MRI signal decay analysis in the liver and spleen. Med Phys [Internet]. 2015;42(4):1895–903. Available from: http://dx.doi.org/10.1118/1.4915495
8. Koopman T, Martens R, Gurney-Champion OJ, Yaqub M, Lavini C, de Graaf P, Castelijns J, Boellaard R, Marcus JT. Repeatability of IVIM biomarkers from diffusion-weighted MRI in head and neck: Bayesian probability versus neural network. Magn Reson Med. 2021 Jun;85(6):3394-3402. doi: 10.1002/mrm.28671. Epub 2021 Jan 26. PMID: 33501657; PMCID: PMC7986193.
9. Cui Y, Dyvorne H, Besa C, Cooper N, Taouli B. IVIM Diffusion-weighted Imaging of the Liver at 3.0T: Comparison with 1.5T. Eur J Radiol Open. 2015;2:123-128. doi:10.1016/j.ejro.2015.08.001
10. Cieszanowski A, Pasicz K, Podgórska J, et al. Reproducibility of intravoxel incoherent motion of liver on a 3.0T scanner: free-breathing and respiratory-triggered sequences acquired with different numbers of excitations. Pol J Radiol. 2018;83:e437-e445. Published 2018 Sep 17. doi:10.5114/pjr.2018.79651
Figures
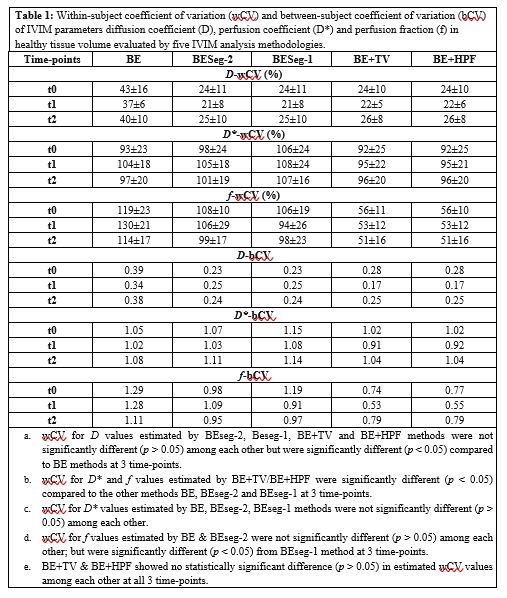
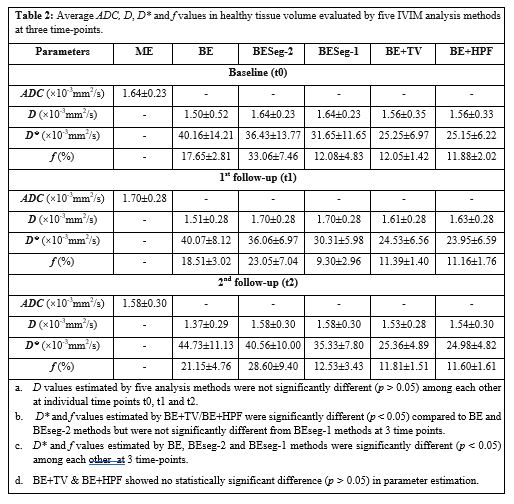
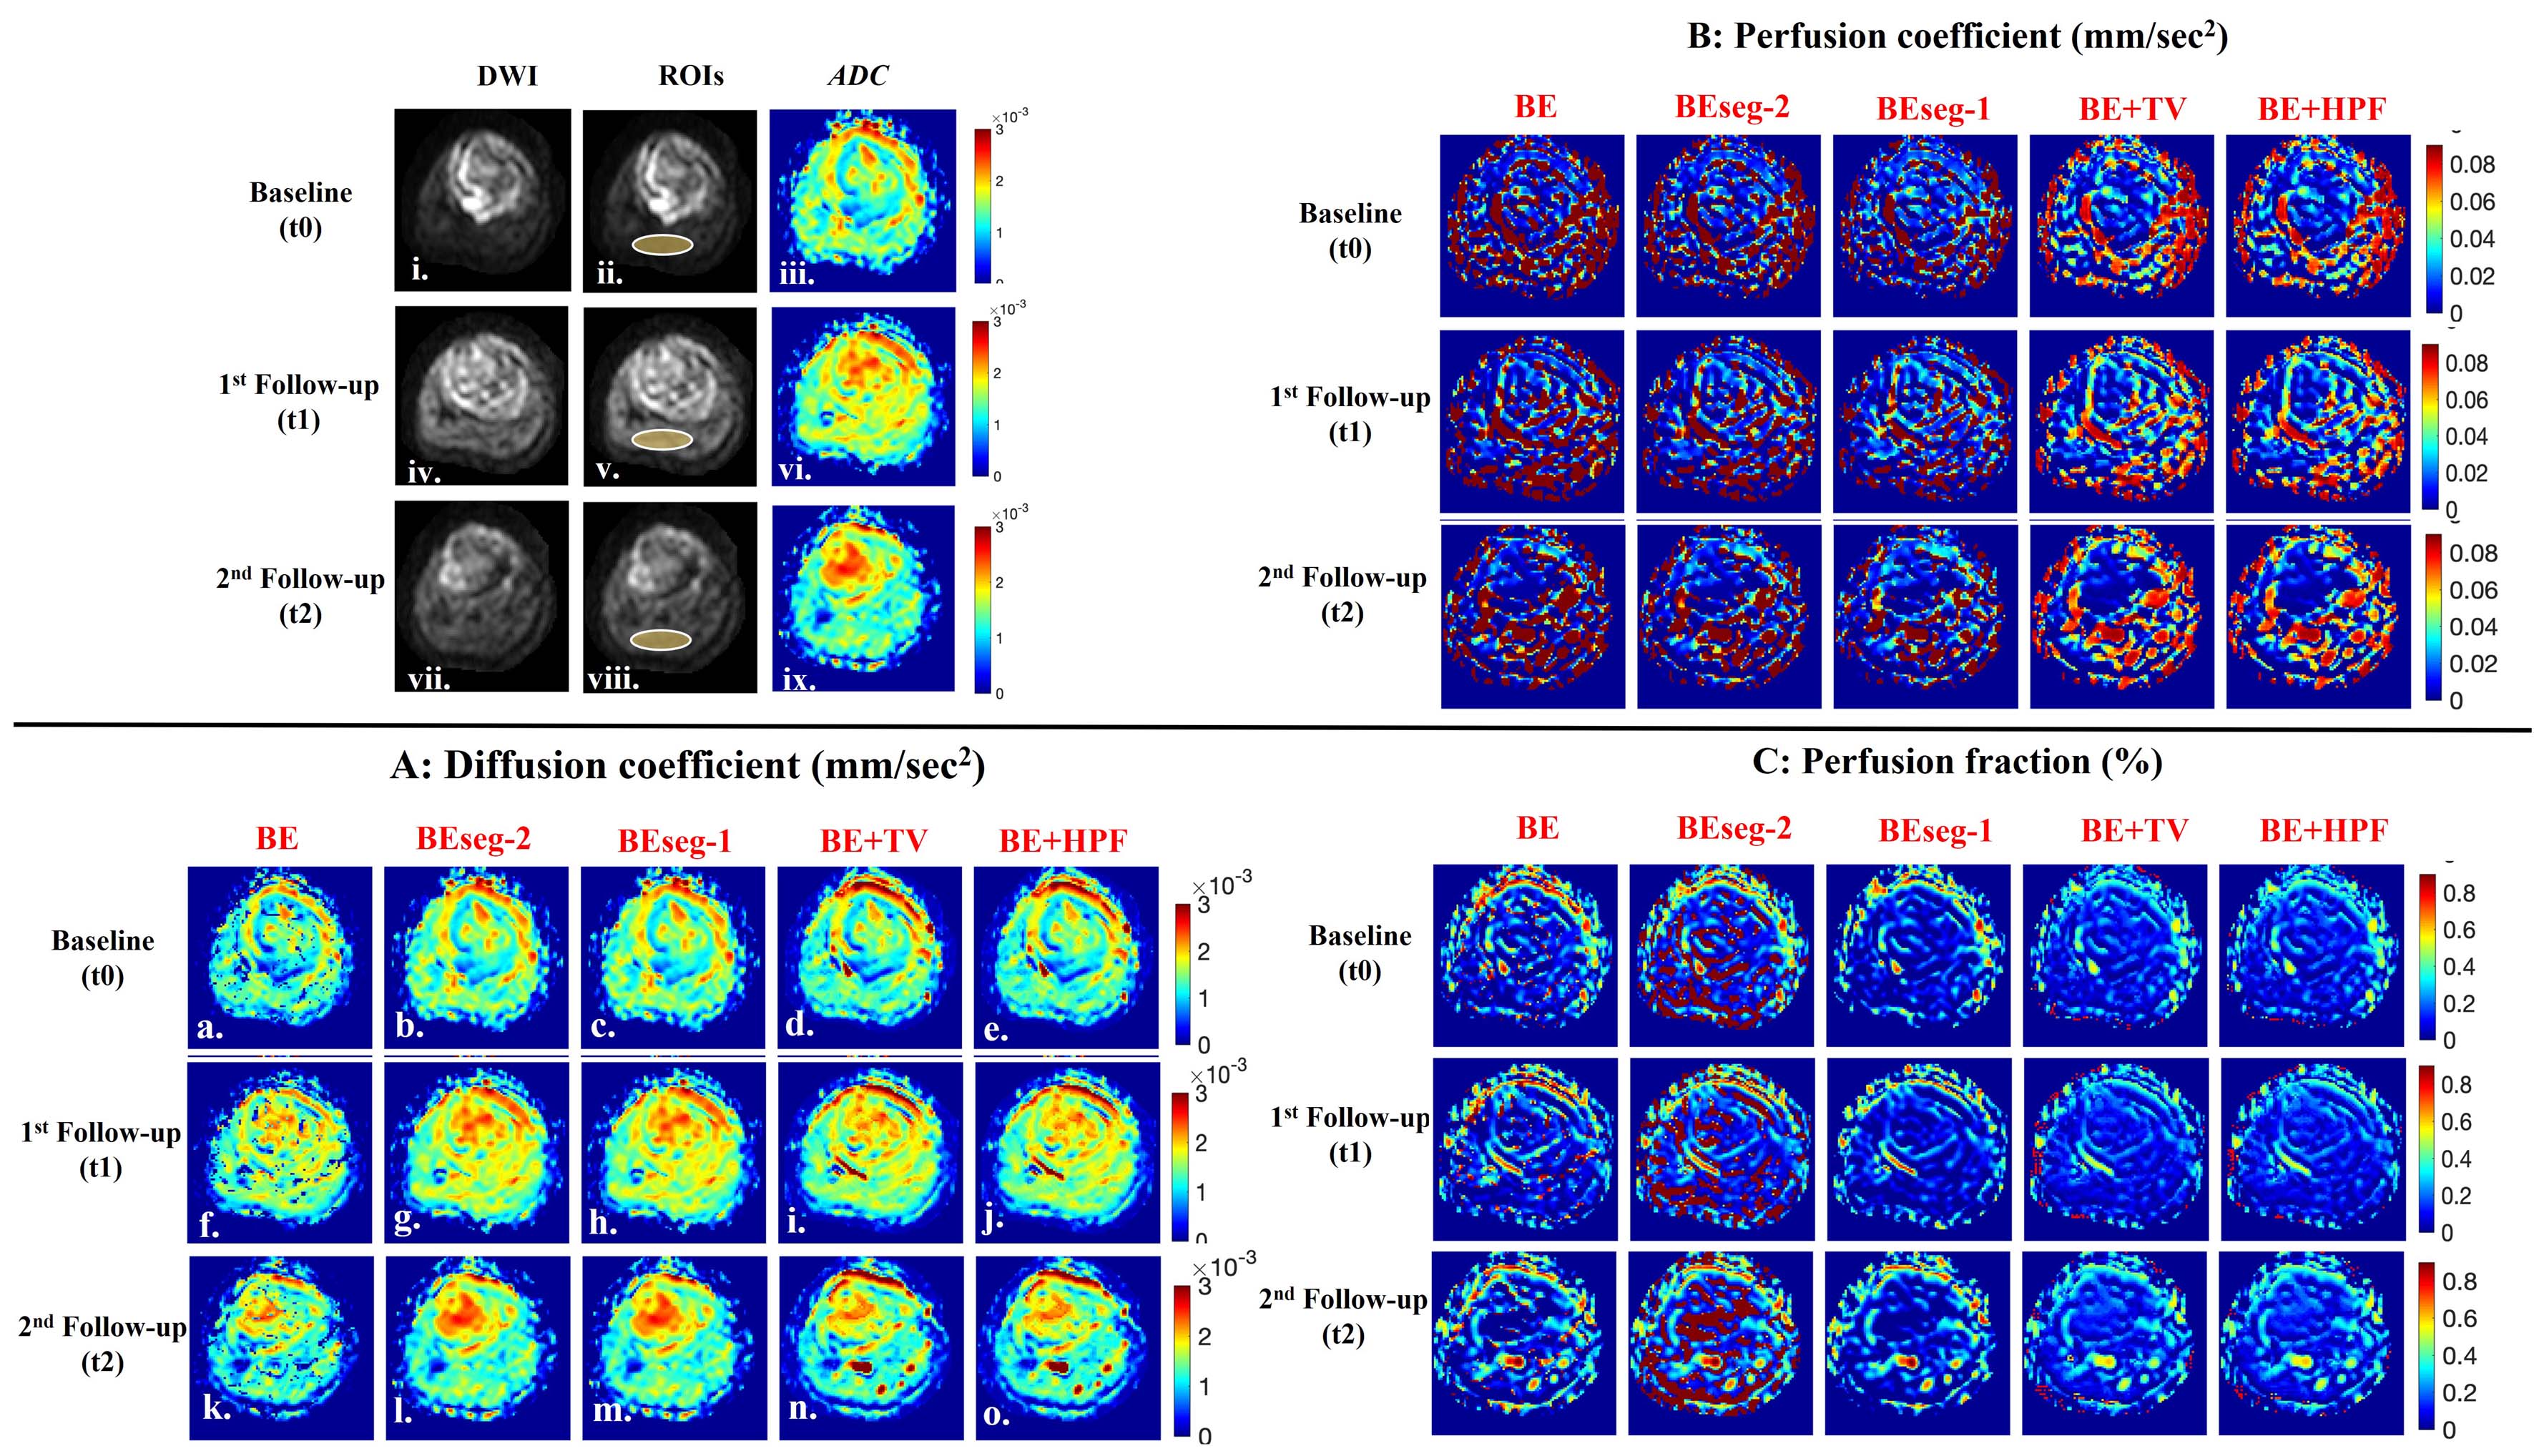
Figure 1: i, iv, vii) DWI (b=800 sec/mm2); ii, v, viii) DWI with ROIs for healthy tissue (yellow overlay); iii, vi, ix) Apparent Diffusion coefficient (ADC), of a representative patient (Male, 16 years) with osteosarcoma in left tibia at 3 time-points t0, t1 and t2 respectively. IVIM parametric maps estimated by five IVIM analysis methodologies 1) BE, 2) BESeg-2, 3) BESeg-1, 4) BE+TV and 5) BE+HPF at time-points t0, t1 and t2 are depicted in A) Diffusion coefficient (D), B) Perfusion coefficient (D*) and C) Perfusion fraction (f).
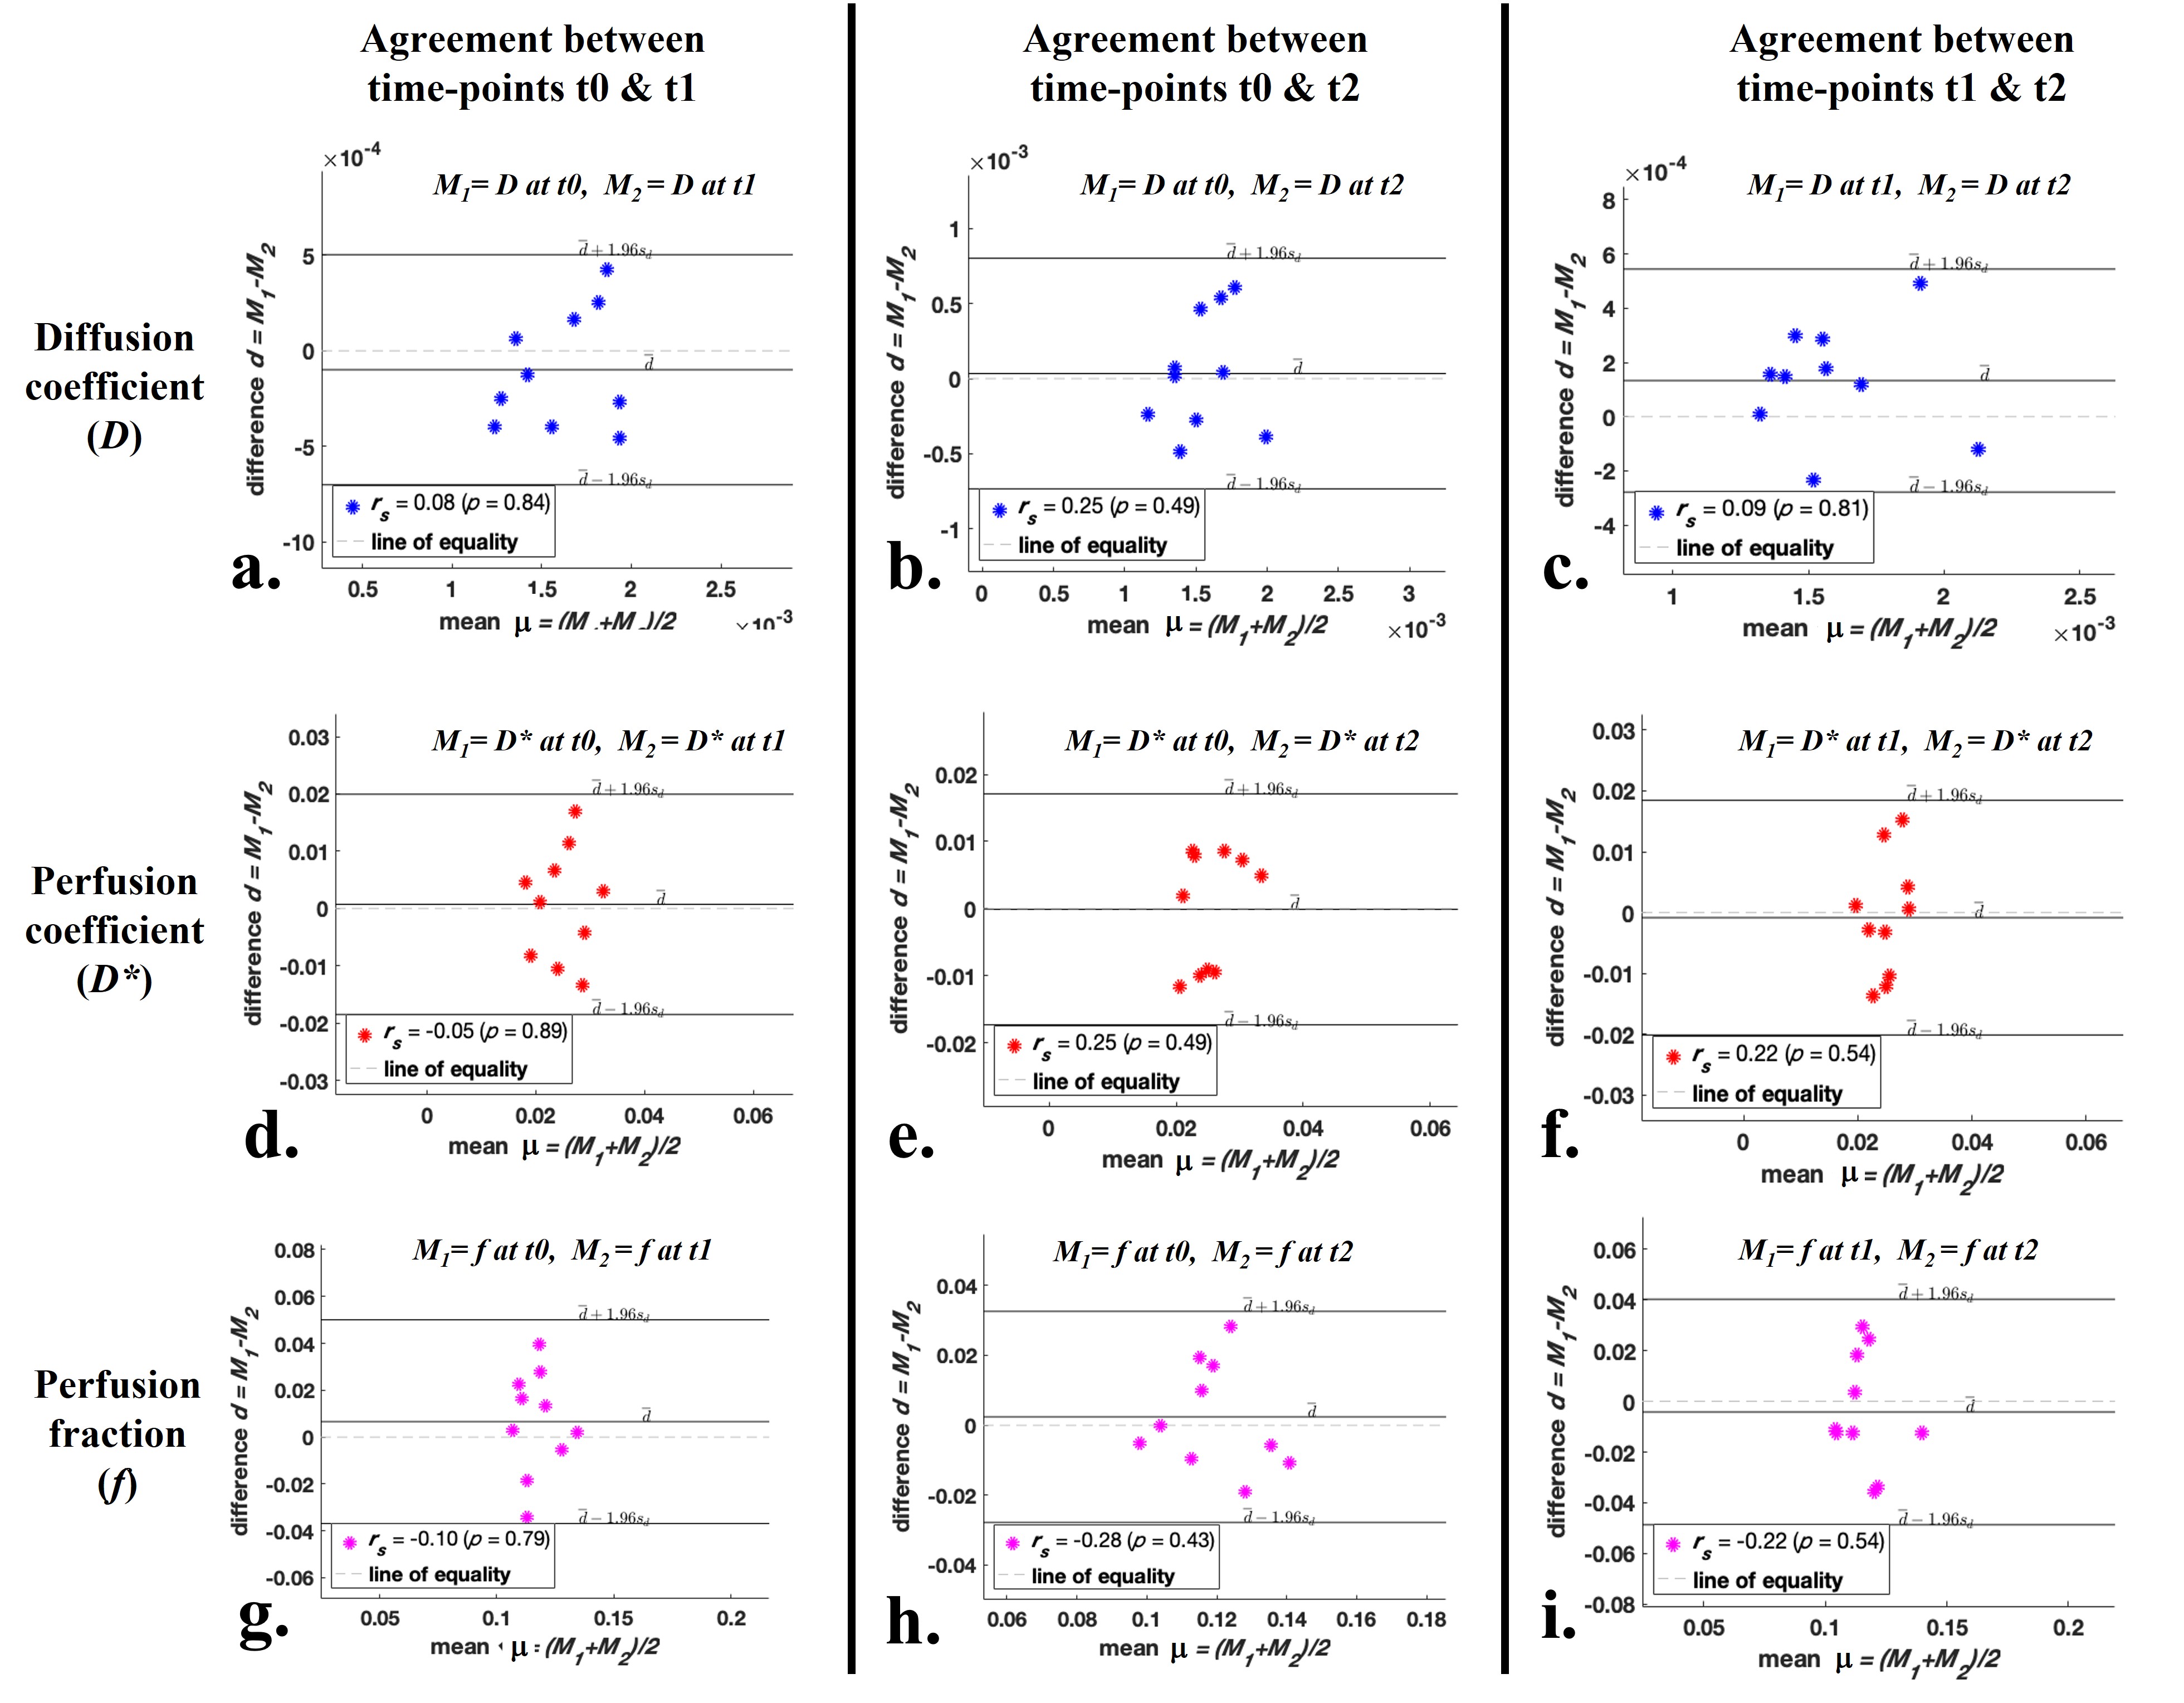
Figure 2: Bland-Altman plots showing inter-scan agreement of estimated parameters, Diffusion coefficient (a, b c), Perfusion coefficient (d, e, f) and Perfusion fraction (g, h, i) by IVIM analysis method BE+TV between time-points t0 and t1 (1st column); time-points t0 and t2 (2nd column); and time-points t1 and t2 (3rd column) in healthy tissue volume.