2906
Constructing a Mesh-Based Template of the Liver is Consistent as a Function of Cohort Size in the UK Biobank1Research Centre for Optimal Health, School of Life Science, University of Westminster, London, United Kingdom, 2Calico Life Sciences LLC, South San Francisco, CA, United States
Synopsis
Computational atlases provide many advantages in quantifying and modeling differences in the size and shape of internal organs between individuals in population imaging studies. A cohort of UK Biobank participants were analyzed to explore the consistency of templates, which is the average labeled image from a number of subjects constructed across different population sizes, and investigate whether this has an impact on the statistical analysis. We found no differences in our significance areas between templates. Although, for the statistical parametric mapping, a larger sample size that involves multiple hypothesis tests, results in a higher representative power.
Introduction
Image-derived phenotypes of internal organs from MRI reveal variations in volume and shape and may be used to compare differences between individuals from patient populations and healthy controls. The left ventricle of the heart, for example, has been studied using surface-mesh-based representations and mass univariate regression analysis1. A key step in this methodology is constructing a template of the organ using a fixed number of segmentations. Neck-to-knee acquisitions from the abdominal protocol in the UK Biobank (UKBB) have produced a wide variety of segmented organs in the abdominal and pelvic cavities2. Building on previous work3, we rigorously evaluate the effect of the number of segmentations used to construct a liver template from UKBB participants with no known disease.Methods
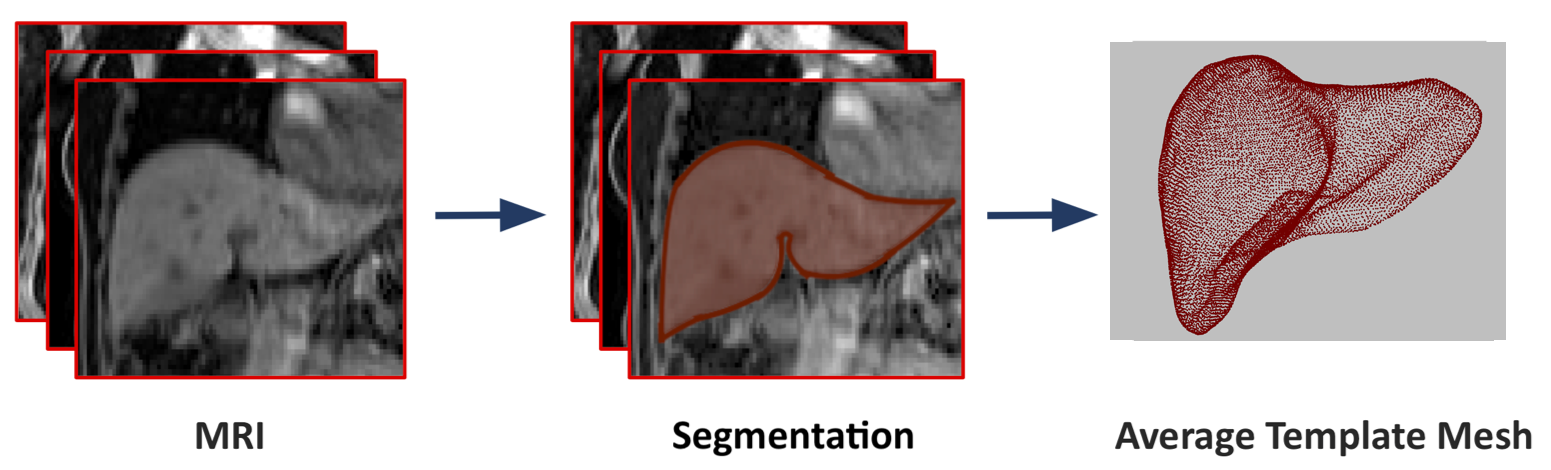
Full details regarding the UKBB abdominal protocol have previously been reported4. The data included here were focused on the neck-to-knee Dixon MRI acquisition. All data were processed and segmented using automated methods2.To assess the impact of population size on constructing a representative template, we used liver segmentations from a gender-balanced European ancestry cohort of 200 subjects, with BMI < 25 kg/m2 and liver fat < 3%, to construct our liver templates. Nested subsets of 20 and 100 participants were also defined from the set of 200 subjec. Image registration for the construction of the liver template was performed using rigid, affine registration and non-rigid registration using B-Spline symmetric normalisation with mutual information as the similarity metric5. Surface meshes were then constructed to create the liver templates in a coordinate space3 (Figure 1).
A separate cohort of 500 UKBB participants were selected to evaluate the three templates using mass univariate regression. These participants were of European genetic ancestry, aged 46-62 years and with no known disease. From their liver segmentations we first constructed three-dimensional surface meshes. Using the templates defined above, we performed a registration step where all subject-specific surfaces are rigidly aligned to a template surface. An affine transformation was computed between subject-specific and template segmentations and the resulting affine transformations used to warp the template to the subject's space. To enable subject comparison with a vertex-to-vertex correspondence and preserve the anatomical correspondence and consistency across all subjects, we employed a non-rigid transformation technique6.
The template was then warped to each subject’s space using the deformation fields obtained with IRTK implementation6-8. The 3D mesh-derived phenotype variation encoded from the liver meshes, specifically surface-to-surface (S2S) distance, was measured by computing the signed distance between the template surface and a subjects-specific surface for each vertex. This procedure was performed for the 500 subjects on each of the three templates and the S2S values were computed between each template surface and subjects’ surface. The associations between the 3D mesh-derived phenotype and anthropometric variables were modeled using mass univariate regression across the mesh vertices, where the regression model was adjusted for age, gender, BMI and waist-to-hip ratio (WHR). We applied threshold-free cluster enhancement (TFCE), to improve the sensitivity and stability of the statistical parametric maps (SPMs) from the regression model, and permutation testing3 to assess the statistical significance of the regression coefficients.
Results
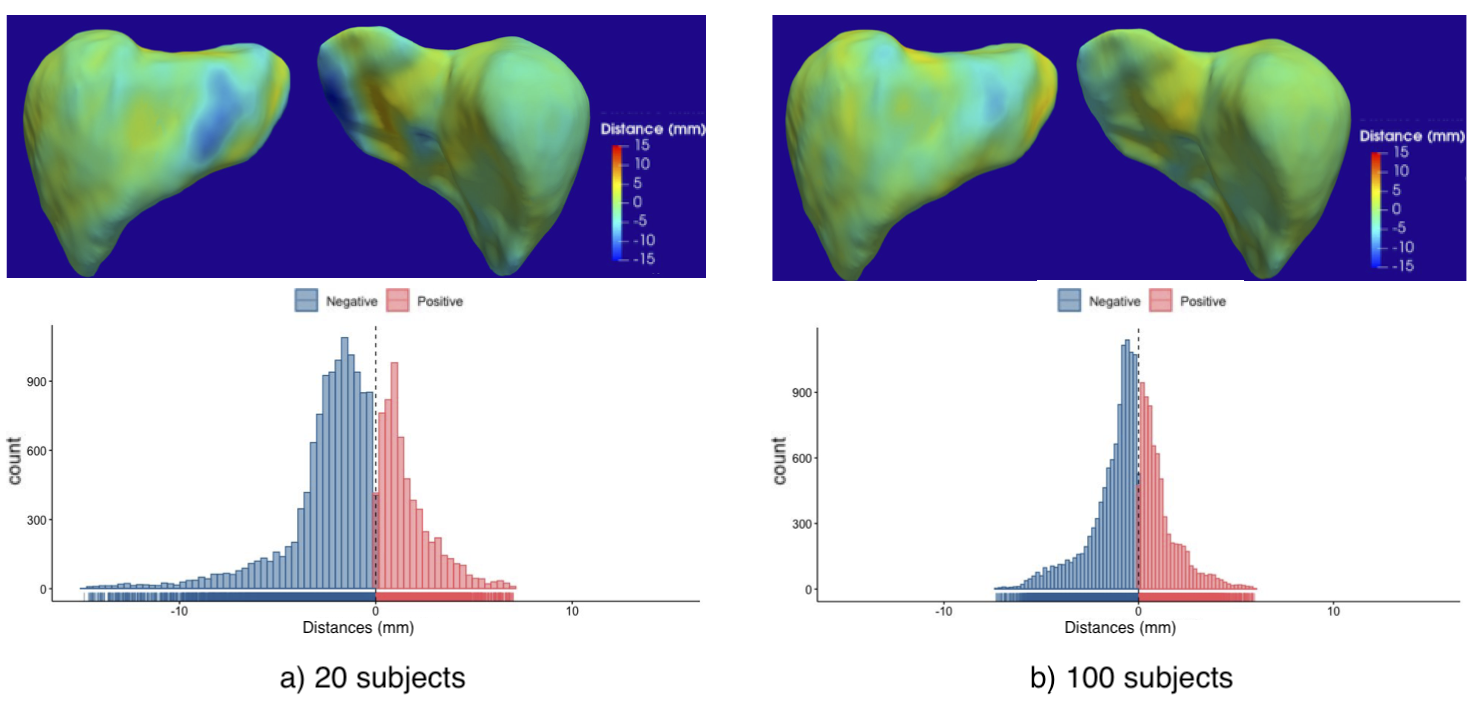
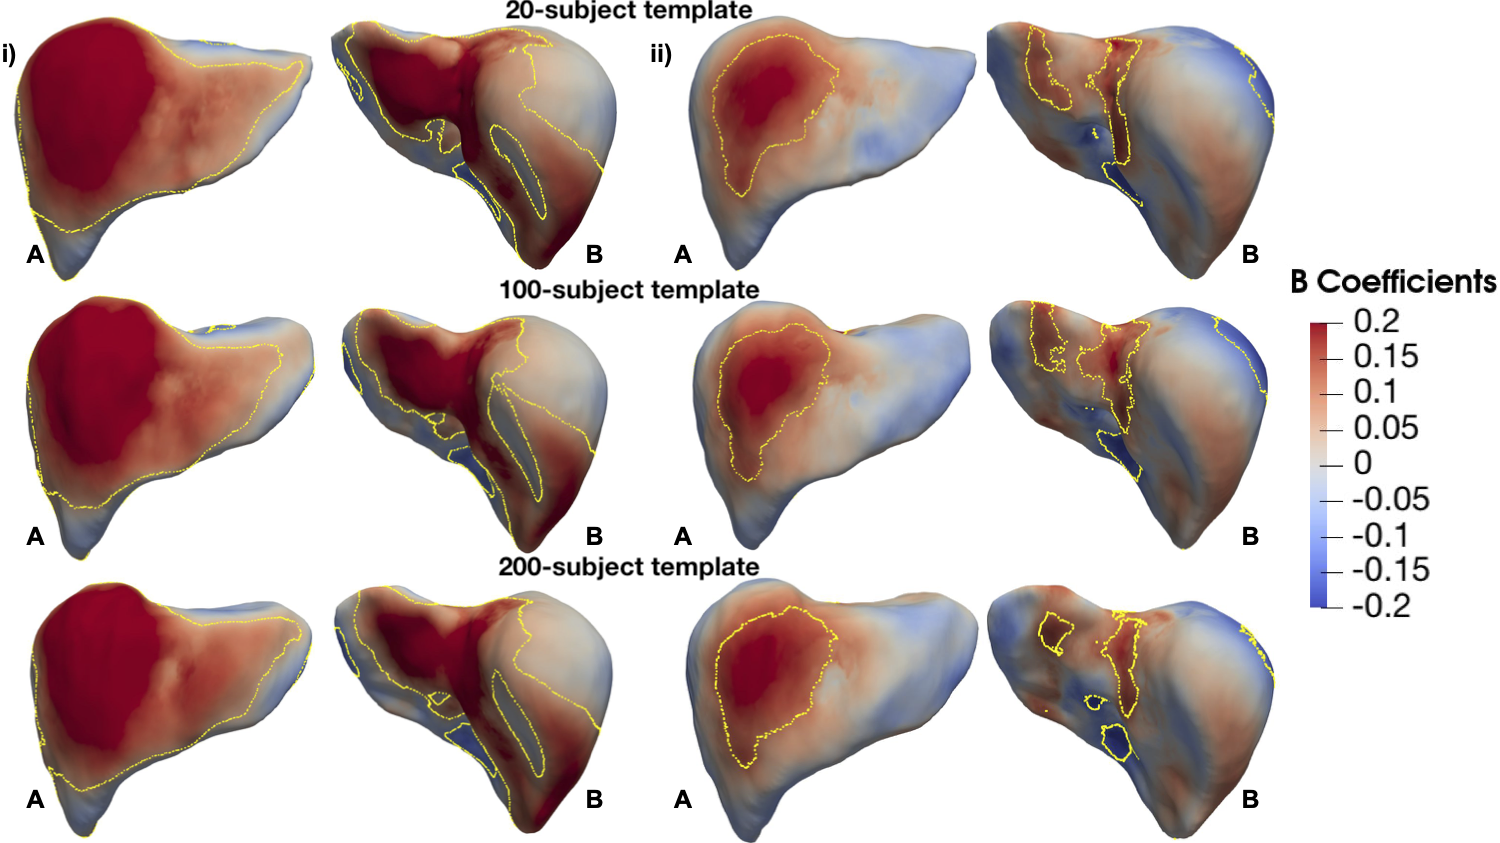
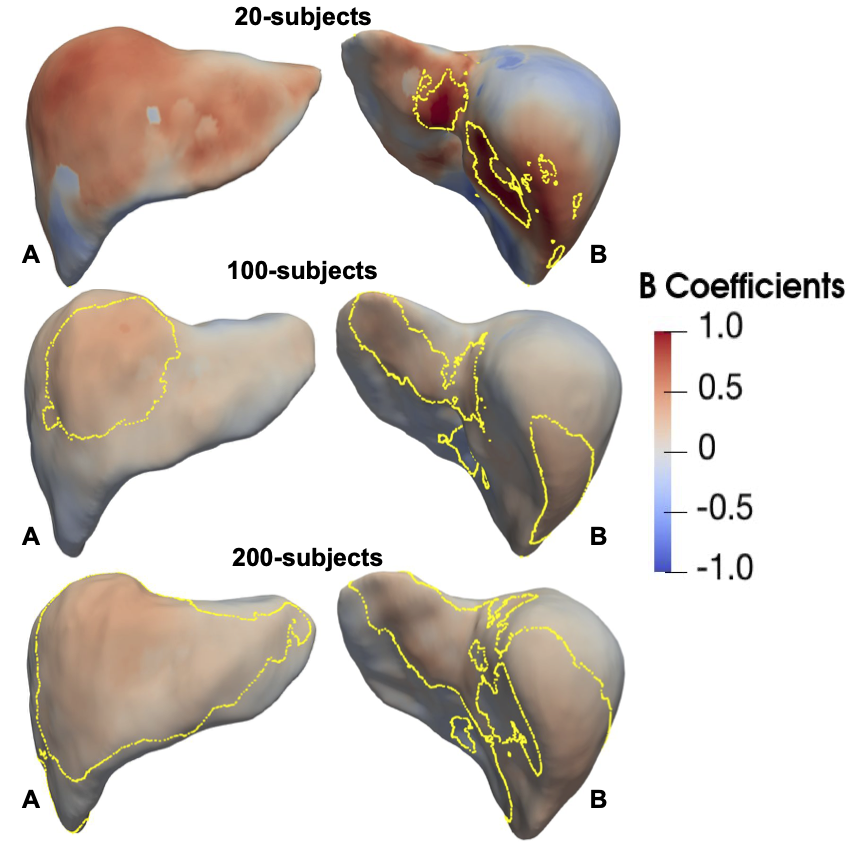
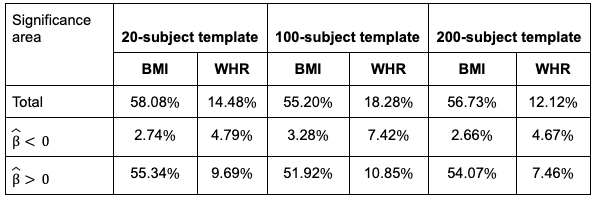
We computed the distances between each template mesh using the subpopulation of 20 or 100 subjects against the template constructed using 200 subjects (Figure 2). Both template shapes were similar compared with the 200-subject template, especially so for the 100 subjects template, where the differences in template distance were less than 8mm. The 3D SPMs with the TFCE corrected p-values for BMI and WHR with S2S values, on the different templates, are shown in Figure 3. The spatial distribution of the regression coefficient maps, from both anterior and posterior views, were consistent across the three templates regardless of the number of subjects used in their construction. There was no difference observed in the significance areas from the association between BMI and WHR with S2S values in the 500-subject cohort across the templates (Table 1). We also explored the regression coefficients when different sample sizes were used. Figure 4 shows the SPMs with the TFCE-corrected values from populations of 20, 100 and 200 subjects using the templates constructed from the same groups of subjects. When only 20 subjects were used the statistical power was shown to be weaker and improved as the number of subjects in the regression model increased.Discussion and Conclusion
For constructing a representative template, we have shown that having at least 100 subjects is sufficient to represent a broader population in the UK Biobank. We note that this is dependent on the quality of the MRI data and the subjects’ characteristics. The population size in the template construction did not impact the power of the statistical analysis across the 500-subjects cohort and was consistent across all templates. In the mass univariate regression analysis, where multiple hypotheses were tested across different sample sizes, we have shown that a larger sample size improved statistical power.Acknowledgements
We thank Matt Sooknah and Amoolya Singh for comments that improved the quality of our work. This research has been conducted using the UK Biobank Resource under Application Number 44584 and was funded by Calico Life Sciences LLC.References
1. Biffi C. et al. Three-dimensional cardiovascular imaging-genetics: A mass univariate framework. Bioinformatics 2018; 34:97-103
2. Liu Y. et al. Genetic architecture of 11 abdominal organ traits derived from abdominal MRI using deep learning. eLife 2021; 10:e65554
3. Thanaj, M. et al Mass Univariate Regression Analysis for Three-Dimensional Liver Image-Derived Phenotypes. MIUA 2021; p 165-176
4. Littlejohns, T.J et al. The UK Biobank imaging enhancement of 100,000 participants: Rationale, data collection, management and future directions. Nature Com 2020; 11:1-12
5. Avants B.B. et al. The optimal template effect in hippocampus studies of diseased populations. Neuroimage 2010; 49:2457–2466
6. Duan J. et al Automatic 3D Bi-Ventricular Segmentation of Cardiac Images by a Shape-Refined Multi- Task Deep Learning Approach. IEEE Trans on Med Im 2019; 38:2151-2164
7. Bai W. et al A bi-ventricular cardiac atlas built from 1000+ high resolution MR images of healthy subjects and an analysis of shape and motion. Med Im Anal 2015; 26:133-145
8. IRTK https://biomedia.doc.ic.ac.uk/software/irtk/
Figures