2904
Towards a robust and reproducible GluCEST analysis pipeline1Psychiatry, University of Pennsylvania, Philadelphia, PA, United States, 2Radiology, University of Pennsylvania, Philadelphia, PA, United States
Synopsis
Robust, reproducible methods are paramount in neuroimaging. This is a challenge for leading-edge and novel techniques at 7T MRI, such as glutamate-weighted chemical exchange saturation transfer (GluCEST). As such, our primary objective is to move towards a robust and reproducible analytical pipeline for GluCEST imaging data. Here we show, using python-based neuroimaging tools, the development of GluCEST-prep. GluCEST-prep incorporates common neuroimaging analysis steps—brain extraction, tissue segmentation, co-registration and normalization—that are optimized for 7T MRI and uses python-based analysis—in place of in-house MATLAB scripts—to generate post-processed 2D or 3D GluCEST images in both native and template space.
Introduction
Glutamate weighted Chemical Exchange Saturation Transfer (GluCEST) is a novel 7T MRI technique to image brain glutamate. It has been utilized in several studies to highlight the change in glutamatergic system across diagnostic and age groups. GluCEST processing relies on a combination of standard neuroimaging preprocessing and, to date, in-house analytic code limiting reproducibility. Furthermore, the current processing pipeline lacks necessary optimization for use with advanced structural MRI acquisition at 7T. Here, we provide an initial overview of an updated GluCEST analysis pipeline that is robust, reproducible and scalable.Methods
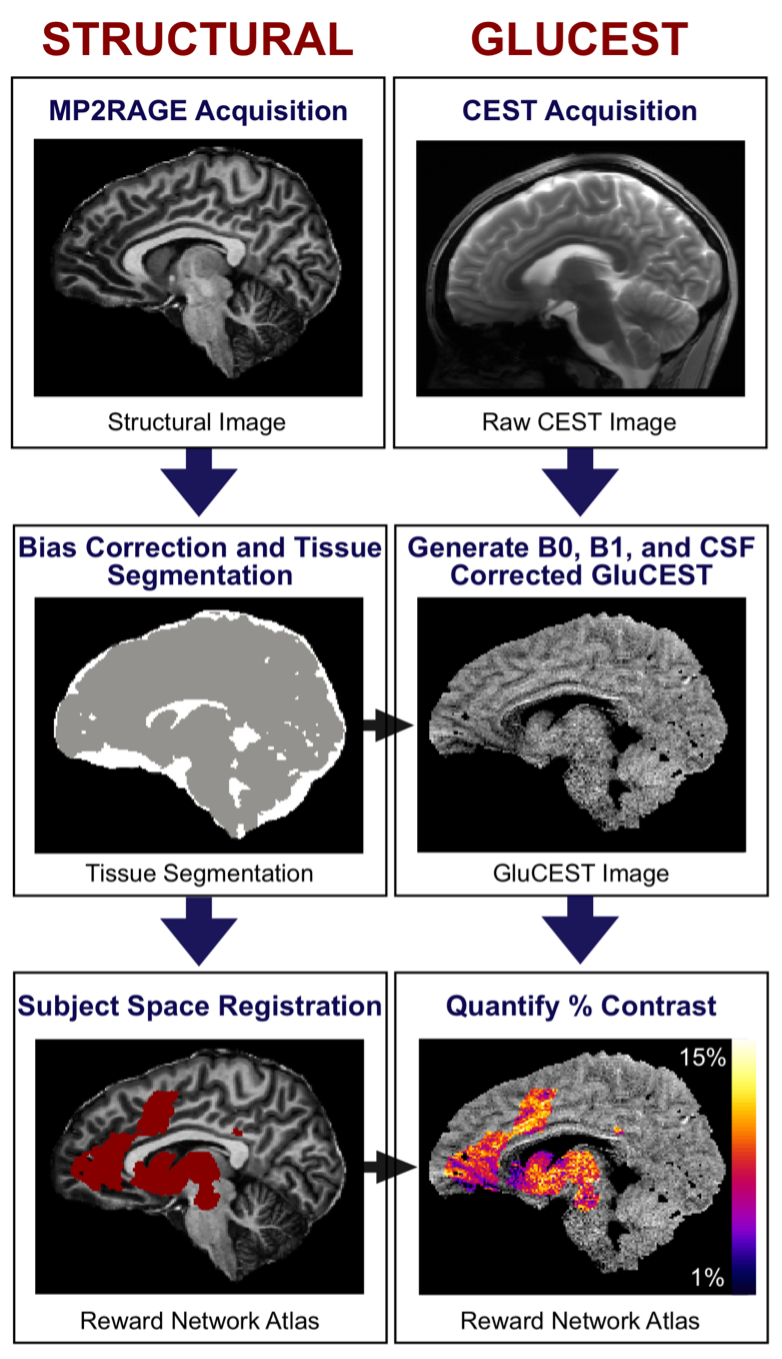
MRI data were acquired on a 7.0T Siemens Terra at the University of Pennsylvania. Acquisition of GluCEST images and B0 and B1 maps was completed as described in previous studies1-5. Briefly, 2D GluCEST images were acquired in a 5 mm sagittal slice (slice number: 1, slice thickness: 5 mm) positioned in the right hemisphere. This GluCEST field of view (FOV) offers full in-plane brain coverage (matrix size: 224 x 224) with 1 x 1 mm2 in-plane resolution. Structural images including T1-weighted uniform (UNI) images and corresponding INV1 and INV2 images were acquired with a Magnetization Prepared 2 Rapid Acquisition Gradient Echoes (MP2RAGE) sequence.GluCEST-prep calls upon state-of-the-art neuroimaging analysis tools. Brain extraction and segmentation are implemented using outputs of the MP2RAGE. HD-BET6 is used to generate a robust binary brain mask, while tissue segmentation is completed using combinations of the multi-contrast images generated from the MP2RAGE sequence7. To further improve the processing pipeline, bias correction and registration to template space (e.g., MNI152) is performed using ANTs8. The major goal of the updated GluCEST-prep pipeline was to translate in-house MATLAB analysis code3,4,5 to Python to improve accessibility and reproducibility of the pipeline. GluCEST-prep allows for flexibility in file selection, automatic or manual brain extraction, and employs branching logic to determine optimal brain segmentation based on available structural input. To validate the new pipeline data from 81 subjects were analyzed using both traditional in-house MATLAB analysis and the new python-based GluCEST-prep. The T1 image was registered to MNI152 T1 image, GluCEST image and T2 image were registered to the T1 image, and using the transformation matrix from T1 to MNI, the T2 and GluCEST image were registered to MNI space. The output of GluCEST-prep includes native space GluCEST, B0, B1, gray, white and CSF segmentation maps, and regions-of-interest that can be used for statistical analysis.
Results
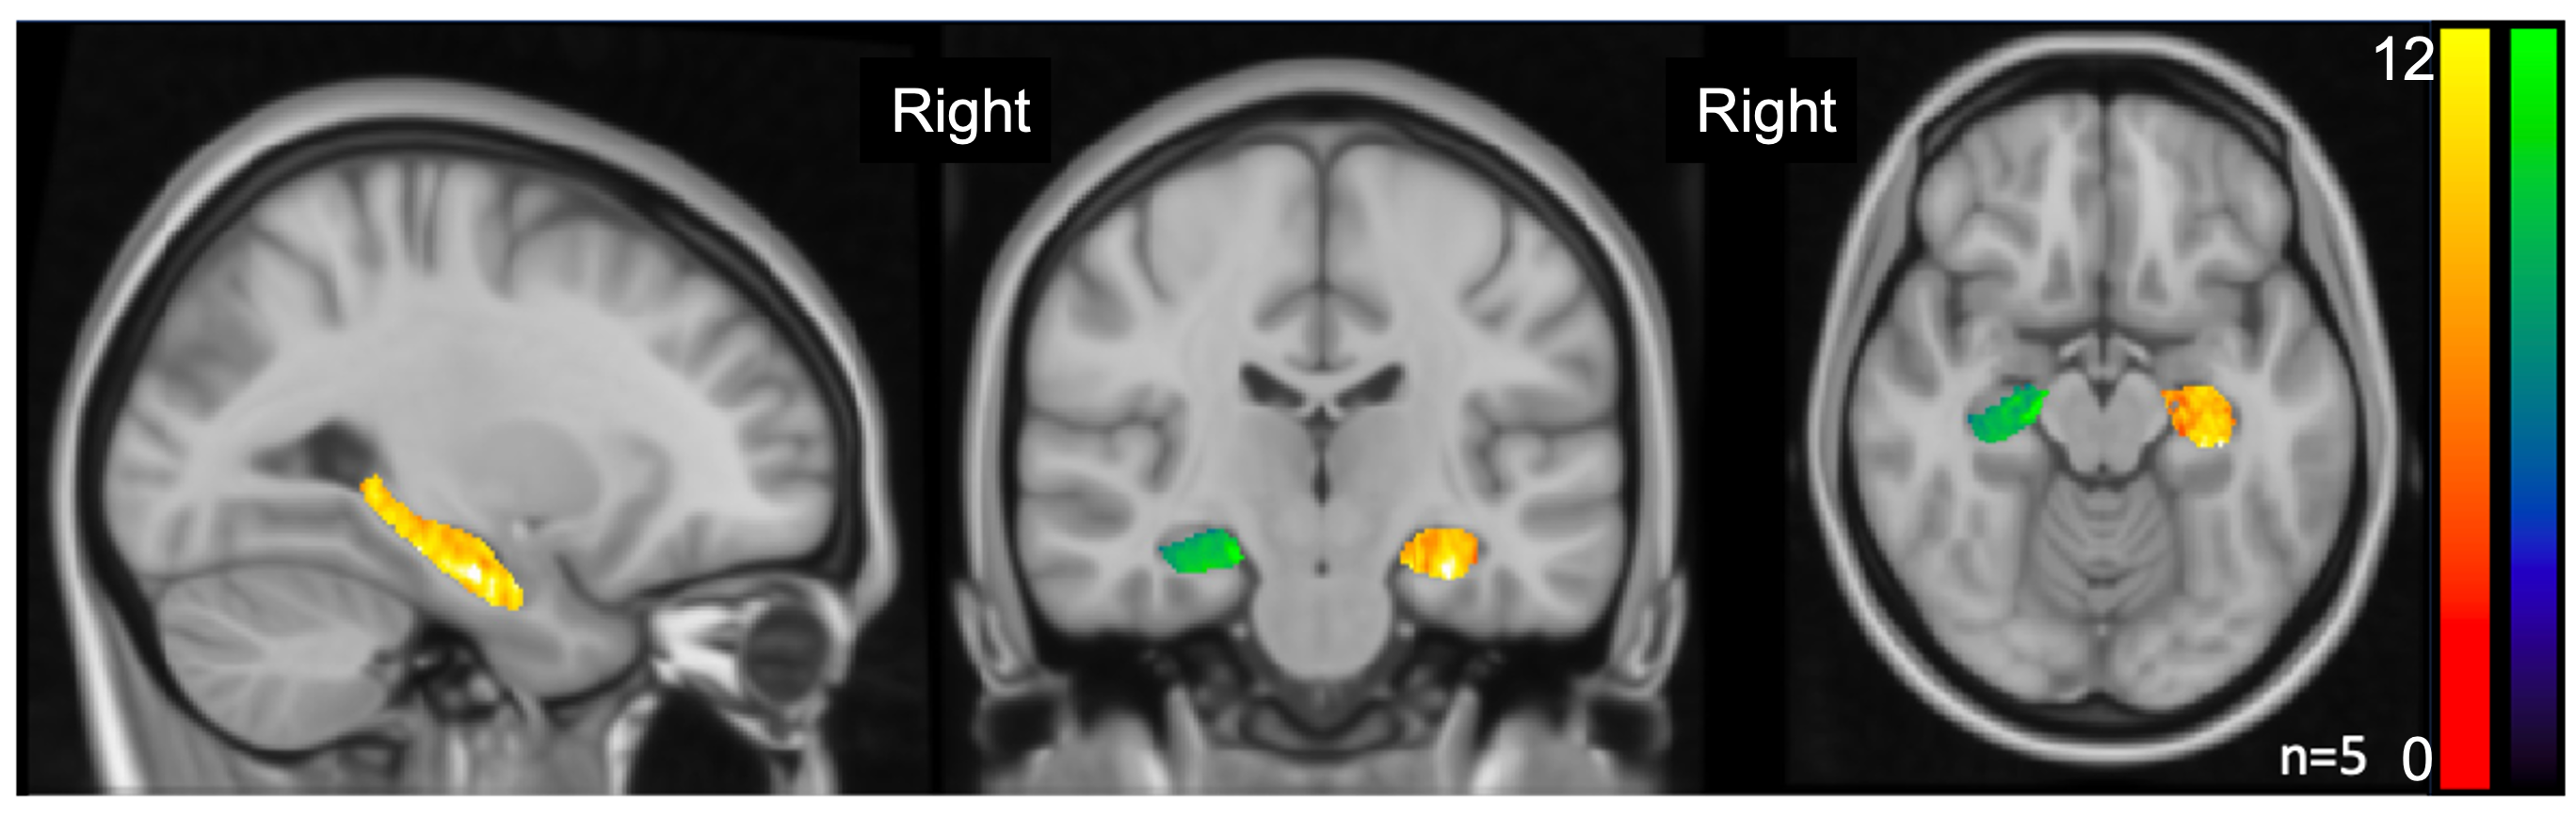
Analytical steps detailed in Figure 1. Notably, the original MATLAB and updated python based GluCEST analysis were highly similar in the 81 GluCEST datasets analyzed. As expected, resulting Pearson correlation between outcome GluCEST images using MATLAB or the python based GluCEST-prep was 0.99. This validates the use of a python-based open-source tool in comparison to in-house MATLAB based scripts. Figure 2 shows the outcome of using GluCEST-prep to analyze five 3D GluCEST datasets covering the hippocampus. As can be seen in Figure 2 robust GluCEST signal is present in both the left and right hippocampus.Discussion
The updated version of the GluCEST analysis pipeline, GluCEST-prep, successfully replicates the processing steps of the existing version using robust, automated neuroimaging tools. This python-based tool implements optimized brain extraction and segmentation tools and produces robust measurements of GluCEST. Additionally, updates and upgrades are currently being made to this beta-version of GluCEST-prep prior to public release to improve usability. Future updates will include the ability to handle both 2D and 3D GluCEST inputs as well as by producing high-quality visual reports and logs of all processing steps. These reports will allow the user to easily view input data and output data, thereby improving the efficiency of quality assessment and improving reliability of GluCEST data. In summary, we have developed a robust and reliable python-based analysis tool that can seamlessly and quickly analyze GluCEST data.Acknowledgements
Research reported in this work was supported by the National Institute of Biomedical Imaging and Bioengineering of the National Institutes of Health under award Number P41EB029460 and by the National Institute of Aging (R56AG066656, R01AG063869) and National Institute of Mental Health (R01MH120174) of the National Institutes of Health.References
1. Roalf DR, Nanga RPR, Rupert PE, et al. Glutamate imaging (GluCEST) reveals lower brain GluCEST contrast in patients on the psychosis spectrum. Mol Psychiatry. 2017; 22(9): 1298- 305.
2. Sydnor V, Kohler CG, Crow AJD, et al. Reward network glutamate level is associated with dimensional reward responsiveness. Biol Psychiatry. 2020; 87(9): S218-S219.
3. Cai K, Haris M, Singh A, et al. Magnetic resonance imaging of glutamate. Nat Med. 2012;18(2):302-306. doi:10.1038/nm.2615
4. Singh A, Cai K, Haris M, Hariharan H, Reddy R. On B1 inhomogeneity correction of in vivo human brain glutamate chemical exchange saturation transfer contrast at 7T. Magn Reson Med. 2013;69(3):818-824. doi:10.1002/mrm.24290
5. Kim M, Gillen J, Landman BA, Zhou J, Van Zijl PCM. Water saturation shift referencing (WASSR) for chemical exchange saturation transfer (CEST) experiments. Magn Reson Med. 2009;61(6):1441-1450. doi:10.1002/mrm.21873
6. Isensee F, Schell M, Tursunova I, et al. Automated brain extraction of multi-sequence MRI using artificial neural networks. Hum Brain Mapp. 2019; 40(17): 1–13.
7. Choi US, Kawaguchi H, Matsuoka Y, et al. Brain tissue segmentation based on MP2RAGE multi-contrast images in 7T MRI. PLoS One. 2019; 14(2): e0210803.
8. Tustison NJ, Cook PA, Klein A, et al. Large-scale evaluation of ANTs and FreeSurfer cortical thickness measurements. Neuroimage. 2014; 99: 166-179.
Figures