2903
A multiplicative denoising method based on compressed sensing for magnetic resonance spectroscopy and imaging
Ricardo P. Martinho1, David Koprivica1, Mihajlo Novakovic1, Michael J. Jaroszewicz1, and Lucio Frydman1
1Department of Chemical and Biological Physics, Weizmann Institute of Science, Rehovot, Israel
1Department of Chemical and Biological Physics, Weizmann Institute of Science, Rehovot, Israel
Synopsis
2D MRI/S are commonly affected by changes in temperature, field drifts, or motions, leading to multiplicative noise. We introduce here CoSeM (Compressed Sensing Multiplicative) denoising, a method that converts instability-related “t1” noise, into additive noise liable to signal averaging. CoSeM evaluates and discards indirect-domain points that may have been strongly influenced by instabilities, and makes up for this discarding by compressed sensing reconstructions. 2D localized MRS in the brain and 2D abdominal MRI experiments liable to instabilities, evidence 2-3 fold increases in SNR by CoSeM processing. CoSeM is also shown to retain quantitative information –e.g., in T1 mapping experiments.
Introduction
MRI and MRS toolboxes provide a multitude of anatomical and dynamic information. However, such experiments usually span several dimensions acquired over protracted times, that make them susceptible to temperature alterations, field-related frequency drifts, motions, etc.1-3 This well described problem in the in vitro and in vivo NMR literature is often denoted as t1 noise.1 Several approaches have been introduced to tackle it, such as pulse sequence modifications,4 reference-based denoising,5 signal co-addition,6 singular value decomposition,7 or resampling.8 The majority of these methods require high signal-to-noise ratio, can only be applicable to specific experiments, or can lead to false positive and/or false negative peaks, thus damaging the spectral quality itself. This study proposes CoSeM –a general method to improve the SNR of spectra and images corrupted by multiplicative noise, which uses sub-sampled datasets chosen to be minimally corrupted, and reconstructs them generating a spectrum/image by compressed sensing (CS9-12) –thereby attenuating the corrupted data’s influence.Methods
CoSeM denoising is a custom script written on Matlab, calling the BART Toolbox13 for the CS implementation. In vivo 2D localized MRS experiments were performed in naïve black mice in a 15.2 T Bruker; abdominal MRI experiments were performed on orthotopic KPC pancreatic tumor-bearing mice in a 7.0 T Agilent. See Captions for further details.Results
Multiplicative noise manifests itself in nD MRI/S as pseudo-random variations along the baseline of the indirect dimension(s). This convolves the legitimate signal with spectral instabilities, which in the Fourier domain is expressed as:S(ω1,ω2) = A(ω1)ω1 Strue*(ω1,ω2)
n1 indirect-domain points will thus be associated with n1 different coefficients of {A}, describing fluctuations ≠1. It is in principle possible to reduce the number of coefficients and still reconstruct the 2D data via compressed sensing, by taking a sub-representation of the fully sampled data set where a fraction of the sampled k/t1 values along the indirect domain, has been randomly masked out. This is the underlying principle of CoSeM, which iterates these representations a number of times (each with a different mask) leading to different ω1 noise patterns. CoSeM then selectively co-adds these spectra/images, while using criteria that diminish the amount incoherent noise, as sketched in Figure 1. Figure 2 exemplifies the method on 2D localized double-quantum-filtered COSY experiments collected on a live mouse brain. These acquisitions’ SNR is commonly dominated by t1-noise and instabilities.14 Two criteria were used for guiding CoSeM’s selective averaging, based on norm and entropy criteria. An average 3x increase in SNR is provided by either criterion over the original data, performing significantly better than the 1.4-fold improvement obtained by blind-averaging. In no cases were spurious cross-peaks originated by the method. Figure 3 presents denoising results attained in in vivo abdominal mice EPI MRI –a notoriously challenging case affected by motions which can render EPI to be of limited value. As can be seen, CoSeM significantly improves the image quality. This is best evidenced by the slices displayed in (c-d), where less pronounced noise effects are seen both in tissue-containing and tissue-free regions, while the edges of the tissues are preserved with minimal blurring. An important issue of denoising methods concerns their preservation of quantitativeness: if this is not kept, measurements of signal intensities will become compromised. CoSeM’s faithfulness in this aspect was assessed by T1 values in the abdomen of a live animal via inversion-recovery; then comparing the T1 maps obtained with and without CoSeM. These results, are summarized in Figure 4, which evidences that the method does not affect quantitativeness even when significantly changing the signals’ intensities. Notice the improvement in SNR of the images, and the similarity with the original image intensities evidenced by various organs (Fig. 4c).
Discussion & Conclusion
Multiplicative denoising by employing different random sampling and CS-based reconstruction has been demonstrated in vivo for localized brain MRS and abdominal MRI. This method shows generality and applicability to all these problems, in reasonably low computational times. An SNR increase of 2-3 fold and no spurious signals can be encountered in the spectra or images. Further work to applying these methods to dynamical systems and increasing the dimensionality are ongoing.Acknowledgements
This work was supported by the Clore Institute for High Field Magnetic Resonance Spectroscopy and Imaging (Weizmann Institute), the Israel Science Foundation (grants 2508/17 and 965/18), a Thompson Family Foundation grant, and the EU Horizon 2020 programme (Marie Sklodowska-Curie Grant 642773). The authors thank Prof. Avigdor Scherz for providing the mice with pancreatic tumors.References
- Mehlkopf, A. F.; Korbee, D.; Tiggelman, T. A.; Freeman, R. Sources of t1 Noise in Two-Dimensional NMR. J. Magn. Reson. 1984, 58, 315.
- Morris, G. A. Systematic Sources of Signal Irreproducibility and t1 Noise in High-Field NMR Spectrometers. J. Magn. Reson. 1992, 100, 316.
- Ladd, M. E.; Bachert, P.; Meyerspeer, M.; Moser, E.; Nagel, A. M.; Norris, D. G.; Schmitter, S.; Speck, O.; Straub, S.; Zaiss, M. Pros and Cons of Ultra-High-Field MRI/MRS for Human Application. Prog. Nucl. Magn. Reson. Spectrosc. 2018, 109, 1.
- Horne, T. J.; Morris, G. A. Gradient-Enhanced Experiments P-Type COSY Show Lower t1 Noise than N-Type. Magn. Reson. Chem. 1997, 35, 680.
- Gibbs, A.; Morris, G.; Swanson, A.; Cowburn, D. Suppression of t1 Noise in 2D NMR Spectroscopy by Reference Deconvolution. Journal of Magnetic Resonance, Series A. 1993, 351.
- Mo, H.; Harwood, J. S.; Yang, D.; Post, C. B. A Simple Method for NMR t1 Noise Suppression. J. Magn. Reson. 2017, 276, 43.
- Brissac, C.; Malliavin, T. E.; Delsuc, M. A. Use of the Cadzow Procedure in 2D NMR for the Reduction of T1 Noise. J. Biomol. NMR 1995, 6, 361.
- Song, L.; Wang, J.; Su, X.; Zhang, X.; Li, C.; Zhou, X.; Yang, D.; Jiang, B.; Liu, M. REAL‐ t1 , an Effective Approach for t1 ‐Noise Suppression in NMR Spectroscopy Based on Resampling Algorithm. Chinese J. Chem. 2020, 38, 77.
- Bostock, M.; Nietlispach, D. Compressed Sensing: Reconstruction of Non-Uniformly Sampled Multidimensional NMR Data. Concepts Magn. Reson. Part A 2017, 46A.
- Lustig, M.; Donoho, D. L.; Santos, J. M.; Pauly, J. M. Compressed Sensing MRI: A Look at How CS Can Improve on Current Imaging Techniques. IEEE Signal Process. Mag. 2008, 25, 72.
- Lustig, M.; Donoho, D.; Pauly, J. M. Sparse MRI: The Application of Compressed Sensing for Rapid MR Imaging. Magn. Reson. Med. 2007, 58, 1182.
- Chauffert, N.; Ciuciu, P.; Kahn, J.; Weiss, P. Variable Density Sampling with Continuous Trajectories. SIAM J. Imaging Sci. 2014, 7, 1962.
- Uecker, M.; Tamir, J. I.; Ong, F.; Lustig, M. The BART Toolbox for Computational Magnetic Resonance Imaging. ISMRM 2016.
- Verma, G.; Hariharan, H.; Nagarajan, R.; Nanga, R. P. R.; Delikatny, E. J.; Thomas, M. A.; Poptani, H. Implementation of Two-Dimensional L-COSY at 7 Tesla: An Investigation of Reproducibility in Human Brain. J. Magn. Reson. Imaging 2014, 40, 1319.
Figures
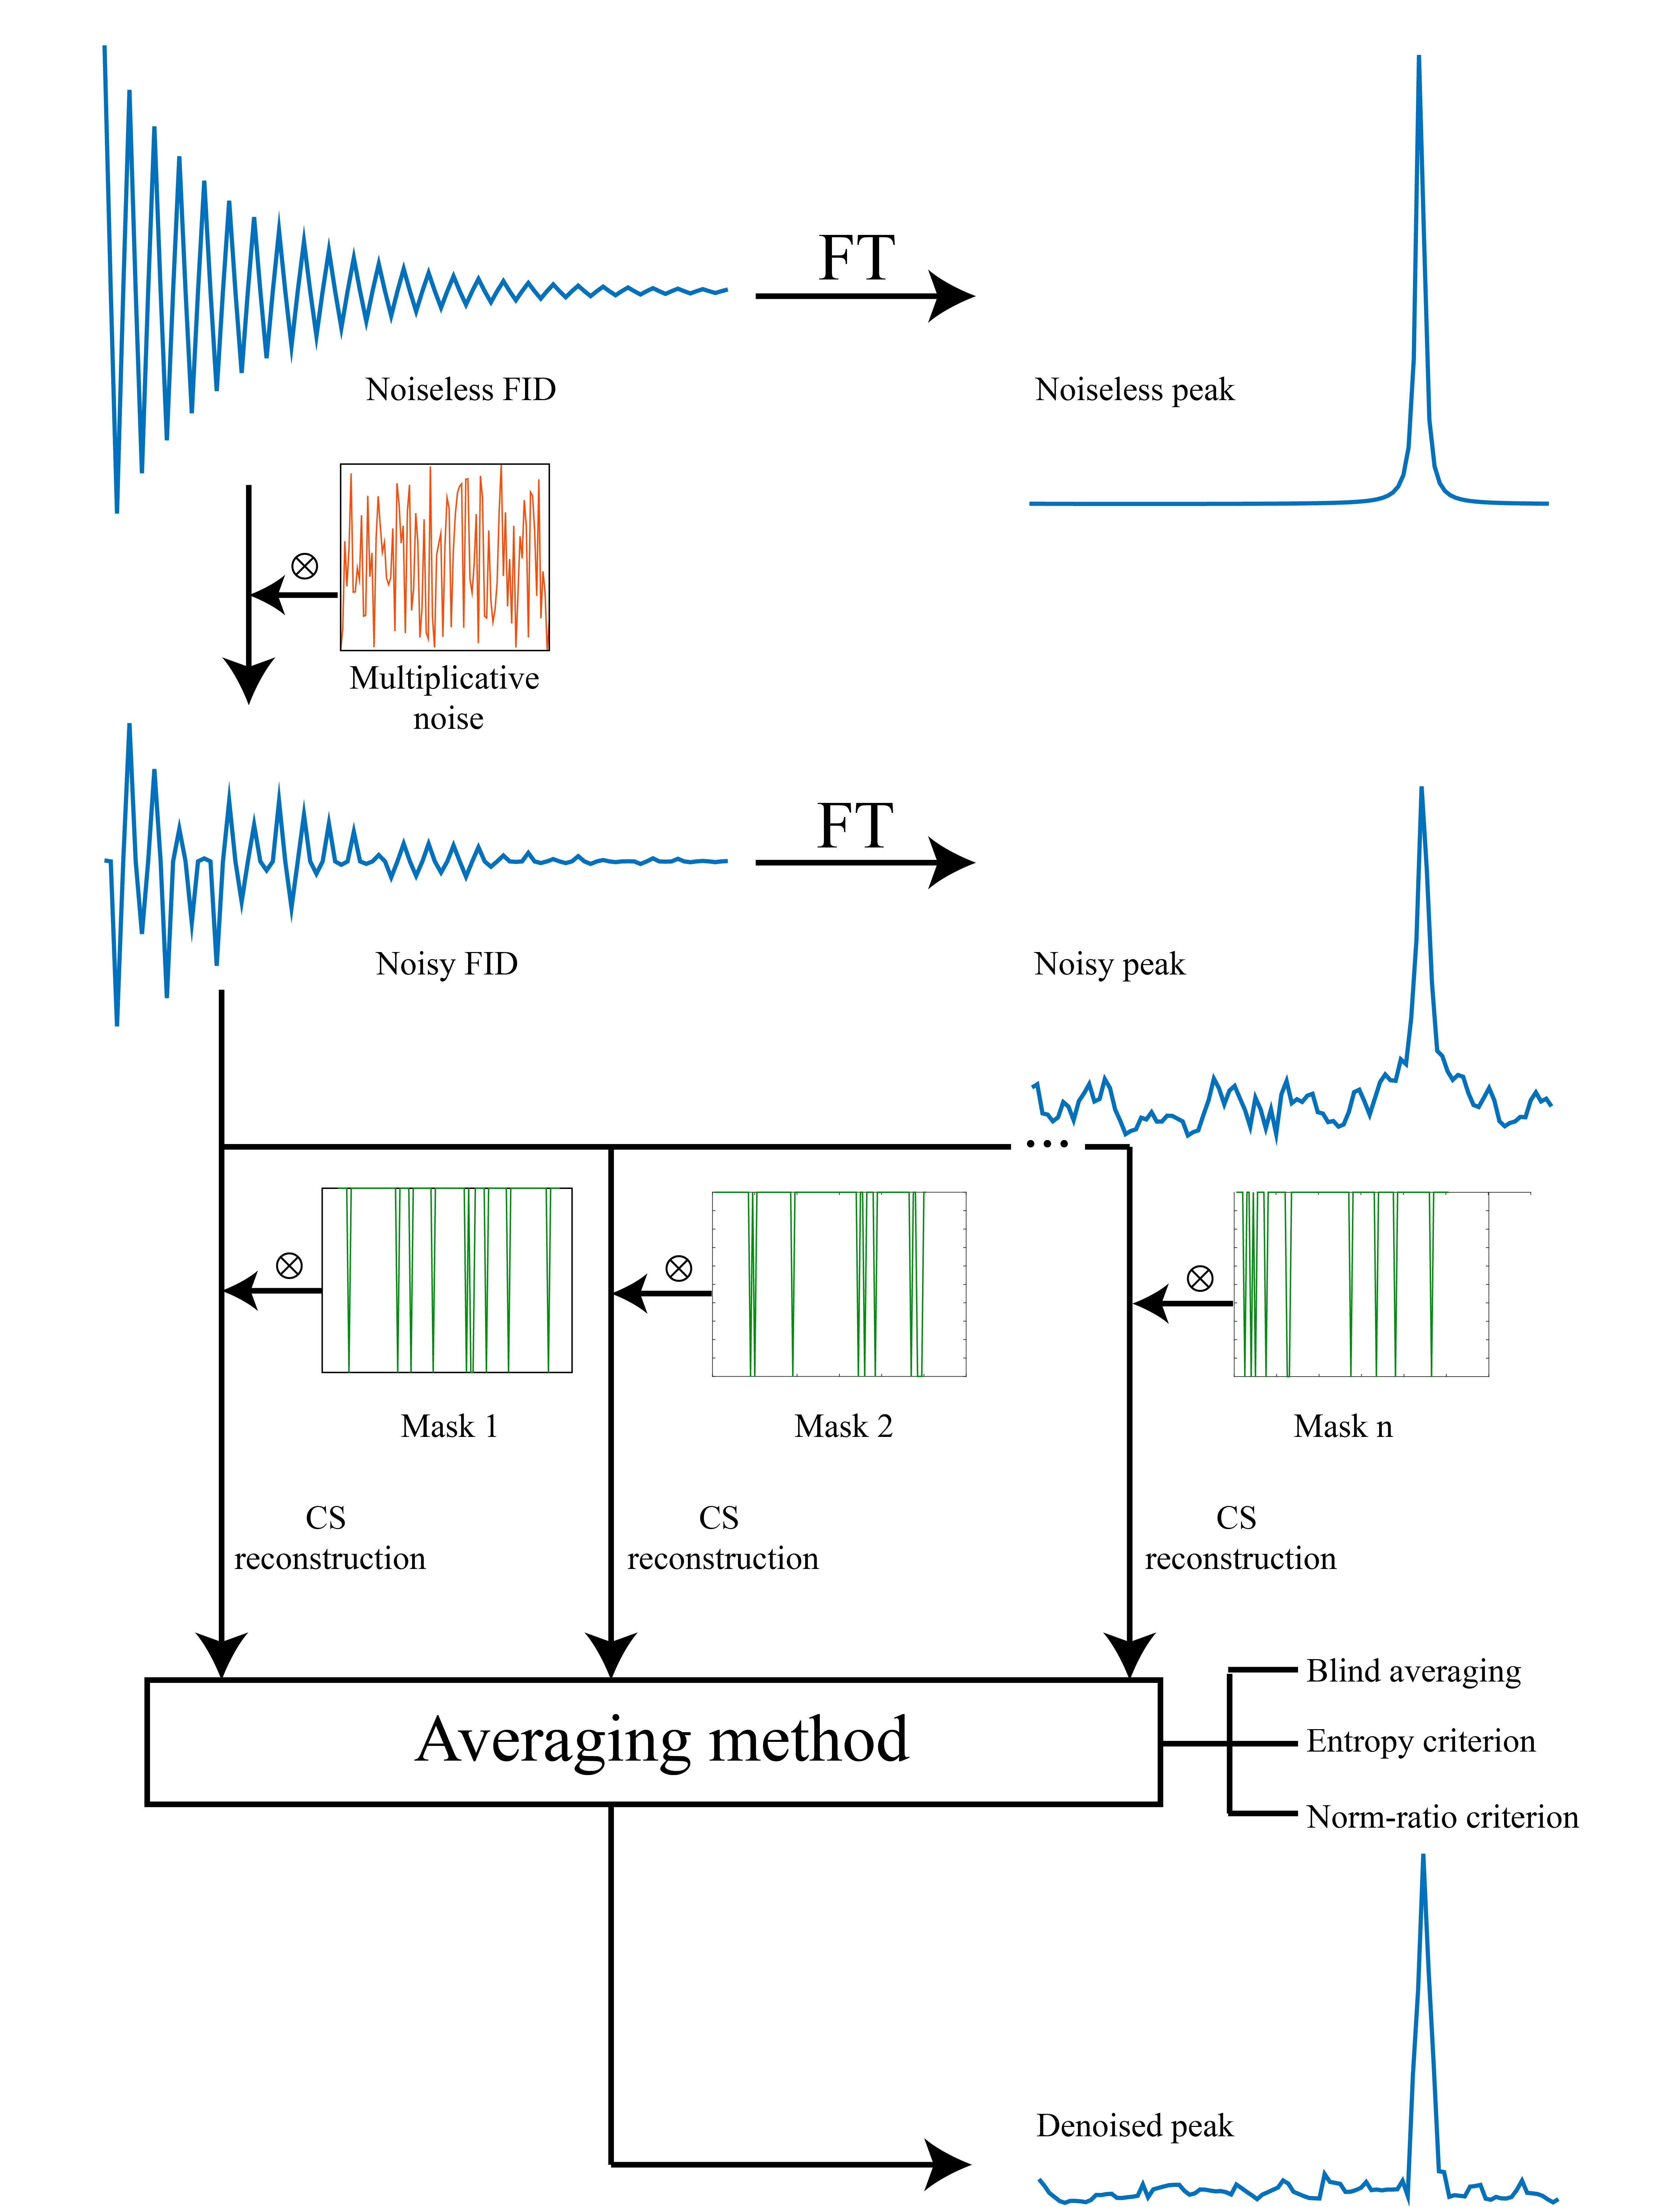
Demonstration of CoSeM’s basic idea for improving SNR by processing
multiple masked renditions. An ideal FID corresponding to a single peak
corrupted by multiplicative noise drawn normally from the interval [0, 0.2].
For this purpose, a portion of all points with the highest degree of corruption
are eliminated from the noisy FID by multiplication with a binary mask, and the
spectrum is reconstructed by using a total variation (TV)-regularized inverse
problem solver implemented in BART,13 using one of the averaging
methods shown.
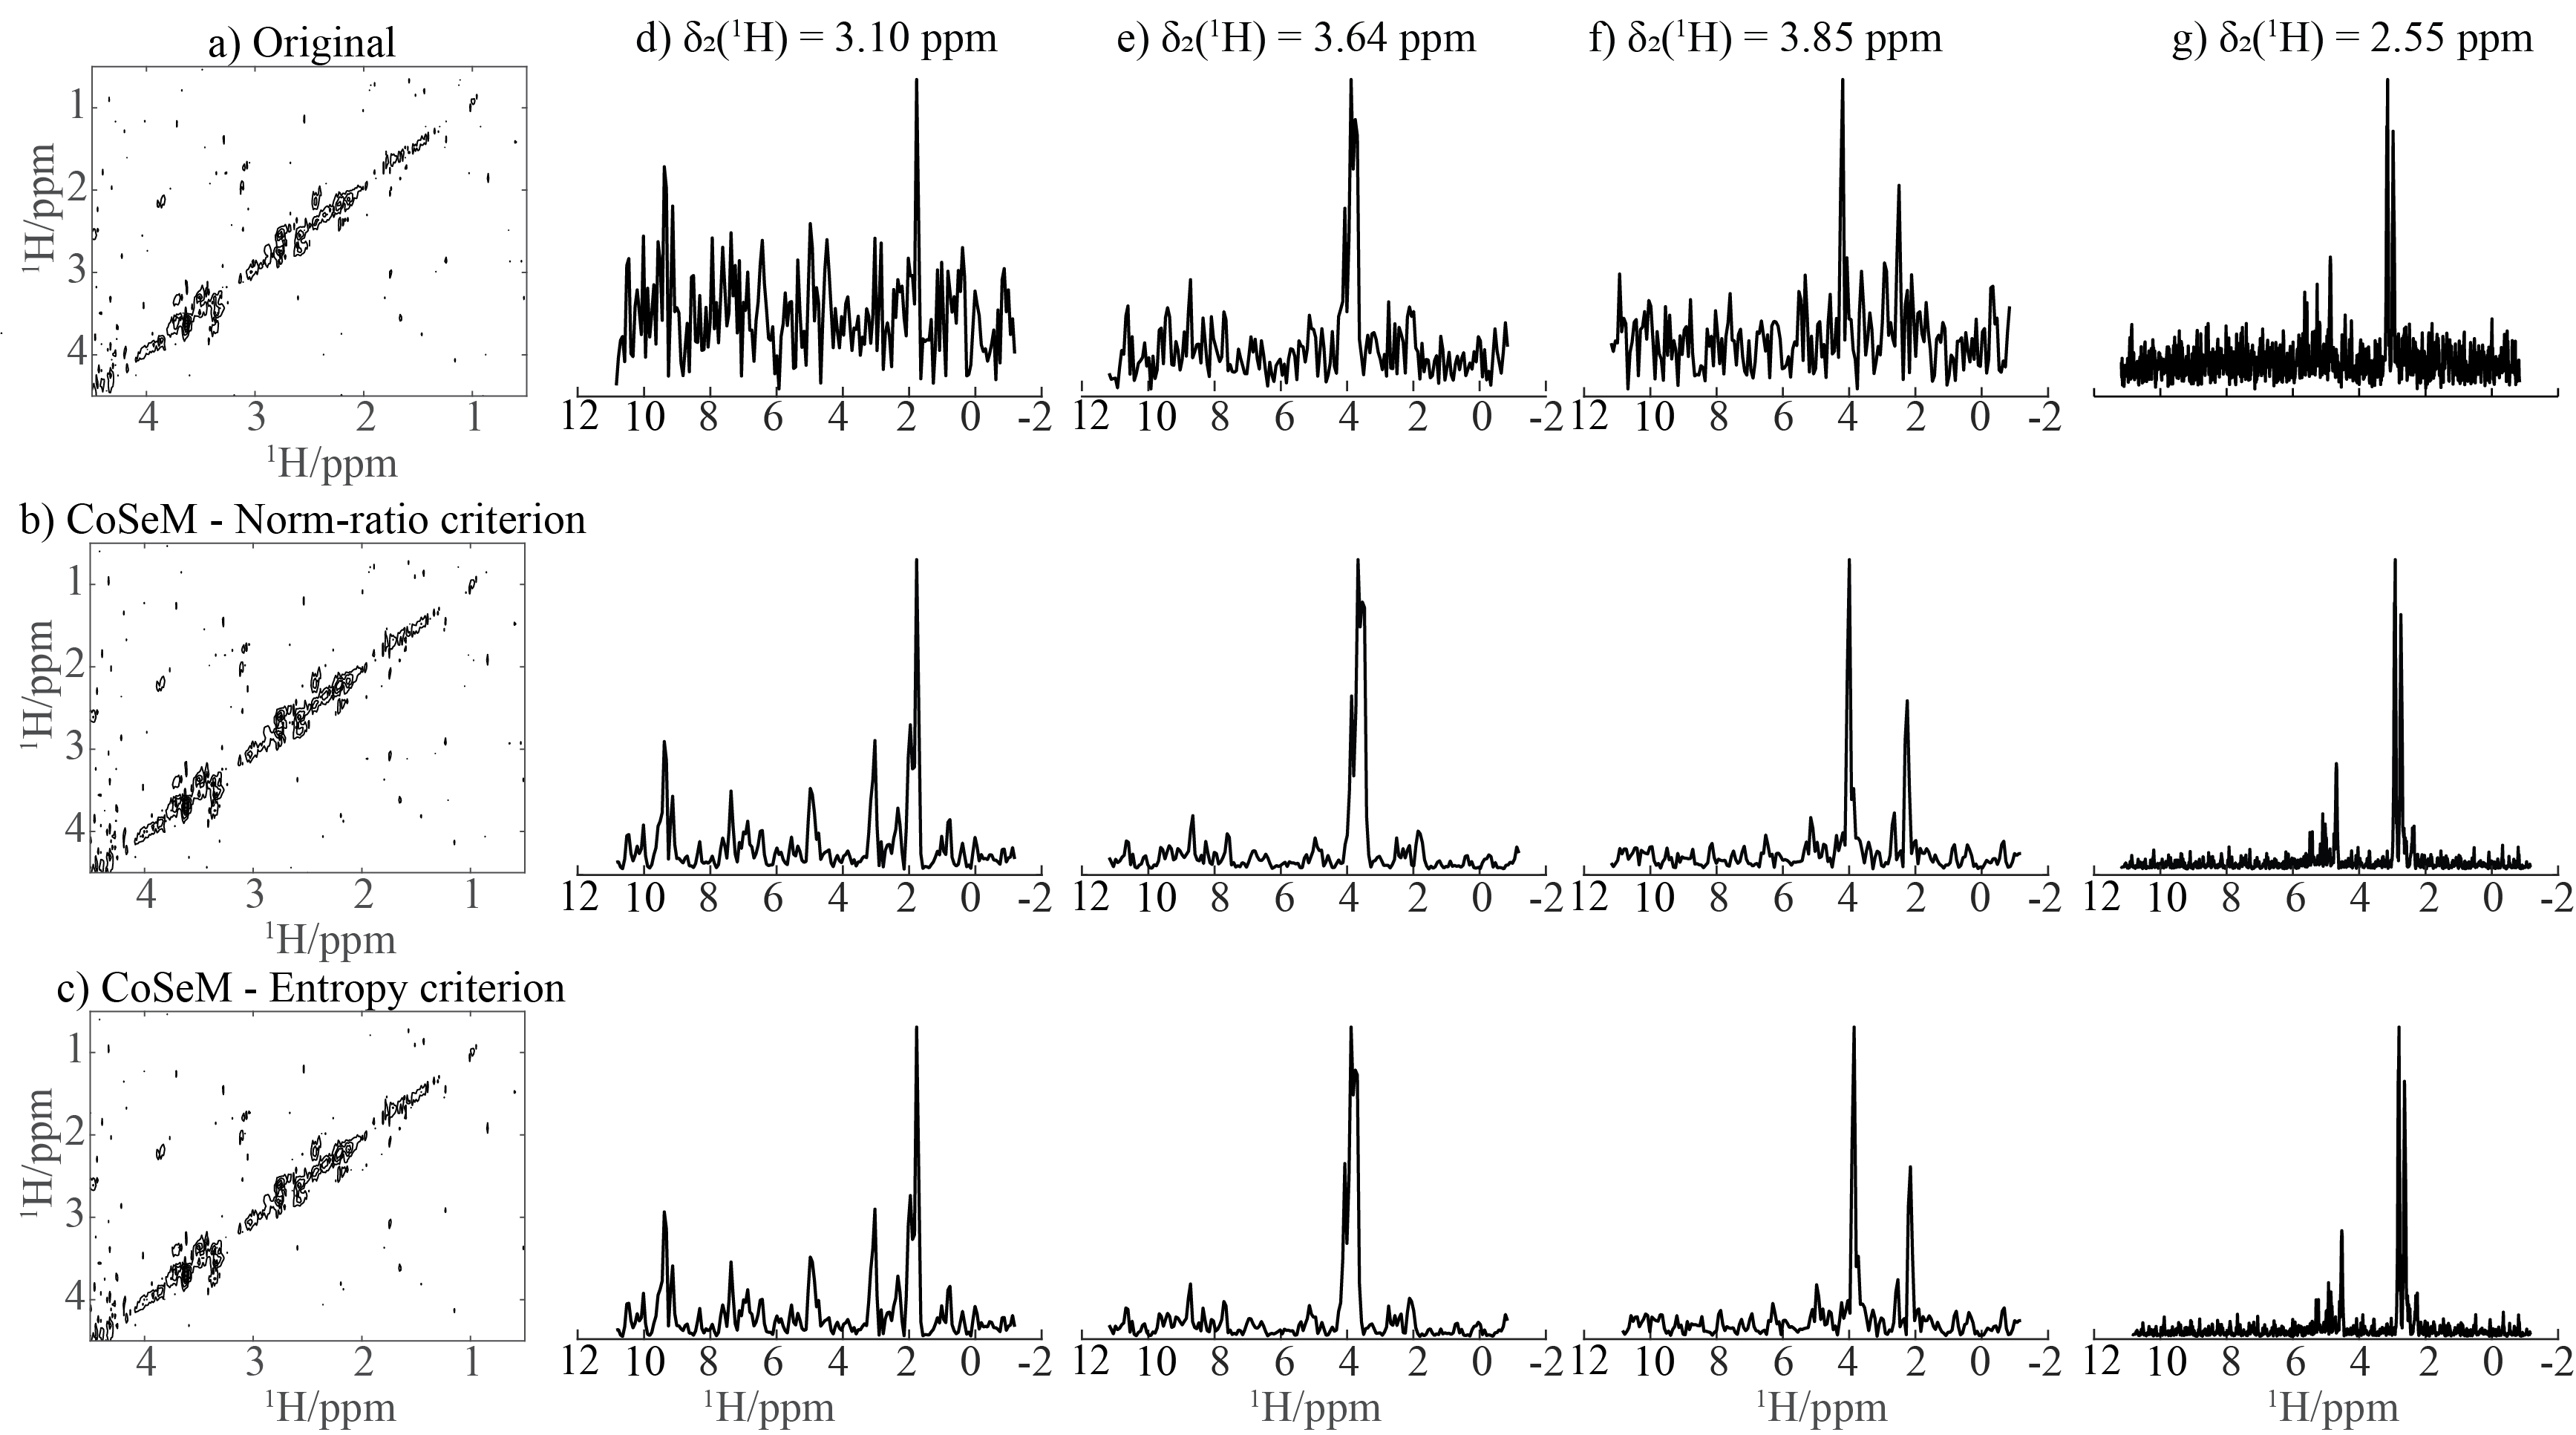
CoSeM denoising of an in vivo 1H
localized DQF-COSY spectrum (72 µl volume) acquired on a mouse brain at 15.2 T.
1024/192 points were acquired along the direct/indirect dimension, with 192 transients
Both norm-ratio and entropy-based
criteria are shown, with cross-sections extracted at the indicated shifts shown
in d-g). CoSeM processing took ~45 minutes for 4000 renditions, out of which
100 were chosen for selective averaging, with a regularization parameter of
0.4.
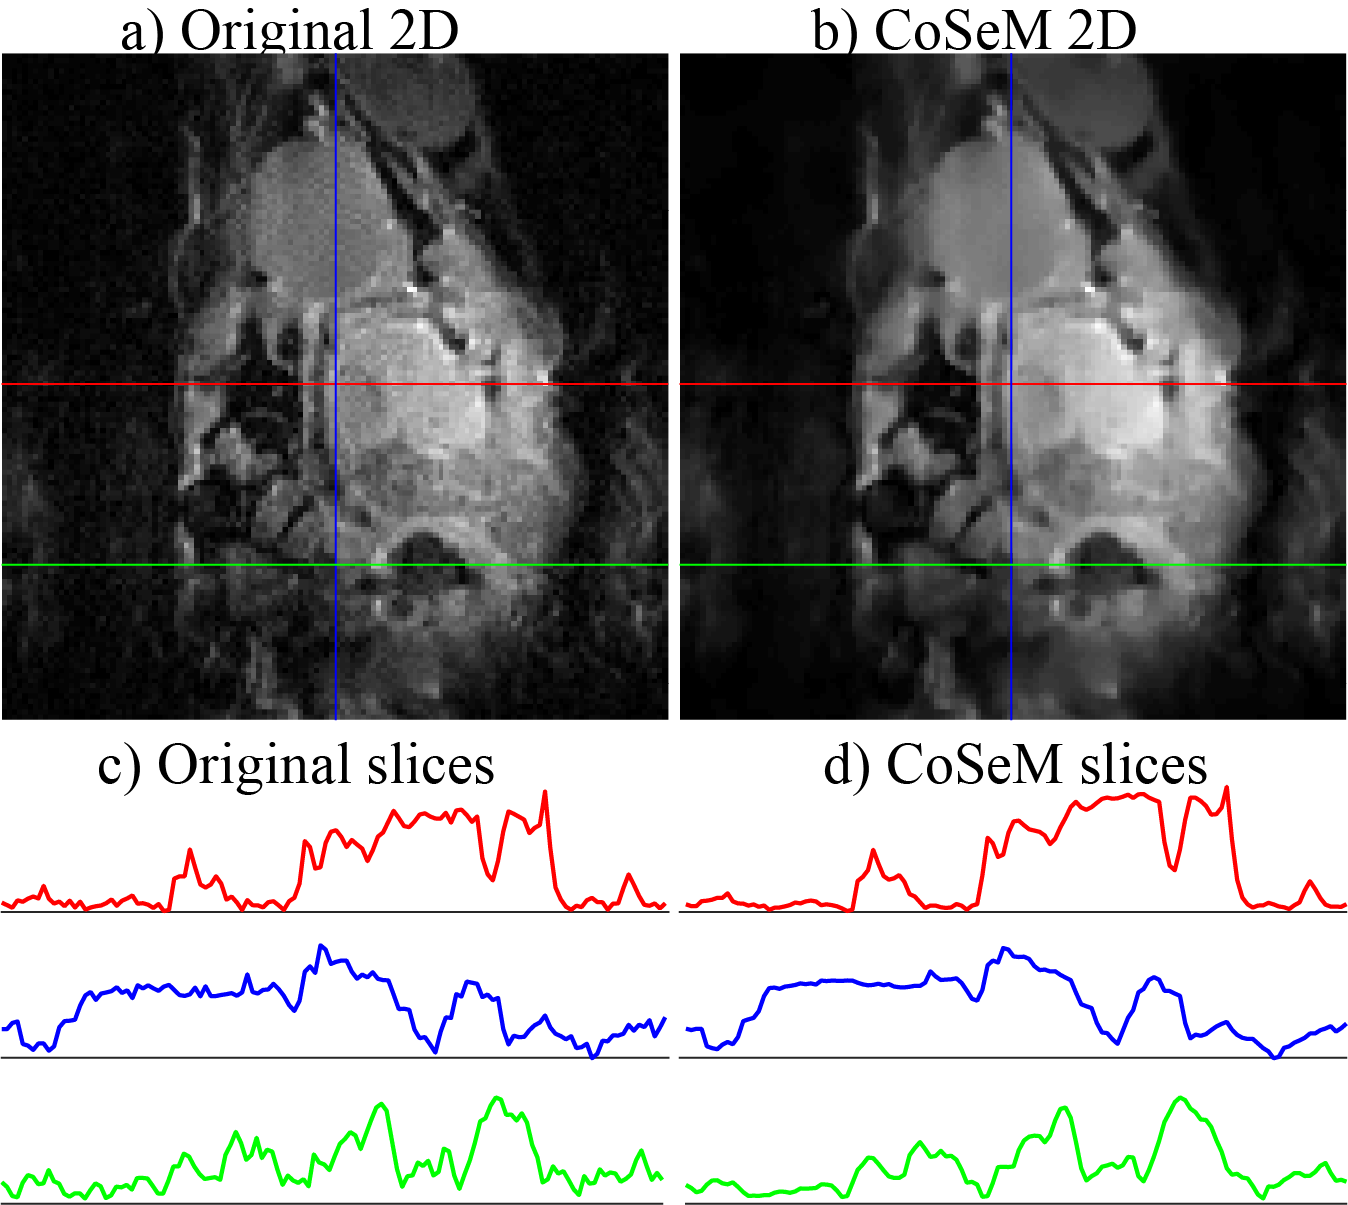
CoSeM denoising of a 2D 1H abdominal EPI image recorded in a
tumor-bearing mouse at 7T. 128 points were acquired along the direct and
indirect dimensions; FOV = 4x4 cm2; 4 interleaves; 8 averages; TE/TR
= 28.7ms/2s. Denoising was performed using 2000 CoSeM renditions, with a CS regularization
parameter λ = 0.05; images with the 200 the lowest ratios of l1 and
l2 norms were then coadded. (c, d) Slices extracted along the
color-coded lines. CoSeM processing took 7 minutes on a cluster.
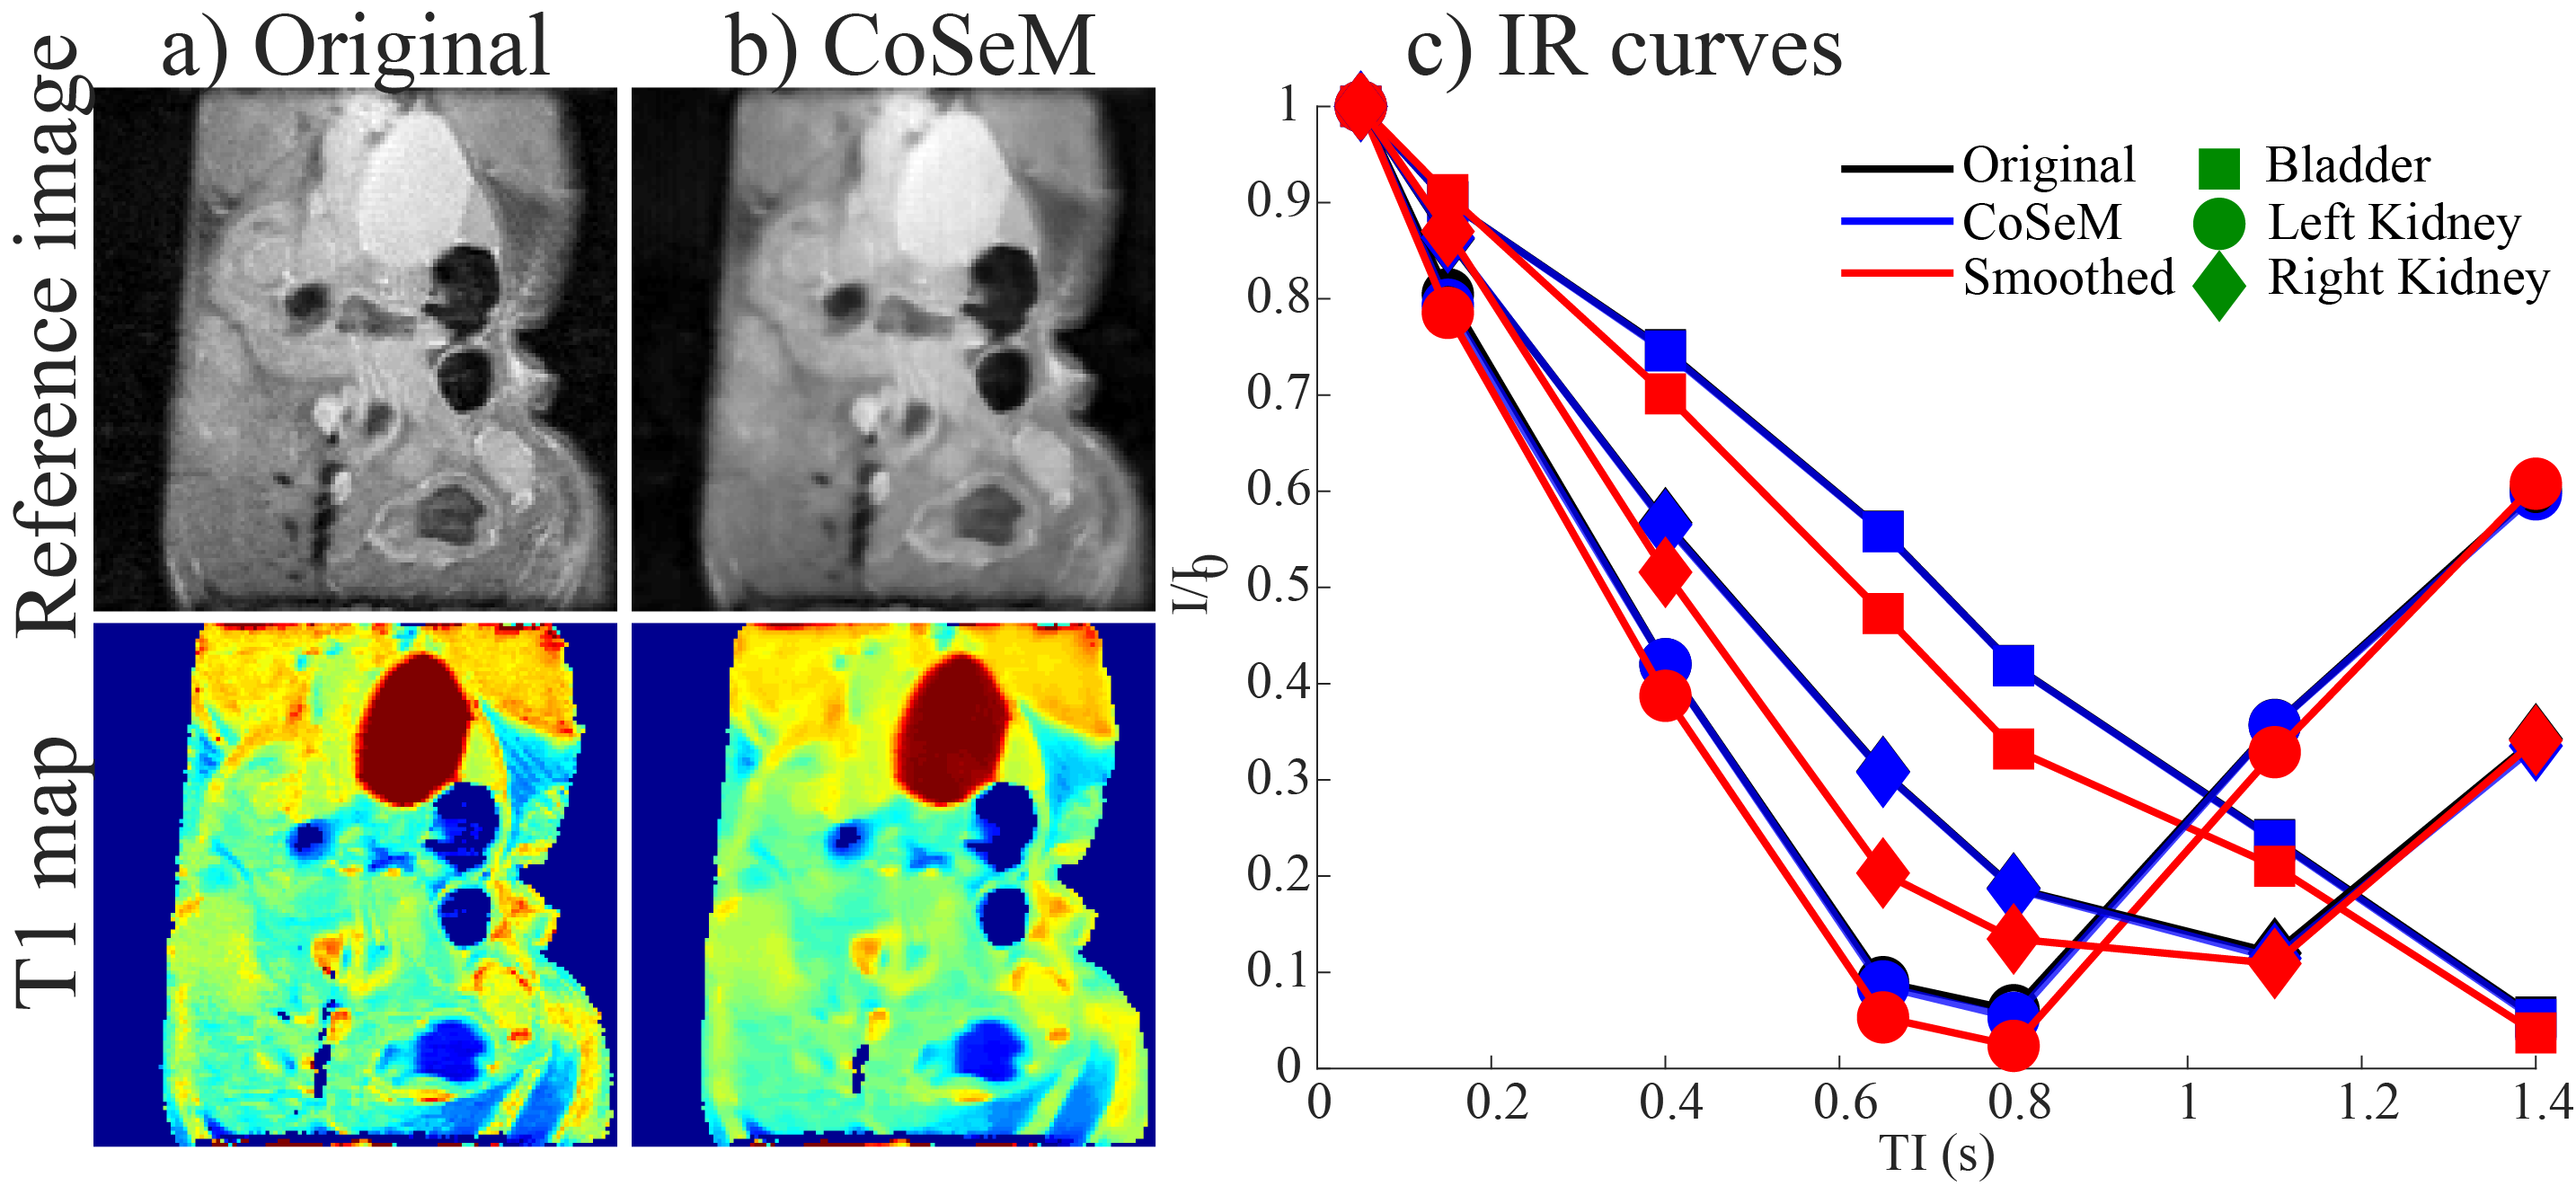
CoSeM denoising of 2D coronal 1H-RARE-detected Inversion
Recovery (FLAIR) data obtained in vivo for the abdomen of a pancreatic
tumor-bearing mouse at 7T. 128x128 points; FOV = 3.5x3.5 cm; 2 averages; RARE
factor = 8; TE/TR = 10ms/4s; IR times 0.05≤TI≤1.4s. CoSeM denoising was
performed using 2000 renditions, with a regularization parameter λ = 0.05, and
averaging the 200 lowest l1/l2-norm ratios. The intensities for different
regions vs TI are depicted in c).
DOI: https://doi.org/10.58530/2022/2903