2902
MP-PCA and Low-rank noise-reduction in 1H-FID-MRSI data in the rat brain at 14.1T1CIBM Center for Biomedical Imaging, Lausanne, Switzerland, 2Animal Imaging and Technology, EPFL, Lausanne, Switzerland, 3LIFMET, EPFL, Lausanne, Switzerland, 4Service de radiodiagnostic et radiologie interventionnelle, Lausanne University Hospital CHUV, Lausanne, Switzerland, 5Department of Radiology and Medical, Informatics, University of Geneva, Geneva, Switzerland
Synopsis
1H-MRSI is highly challenging and the constant appetite for higher spatial resolution leads to increased search for post-processing methods aiming to reduce the noise variance in 1H-MRSI. The aim of the present study was to implement and test the feasibility of two noise-reduction techniques on preclinical 14.1T fast 1H-FID-MRSI datasets: the MP-PCA based denoising and the low-rank TGV reconstruction. Our results are promising showing an enormous potential of the two noise-reduction techniques towards novel and fast MRSI developments. Further studies will be performed to evaluate if the “apparent” increase in spectral SNR translates in true lower uncertainty in metabolite concentrations.
Introduction
1H-MRSI is a powerful tool to non-invasively map metabolic profiles from multiple spatial positions simultaneously. Yet, the method is highly challenging mainly because of the low concentration of metabolites, low signal-to-noise ratio (SNR), long measurement times and advanced pulse sequences and processing methods that need to be implemented1,2. The constant appetite for higher spatial resolution leads to an increased search for post-processing methods that aim at reducing the noise variance in 1H-MRSI. Several denoising methods have been proposed3–7.Reconstruction methods based on different low-rank assumptions have been implemented mainly on clinical applications. These methods rely on the linear predictability, the partial separability of spatial-temporal modes or both to denoise MRSI data3–5. In addition, constraints on the spatial distribution of the signal with specific regularization has shown to enhance further the SNR in MRSI reconstruction6. In this approach, partial separability is combined with a total generalized variation (TGV) spatial regularization in a reconstruction model. TGV regularization aims to denoise metabolite distribution by penalizing first and second order spatial derivatives. It is known to preserve edges while avoiding stair-casing artifacts present in traditional first order total variation schemes.
In parallel, the Marchenko-Pastur principal component analysis (MP-PCA) based denoising has been implemented on diffusion MRI8, functional MRI9,10, DW-MRS11 data and was recently applied to preclinical 1H-MRSI data7. The MP-PCA technique exploits the fact that noise eigenvalues follow the universal Marchenko-Pastur distribution, a result of the random matrix theory. This method provides a data-driven approach to distinguish noise from the signal components.
The aim of the present study was to implement and test the feasibility of two noise-reduction techniques on preclinical 14.1T fast 1H-FID-MRSI datasets: the MP-PCA based denoising and the low-rank TGV reconstruction.
Methods
The 1H-MRSI data were acquired in the rat brain on a 14.1T MRI system (Bruker/Magnex Scientific) using a recently implemented single slice fast 1H-FID-MRSI sequence (TE=1.3ms, TR=813ms, 2mm slice thickness centred on the hippocampus, FOV=24x24mm2, matrix size=31x31, 1 average).The following preprocessing steps were followed prior to application of any of the denoising methods. The data was phase corrected based on the water signal and cleaned from lipid contamination using the metabolite-lipid orthogonality approach as described in6,12. The residual water signal from the metabolite spectra was removed using HLSVD.
The low-rank TGV reconstruction was applied as described in Klauser et.al6 to the full dataset (31x31 matrix). For the MP-PCA a sub-matrix of 12x13voxels centered in the MRSI slice was selected, resulting in 156 FIDs used in the further analysis. The complex-valued FIDs were split into real and imaginary parts and organized into a matrix X, where the first dimension contained the time-domain sampling (1024 points) and the second dimension the 156 spectra from the selected sub-matrix. Matrix X was denoised using the MP-PCA approach8.
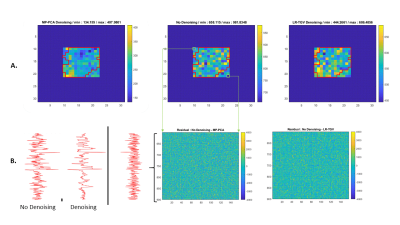
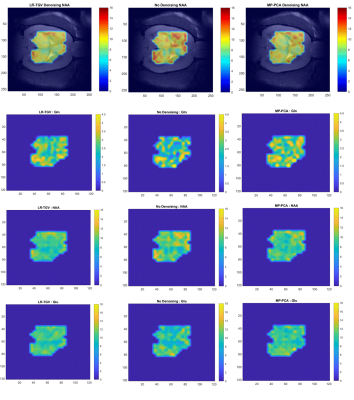
The resulting spectra: non-denoised, LR-TGV denoised and MP-PCA denoised were quantified with LCModel combined with a simulated basis set which matches the in vivo acquisition. The metabolite maps were created and overlaid to the corresponding MRI image using an in house written Matlab code. The metabolite map was shaped manually with respect to the SNR of the LCModel quantified spectra and the Cramer-Rao Lower bounds (CRLB) of the given metabolites. The effect of both denoising methods was evaluated by assessing the average SNR of the spectra, over the 12x13 voxels sub-matrix and by comparing the distribution of noise standard deviation (SD) and the residual difference distribution between denoised and non-denoised spectra on the same sub matrix. The noise SDs were calculated on 130 points of the spectrum in a signal free region before and after denoising, for both MP-PCA and LR-TGV denoising.
Results and Discussion
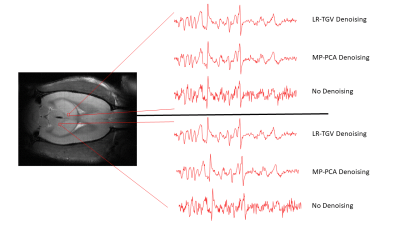
An averaged two-fold increase in SNR as quantified by LCModel was observed when using both noise-reduction approaches, without any visual impact on linewidths or other features of the spectra (Figure 1). Two important points should be considered when analyzing the SNR computed by LCModel: 1) the baseline estimate has an important contribution in the SNR calculations in addition to the residuals; and 2) the SNR measured from the residual baseline noise is insufficient given the presence of non-uniform variance5.Figure 2A shows the distribution of the noise SD in the 12x13 voxels sub-matrix and highlighting that both methods decrease the range of the noise SD. In addition, the difference in spectra between original and denoised matrix did not provide any visible structure on the residual map for any of the two investigated approaches (Figure 2B). Both noise-reduction techniques improved the metabolite quantification leading to smother metabolic maps while still preserving regional differences, particularly for spectra located at the edges of the brain (Figure 3).
We implemented and showed the potential of two noise-reduction techniques on preclinical 14.1T 1H-FID-MRSI datasets. The results are promising offering enormous potential towards novel and fast MRSI developments. Further studies will be performed to quantitatively assess the performance of both denoising techniques on 14.1T 1H-FID-MRSI data and to evaluate if the “apparent” increase in spectral SNR translates in true lower uncertainty in metabolite concentrations.
Acknowledgements
Financial support was provided by the Swiss National Science Foundation (Project No. 310030_173222; 310030_201218), by the European Union's Horizon 2020 research and innovation program under the Marie Sklodowska-Curie grant agreement No 813120 (INSPiRE-MED) and the Foundation Carigest SA. We acknowledge access to the facilities and expertise of the CIBM Center for Biomedical Imaging founded and supported by Lausanne University Hospital (CHUV), University of Lausanne (UNIL), Ecole polytechnique fédérale de Lausanne (EPFL), University of Geneva (UNIGE) and Geneva University Hospitals (HUG). The authors Brayan Alves and Dunja Simicic have contributed equally to this abstract. The authors Cristina Cudalbu and Antoine Klauser have contributed equally to this abstract.
References
1. Maudsley AA, Andronesi OC, Barker PB, et al. Advanced magnetic resonance spectroscopic neuroimaging: Experts’ consensus recommendations. NMR Biomed. 2021;34(5). doi:10.1002/nbm.4309
2. Bogner W, Otazo R, Henning A. Accelerated MR spectroscopic imaging—a review of current and emerging techniques. NMR Biomed. 2021;34(5). doi:10.1002/nbm.4314
3. Abdoli A, Stoyanova R, Maudsley AA. Denoising of MR spectroscopic imaging data using statistical selection of principal components. Magn Reson Mater Physics, Biol Med. 2016;29(6):811-822. doi:10.1007/s10334-016-0566-z
4. Nguyen HM, Peng X, Do MN, Liang ZP. Denoising MR spectroscopic imaging data with low-rank approximations. IEEE Trans Biomed Eng. Published online 2013. doi:10.1109/TBME.2012.2223466
5. Clarke WT, Chiew M. Uncertainty in denoising of MRSI using low‐rank methods. Magn Reson Med. 2021;21 Septemb. doi:10.1002/mrm.29018
6. Klauser A, Courvoisier S, Kasten J, et al. Fast high-resolution brain metabolite mapping on a clinical 3T MRI by accelerated 1H-FID-MRSI and low-rank constrained reconstruction. Magn Reson Med. 2019;81(5):2841-2857. doi:10.1002/mrm.27623
7. Simicic D, Phong LT, Heeswijk RB van, Jelescu IO, Cudalbu C. The impact of Marchenko-Pastur PCA denoising on high resolution MRSI in the rat brain at 9.4T. In: ISMRM. ; 2021.
8. Veraart J, Novikov DS, Christiaens D, Ades-aron B, Sijbers J, Fieremans E. Denoising of diffusion MRI using random matrix theory. Neuroimage. 2016;142:394–406. doi:10.1016/j.neuroimage.2016.08.016
9. Ades-Aron B, Lemberskiy G, Veraart J, et al. Improved Task-based Functional MRI Language Mapping in Patients with Brain Tumors through Marchenko-Pastur Principal Component Analysis Denoising. Radiology. 2021;298(2):365-373. doi:10.1148/radiol.2020200822
10. Diao Y, Yin T, Gruetter R, Jelescu IO. PIRACY: An Optimized Pipeline for Functional Connectivity Analysis in the Rat Brain. Front Neurosci. 2021;15. doi:10.3389/fnins.2021.602170
11. Jelescu I, Veraart J, Cudalbu C. MP-PCA denoising dramatically improves SNR in large-sized MRS data: an illustration in diffusion-weighted MRS. In: ISMRM. ; 2020.
12. Bilgic B, Gagoski B, Kok T, Adalsteinsson E. Lipid suppression in CSI with spatial priors and highly undersampled peripheral k-space. Magn Reson Med. 2013;69(6):1501-1511. doi:10.1002/mrm.24399
Figures

Figure 1. Denoised (via MP-PCA and LR-TGV) and non-denoised FID spectra for 2 voxels in the volume of interest. The spectra displayed ranges from 4.2 to 0.2 ppm.

