2901
Phosphorus MR Spectroscopy of Healthy Human Spleen1Department of Medical Physics, Uppsala University Hospital, Uppsala, Sweden, 2Philips Nordic, Stockholm, Sweden, 3Department of Surgical Sciences, Section of Radiology, Uppsala University Hospital, Uppsala, Sweden
Synopsis
Phosphorous spectra of healthy spleen are useful for studies of splenic malignancies and benign causes of splenomegaly. The main challenge is the relatively small size of the normal spleen and the large distance between human spleen and surface coil. The purpose of this study was to investigate whether it is possible to acquire phosphorous spectra of healthy spleen using single-voxel ISIS sequence on a 3T scanner. We demonstrate that the proposed spectroscopy of human spleen is feasible in a clinically acceptable acquisition time and that transmitter excitation profile and chemical shift displacement errors need to be taken into consideration
Introduction
Phosphorus MR spectroscopy (31P-MRS) detects and quantifies phosphorus-containing metabolites in biological tissues. Human 31P-MRS requires relatively large voxel sizes and longer measurement times because of lower sensitivity and in-vivo concentration of 31P atoms compared with protons. Therefore the majority of studies were performed with the large organs (brain, liver, muscles) where a larger volume of interest (VOI) can be chosen and the distance between 31P transmit-receive surface coil and VOI is relatively small. 31P-MRS of the normal spleen is challenging due to its relatively small volume and the larger distance between the spleen and surface coil. Phosphorous spectra of healthy spleen in situ are needed in studies of splenic malignancies, benign causes of splenomegaly as well as in the study of its physiology. There have been few reports of 31P spectra (1.5 T) of human spleen.1,2 The purpose of this work was to investigate the feasibility of localized 31P-MRS of healthy spleen in-situ in a clinically acceptable measurement time using a clinical 3T MR scanner.Methods
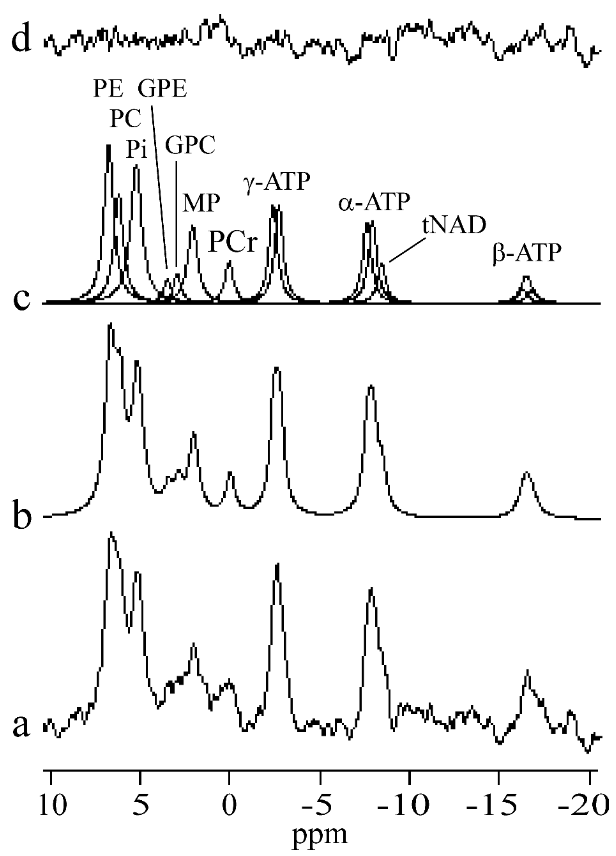
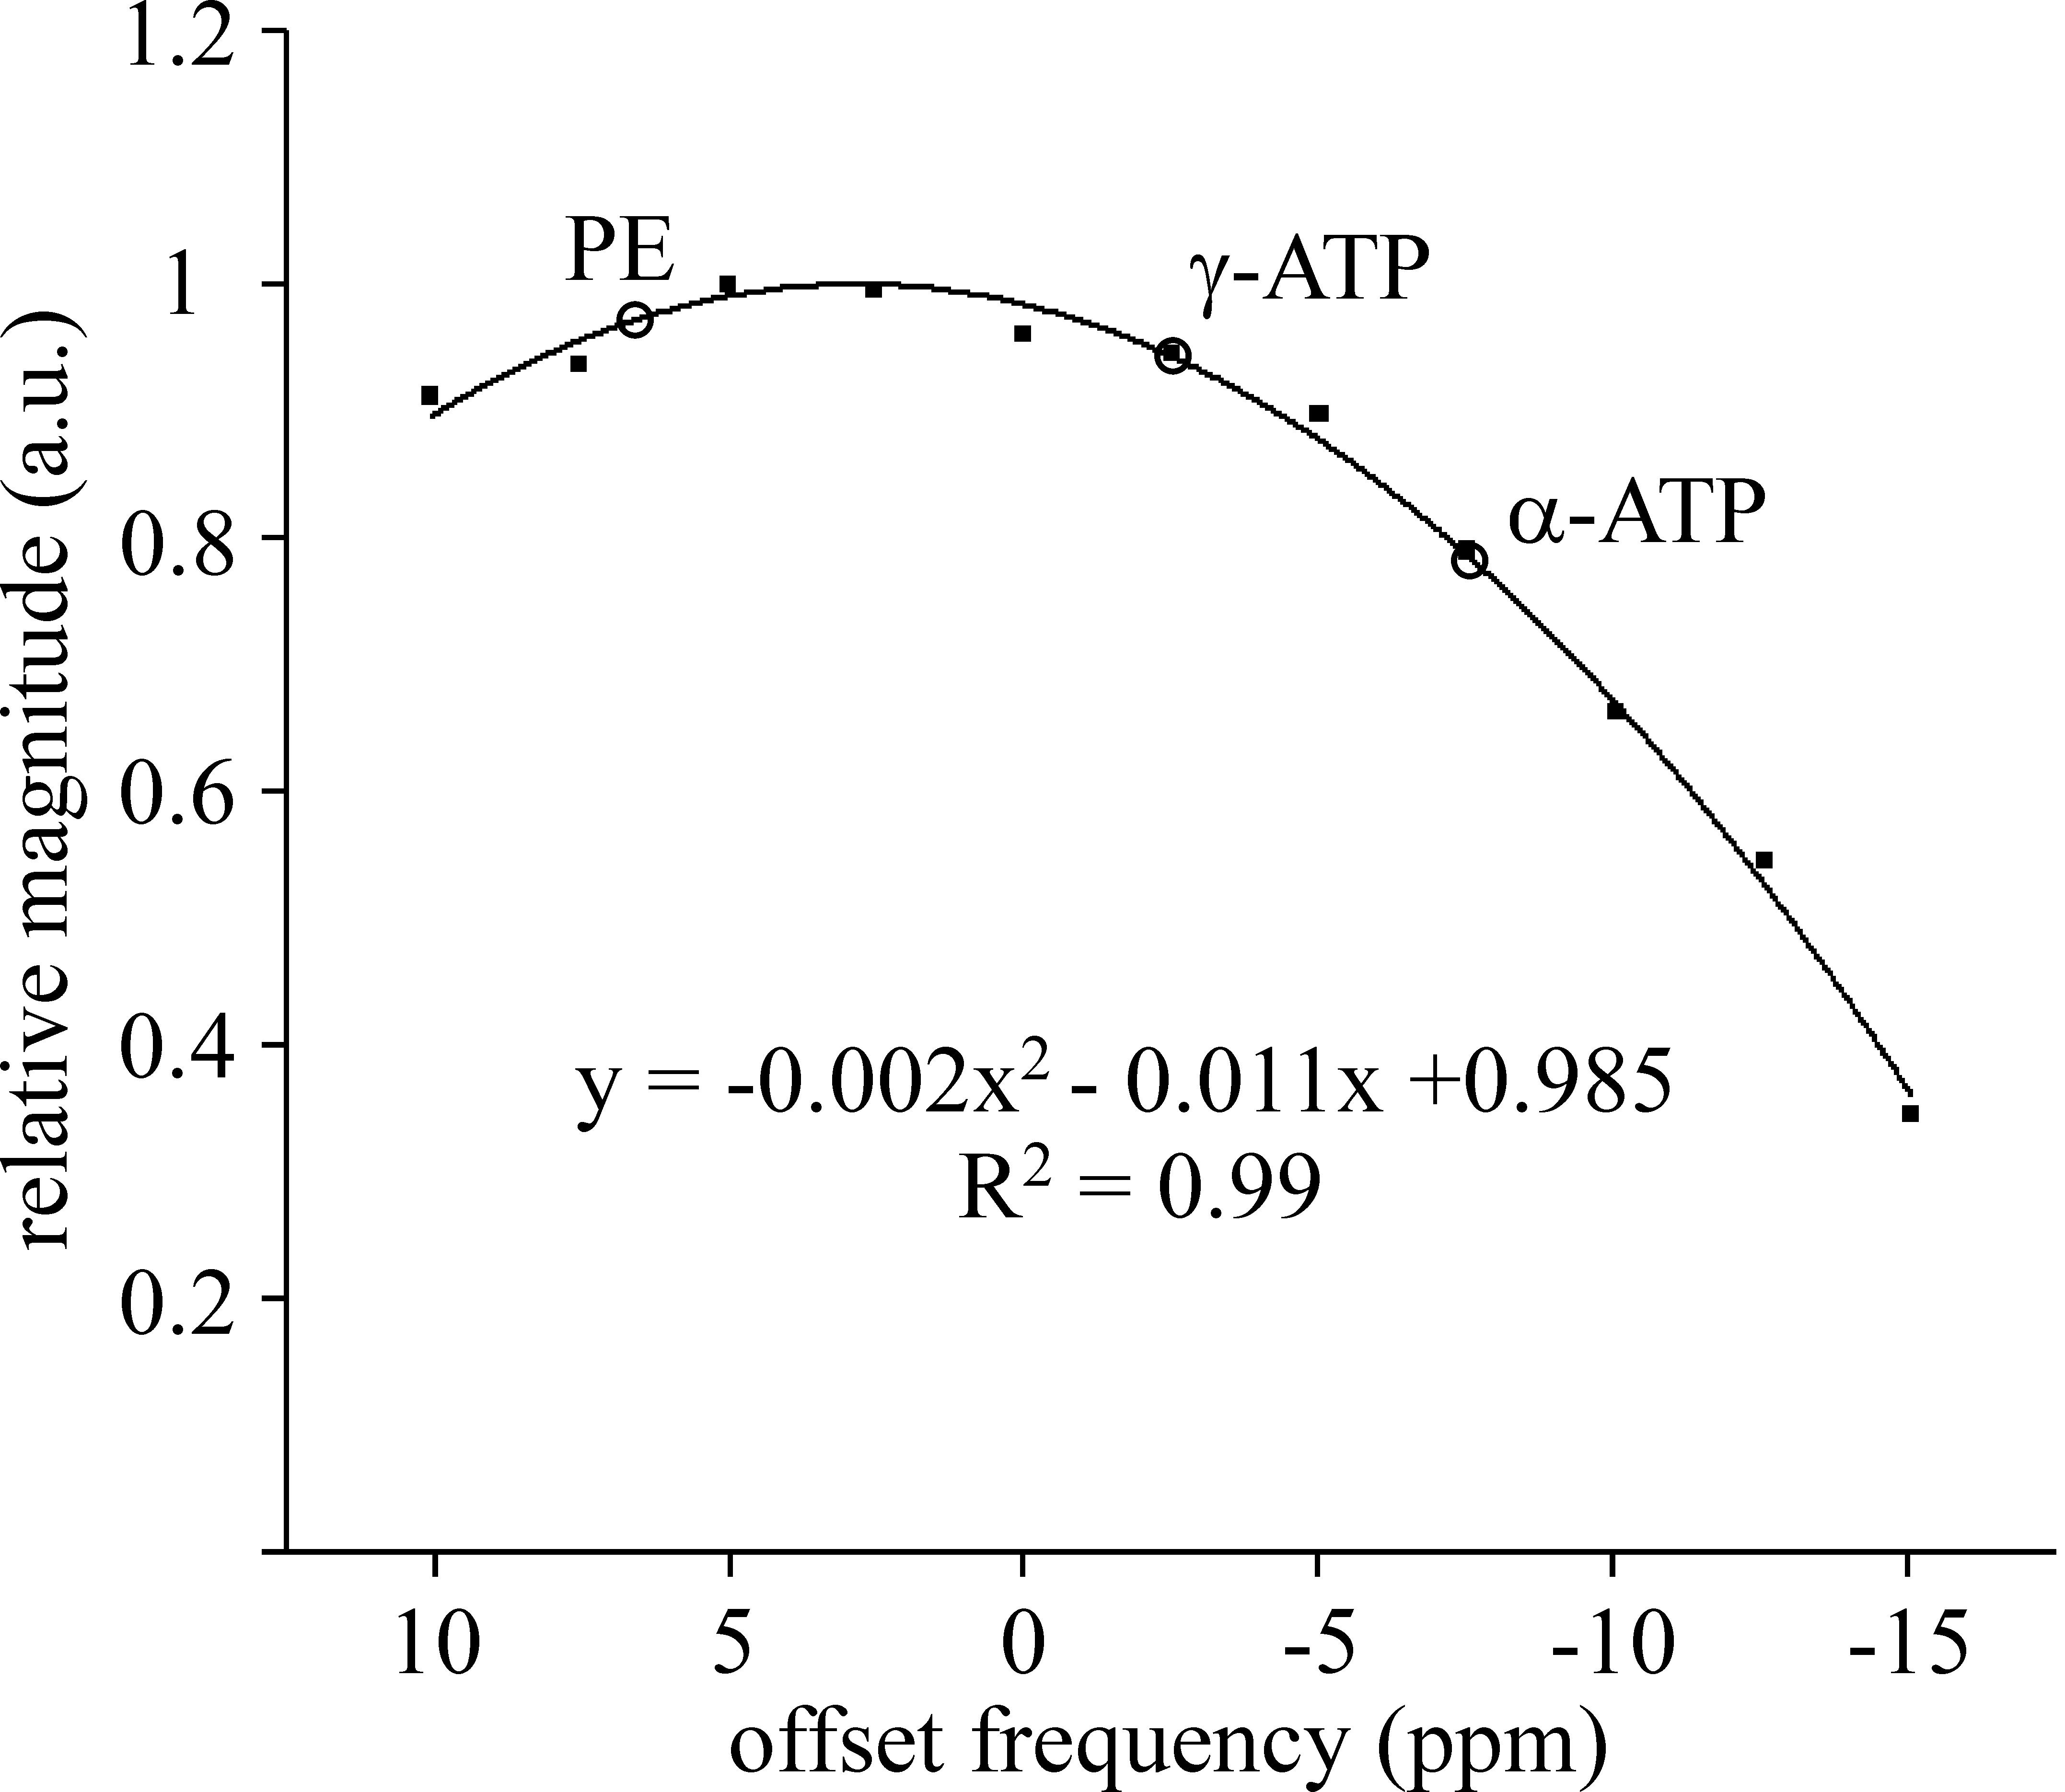
31P spectra of five healthy volunteers (3 male, 2 female) were acquired on a 3T MR scanner (Achieva, Philips Healthcare) using a circular transmit-receive coil (Φ=140 mm) with manual tuning. Voxel was selected by the ISIS localization sequence completed by broad-band proton decoupling and nuclear Overhauser effect (NOE) enhancement. Measurement parameters were TR 5000 ms, 512 scans, spectral bandwidth 3000 Hz, 2048 complex points, net acquisition time 43 min. Magnetic field homogeneity was improved by the pencil beam second order shimming. The whole body coil was used for imaging, decoupling and NOE. Spectrum processing was performed using the AMARES/MRUI algorithm3 without previous apodization of the FID. However, an exponential apodization corresponding to 8 Hz line broadening was applied for illustrations. The frequency axis was defined by placing the γ-ATP doublet to -2.53 ppm.4 Position of phosphorylethanolamine (PE), inorganic phosphate (Pi), γ-, α-, and β-adenosine triphosphate (ATP) were estimated by AMARES. Position of the phosphorylcholine (PC) was fixed to -27.92 Hz in respect to PE. Soft constraints ±0.05 ppm were applied to the positions of glycerophosphoethanolamine (GPE) at 3.5 ppm, glycerophosphocholine (GPC, 2.9 ppm), membrane phospholipids (MP, 2.07 ppm), phosphocreatine (PCr, 0 ppm), and total nicotinamide adenine dinucleotide (tNAD, -8.4 ppm). The splitting of ATP multiplets was fixed to 16 Hz.4,5 The amplitude ratios of doublets and triplets were fixed to 1:1 and 1:2:1, respectively. The linewidths of PE and MP were constrained to the interval 10-25 Hz and Pi to 20-40 Hz. The zero- and first-order phase corrections were estimated by AMARES. The first-order correction was constrained to ±0.5 ms in the time domain. The spectra of all volunteers were phase and frequency corrected and added together. The transmitter excitation profile was measured using the phantom by measuring PCr signal intensity vs. transmitter carrier frequency.Results
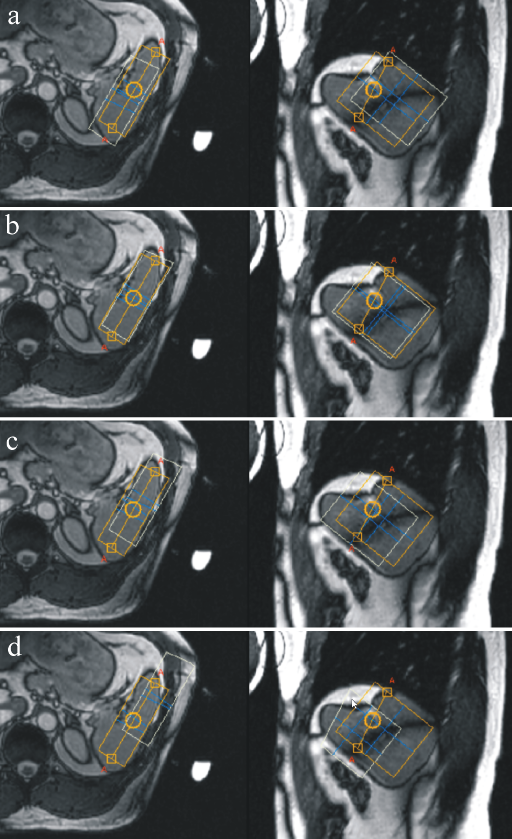
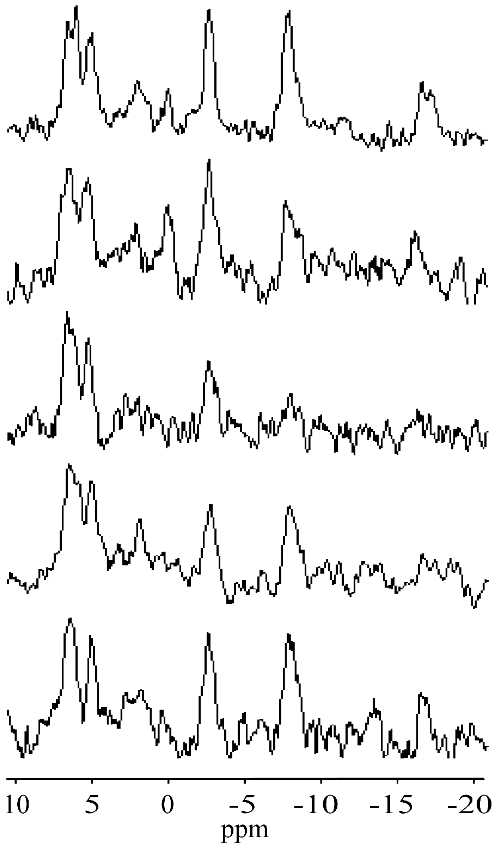
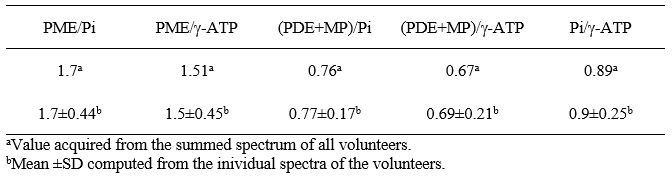
Average voxel volume was 128.6±40.7 cm3 (range: 105-210 cm3). Mean distance between the voxel centre and the surface coil was 57.4±3.6 mm (range: 52-62 mm). Water linewidth after shimming was 37±7 Hz (range: 30-45Hz). A typical voxel position is shown in Fig.1. Individual spectra, summed spectrum of all volunteers and fitting results are shown in Fig.2 and 3, respectively. Figure 4 depicts transmitter excitation profile for distance 60 mm between the voxel center and surface coil. The spectral intensity ratios of phosphomonoesters (PME=PE+PC), Pi, MP+phosphodiesters (PDE=GPE+GPC), and γ-ATP are shown in Tab.1. Results were corrected for transmitter excitation profile.6 MP+PDE intensities were added because fits of small PDE spectral lines were less reliable.Discussion
To the best of our knowledge, this is the first 3T 31P-MRS study of the healthy human spleen in situ. SNR and spectral resolution of our spectra were influenced by respiratory movement, smaller voxel size and the relatively large distance between the spleen and surface coil. Main limitation of our single voxel ISIS sequence is the fact that the hyperbolic-secant inversion and the detection B1 pulses have limited bandwidths and their respective amplitudes drop rapidly with distance from the surface coil. The consequences are large chemical shift displacement errors (CSDE) (Fig.1) and the excitation profile (Fig.4) dependence on distance between surface coil and the voxel. However, it was possible to minimize the influence of CSDEs in the most important region between PE and γ-ATP spectra lines. Therefore, only these intensities were used for quantitative evaluations (Tab.1). Partial volume effect caused by CSDE decreased α- and especially β-ATP intensities. It should be noted the CSDE will be less important in patients with splenomegaly.1 Previous spectra of healthy spleen were acquired at 1.5T using 1D and 3D MRSI sequences.1,2 While 3D MRSI spectrum2 agrees well with our results, differences with the 1D MRSI spectrum1 were more pronounced. These spectra have poor spectral resolution, increased Pi and PDE lines, and signal was more contaminated from the skeletal muscle.Conclusion
This study has shown that the localized 31P-MRS of spleen in-situ using single-voxel ISIS is feasible on 3T scanners in a clinically acceptable acquisition time. Results should be corrected for transmitter excitation profile and CSDEs need to be taken in account in placement of the volume of interests.Acknowledgements
No acknowledgement found.References
1. Smith SR, Martin PA, Davies JM, et al. Characterization of the Spleen by in vivo Image Guided 31P Magnetic Resonance Spectroscopy. NMR Biomed. 1989;2(4):172-178.
2. Arias-Mendoza F, Berardocco F, Li CW, et al. Differential 31P Spectral Patterns of Human Spleen in Health and Disease Using 3D-Localized 1H-Decoupled 31P MR Spectroscopy. ISMRM 1999; p.118.
3. Naressi A, Couturier C, Devos JM, et al. Java-based graphical user interface for the MRUI quantitation package. Magn Reson Mater Phys Biol Med. 2001;12:141-152.
4. Deelchand DK, Nguyen T, Zhu X, et al. Quantification of in vivo 31P NMR brain spectra using LCModel. NMR Biomed. 2015;28:633-641.
5. Jung WI, Staubert A, Widmaier S, et al. Phosphorus J-Coupling Constants of ATP in Human Brain. Magn Reson Med. 1997;37:802-804.
6. Ren J, Sherry AD, Malloy CR. 31P-MRS of healthy human brain: ATP synthesis, metabolite concentrations, pH, and T1 relaxation times. NMR Biomed. 2015;1455-1462.
Figures