2900
Improving SNR in deuterium metabolic imaging: A comparison of methods1Weizmann Institute of Science, Rehovot, Israel, 2Chinese Academy of Sciences, Wuhan, China
Synopsis
Deuterium metabolic imaging (DMI) is a promising approach to study tumor metabolism. Still, DMI’s signal-to-noise ratio (SNR) is limited because of 2H’s low Larmor frequency, coupled to the low concentrations of DMI’s targets. We recently proposed a multi-echo balanced steady-state free precession (ME-bSSFP) method increasing DMI’s SNR, but still find it lacking in some aspects. This work assesses simple apodization, Compressed Sensing Multiplicative (CoSeM) and Block-matching/3D filtering (BM3D) denoising methods for improving DMI’s results. The ability of the latter denoising methods to enhance sensitivity without blurring resolution, is evidenced by pancreatic cancer studies carried at 15.2T.
Introduction
DMI is a promising tool for tumor prognosis and diagnosis, based on the injection of deuterated precursors.1,2 [6,6’-2H2]-glucose for instance is uptaken by tumors, leading to tge formation of [3,3’-2H2]-lactate.3,4 [2H]-water (HDO) is also formed as per other pathways. Chemical shift imaging (CSI) can be used to spectrally-resolve these species, thereby assessing their uptake and kinetics. CSI’s SNR, however, is limited by 2H’s low gyromagnetic ratio – ca. 6.5 times that of 1Hs. Short T1s partly compensate for this; yet low concentrations compound back the problem. We have recently demonstrated that ME-bSSFP increases DMI’s SNR ca. 3x over CSI.4 Important metabolic aspects such as glucose’s rim uptake effects and lactate in small tumors/metastases, however, are still in the limit of what ME-bSSFP can detect. Further improvements in image quality could arise from denoising methods5 The present work assesses a widely-used denoising method, BM3D6; in addition, we explore CoSeM, a method developed by us which removes instability-related multiplicative noise.7 The outcomes of these methods are also evaluated against simple apodization.Methods
All experiments were approved by the Weizmann Institute IACUC. C57 black mice were implanted with KPC rodent pancreatic ductal adenocarcinoma (PDAC).8 For the DMI, ~4 g/kg body weight of [6,6’-2H2]-glucose in PBS were injected via a tail-vein line, and 2H spectroscopic images were acquired on a 15.2T Bruker scanner, using surface coils tuned to 650 MHz (1H) and 100 MHz (2H). A 2D ME-bSSFP sequence was optimized for the analyses as follows: TR =11.48 ms, five TEs with 2.1 ms echo spacings, 60° flip angle excitations, ~6 min signal averaging per image, 32x32 matrix sizes, field-of-view FOV = 40x40mm, ≈10 mm slices accommodating the full tumors’ thicknesses. Accompanying 1H coronal images were collected using TurboRARE: 10 slices, 0.8 mm slice thickness, 0.2 mm slice gaps, same FOVs as ME-bSSFP, 512x512 encoding matrix. 1H B0 maps were obtained by 3D double gradient echo, with same FOVs as for ME-bSSFP and 64x64x8 encoding matrices. ME-bSSFP data were reconstructed using 2D FT after zero-filling each echo to 64x64; images arising from these separated echoes were processed using IDEAL,4,9 to isolate images for the individual chemical shifts. The 1H-based magnetic field maps were used as initial guesses for IDEAL’s magnetic field, in order to avoid “swaps” otherwise observed upon processing.10 Isolated chemical shifts images were then subject to BM3D (magnitude images) and CoSeM (complex images) algorithms –or to apodization– for denoising. To translate the intensities into metabolic concentrations, 2H’s natural abundance (~10 mM concentration prior to injection in liquid-containing spaces), together with ME-bSSFP’s signal attenuations as expected from the scanning parameters and the T1/T2 for each species,3 were used.For BM3D, a pseudorandom noise kernel known (the Dirac delta; 'gw' in the script) was used, resulting in white uncorrelated noise.6 The inputs to this algorithm were the magnitude images, and a noise variance = 0.02. As for CoSeM: this method quantifies and discards phase-encoded scans that may have been strongly influenced by multiplicative noise; the fact that data are missing is then overcome by relying on compressed sensing reconstructions, thereby attenuating/suppressing multiplicative noise and delivering images with increased SNR. The inputs for CoSeM were the complex images, 2000 renditions, lambda = 0.4, threshold = 0.05. Apodization involved a 5mm FWHH Gaussian smoothing.
Results & Discussion
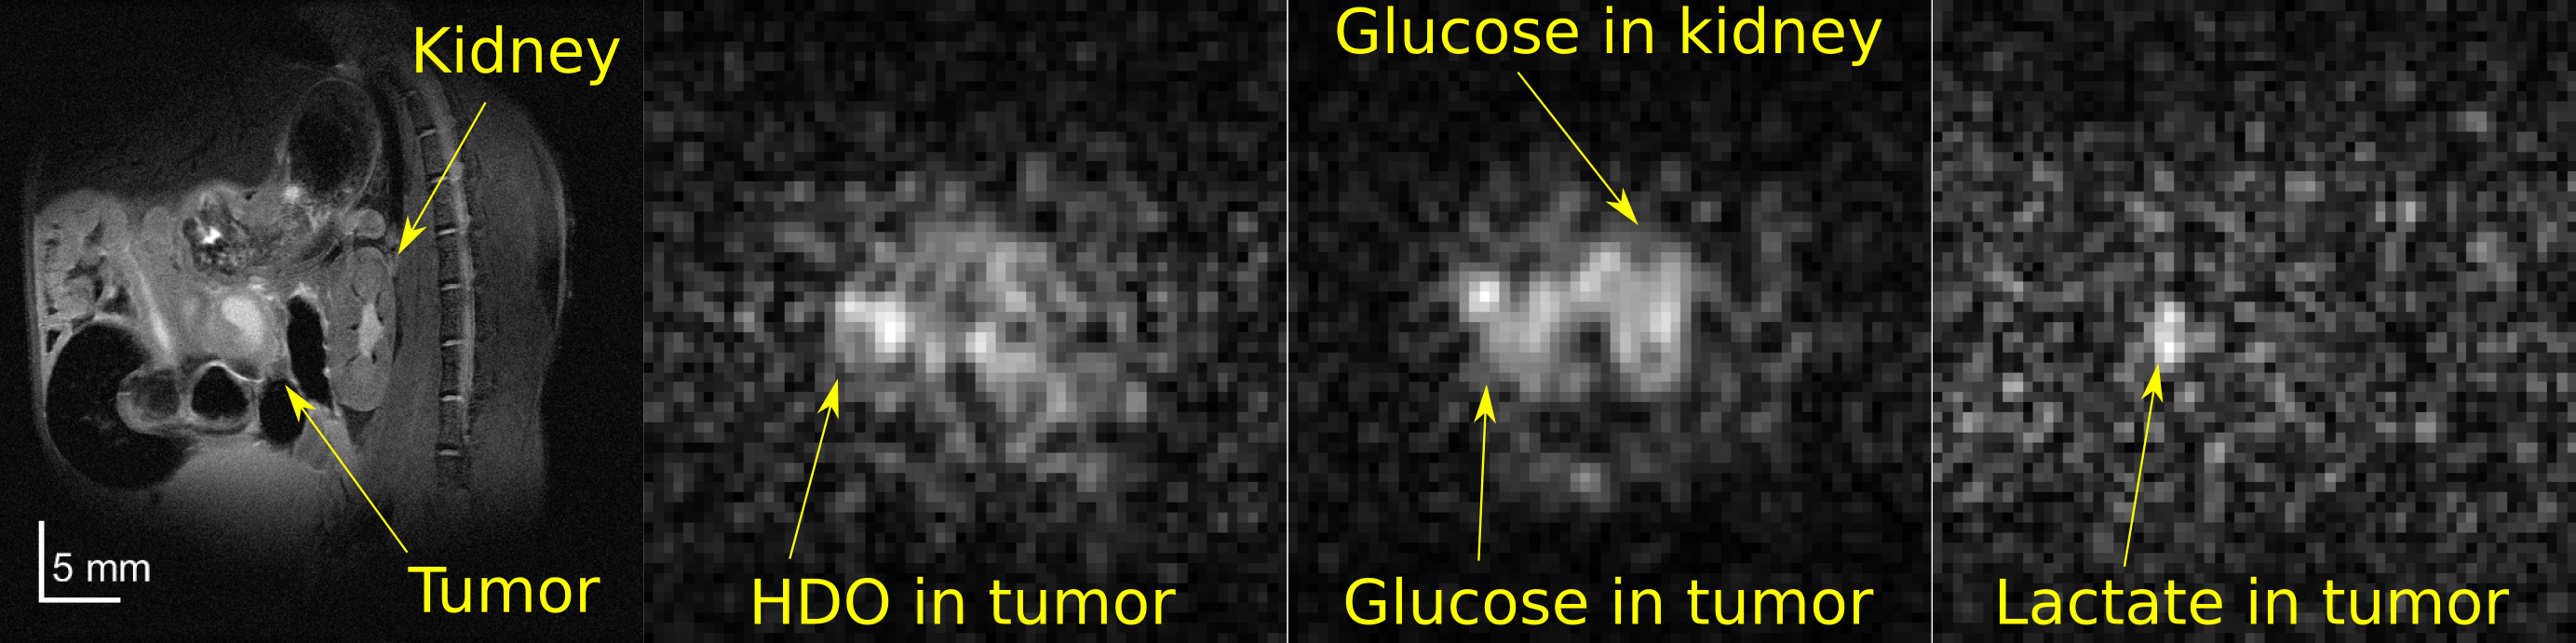
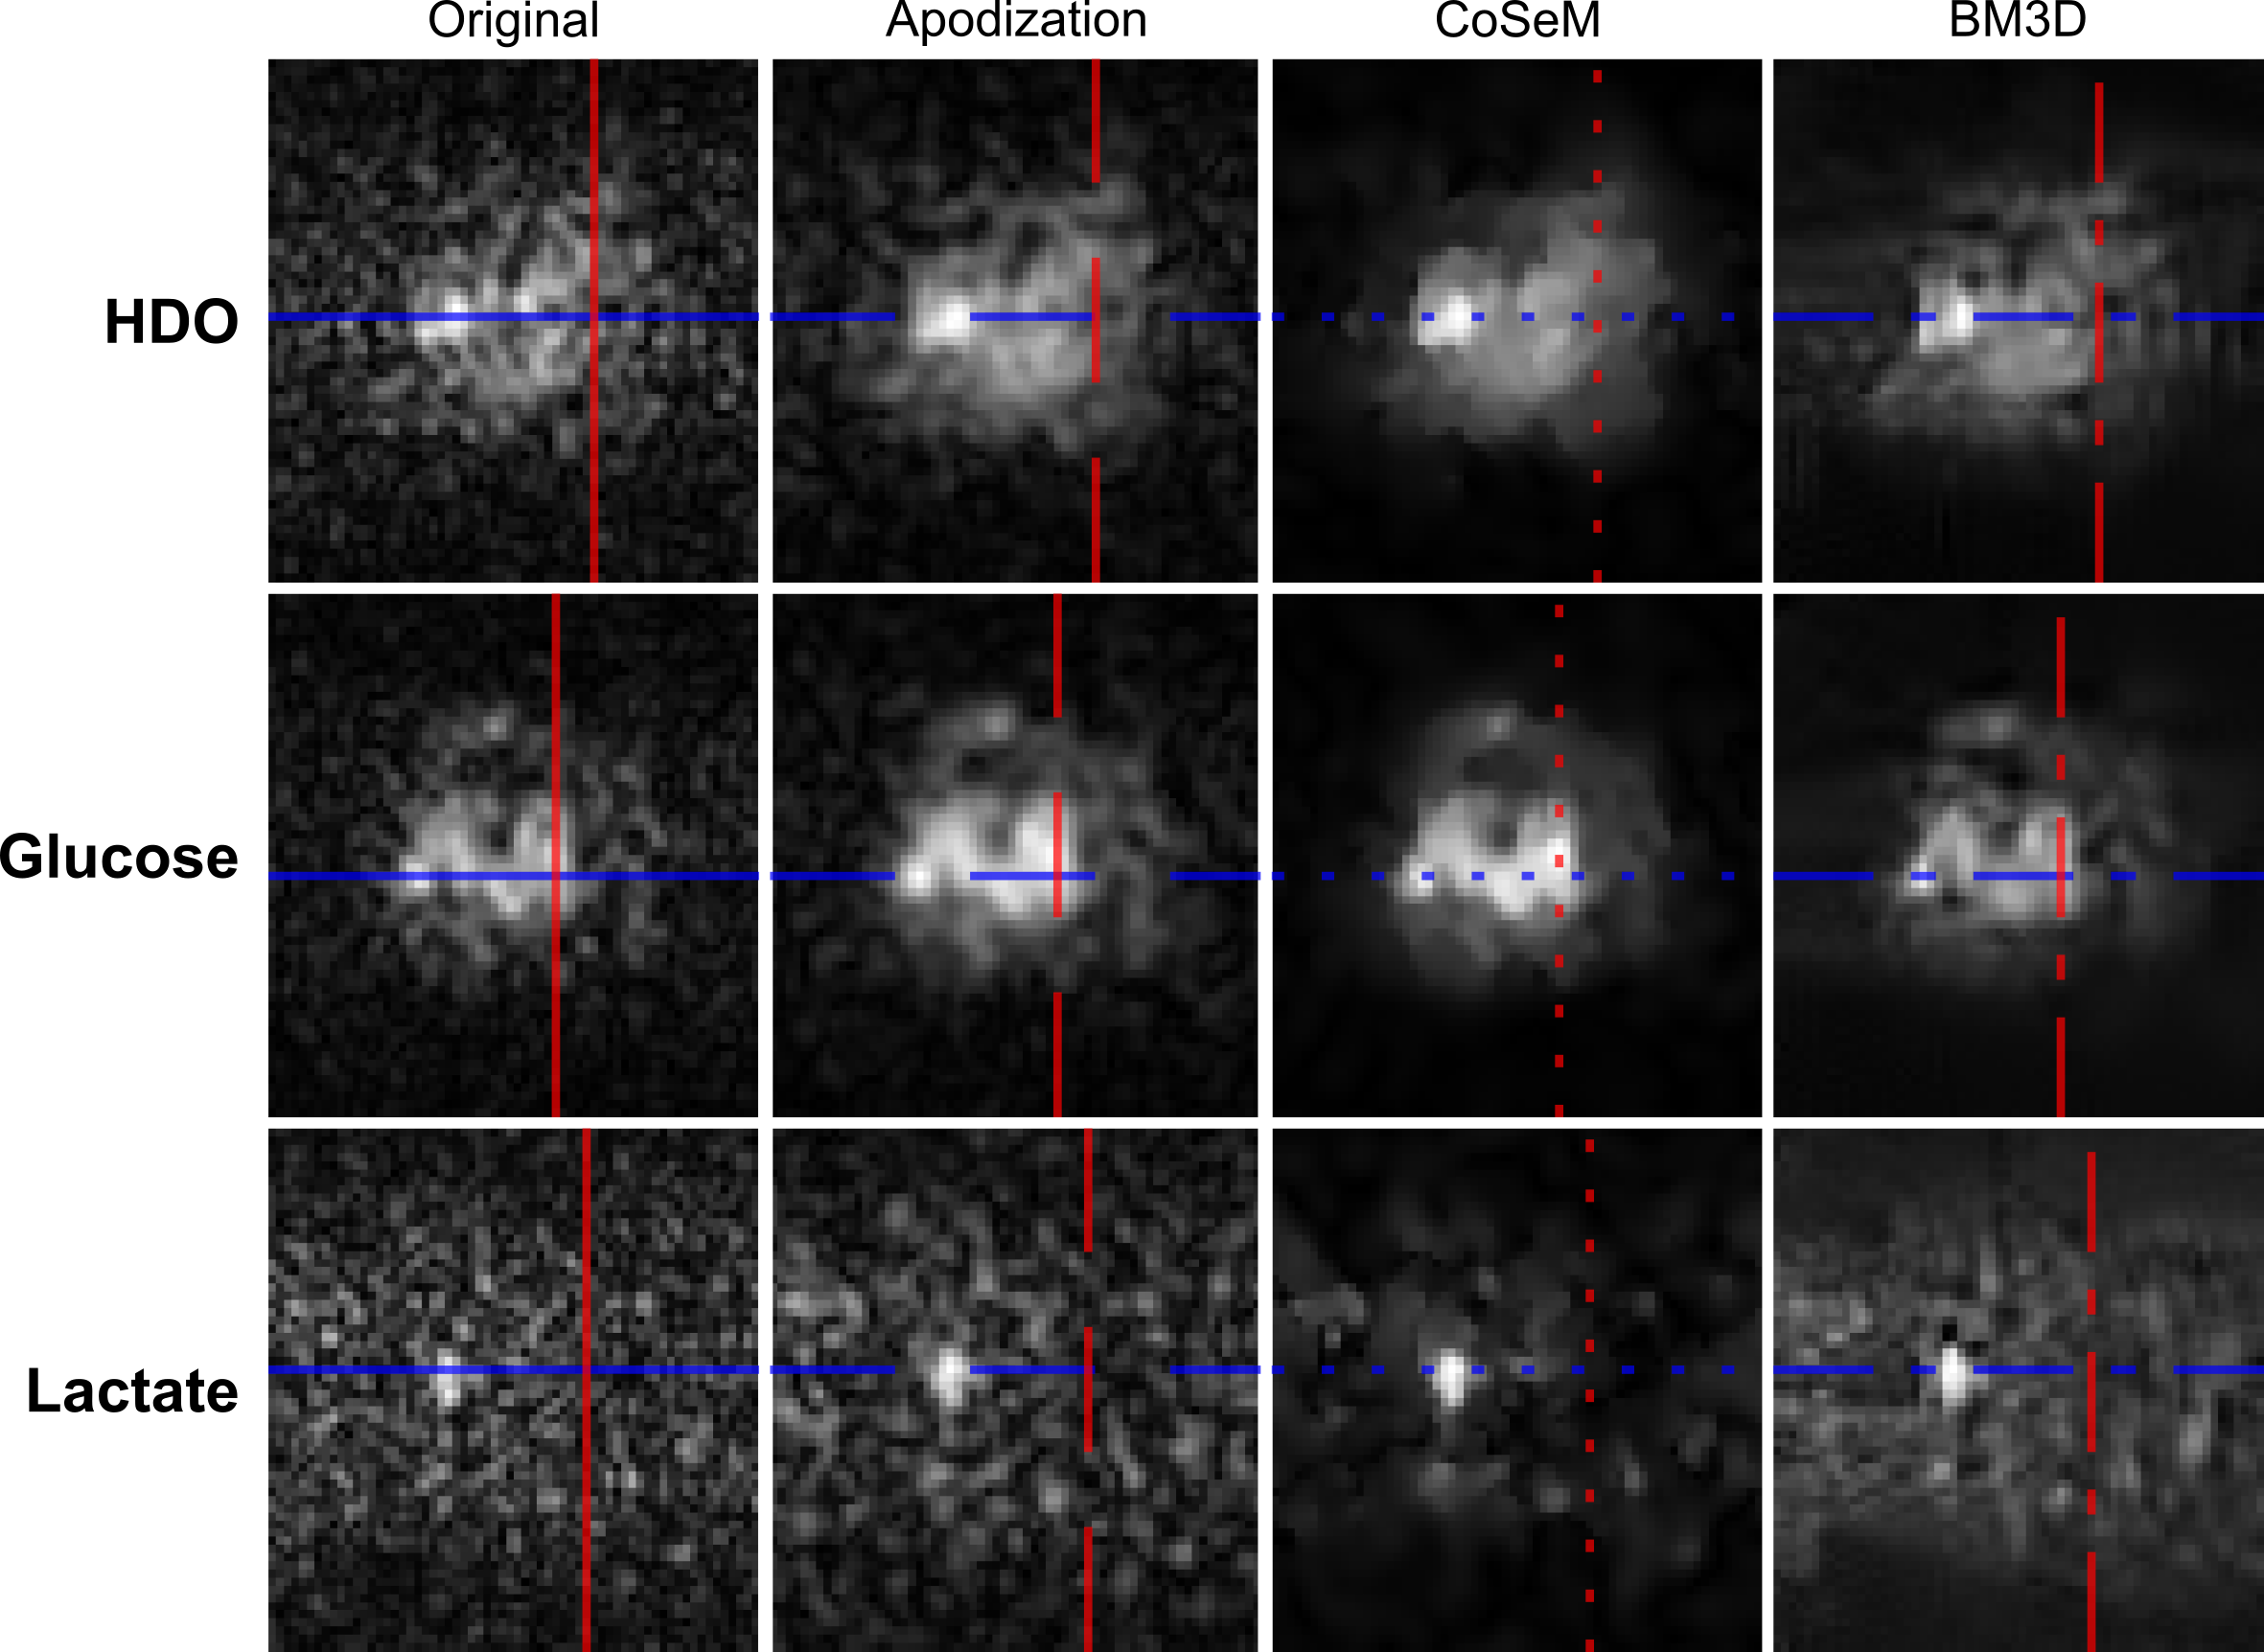
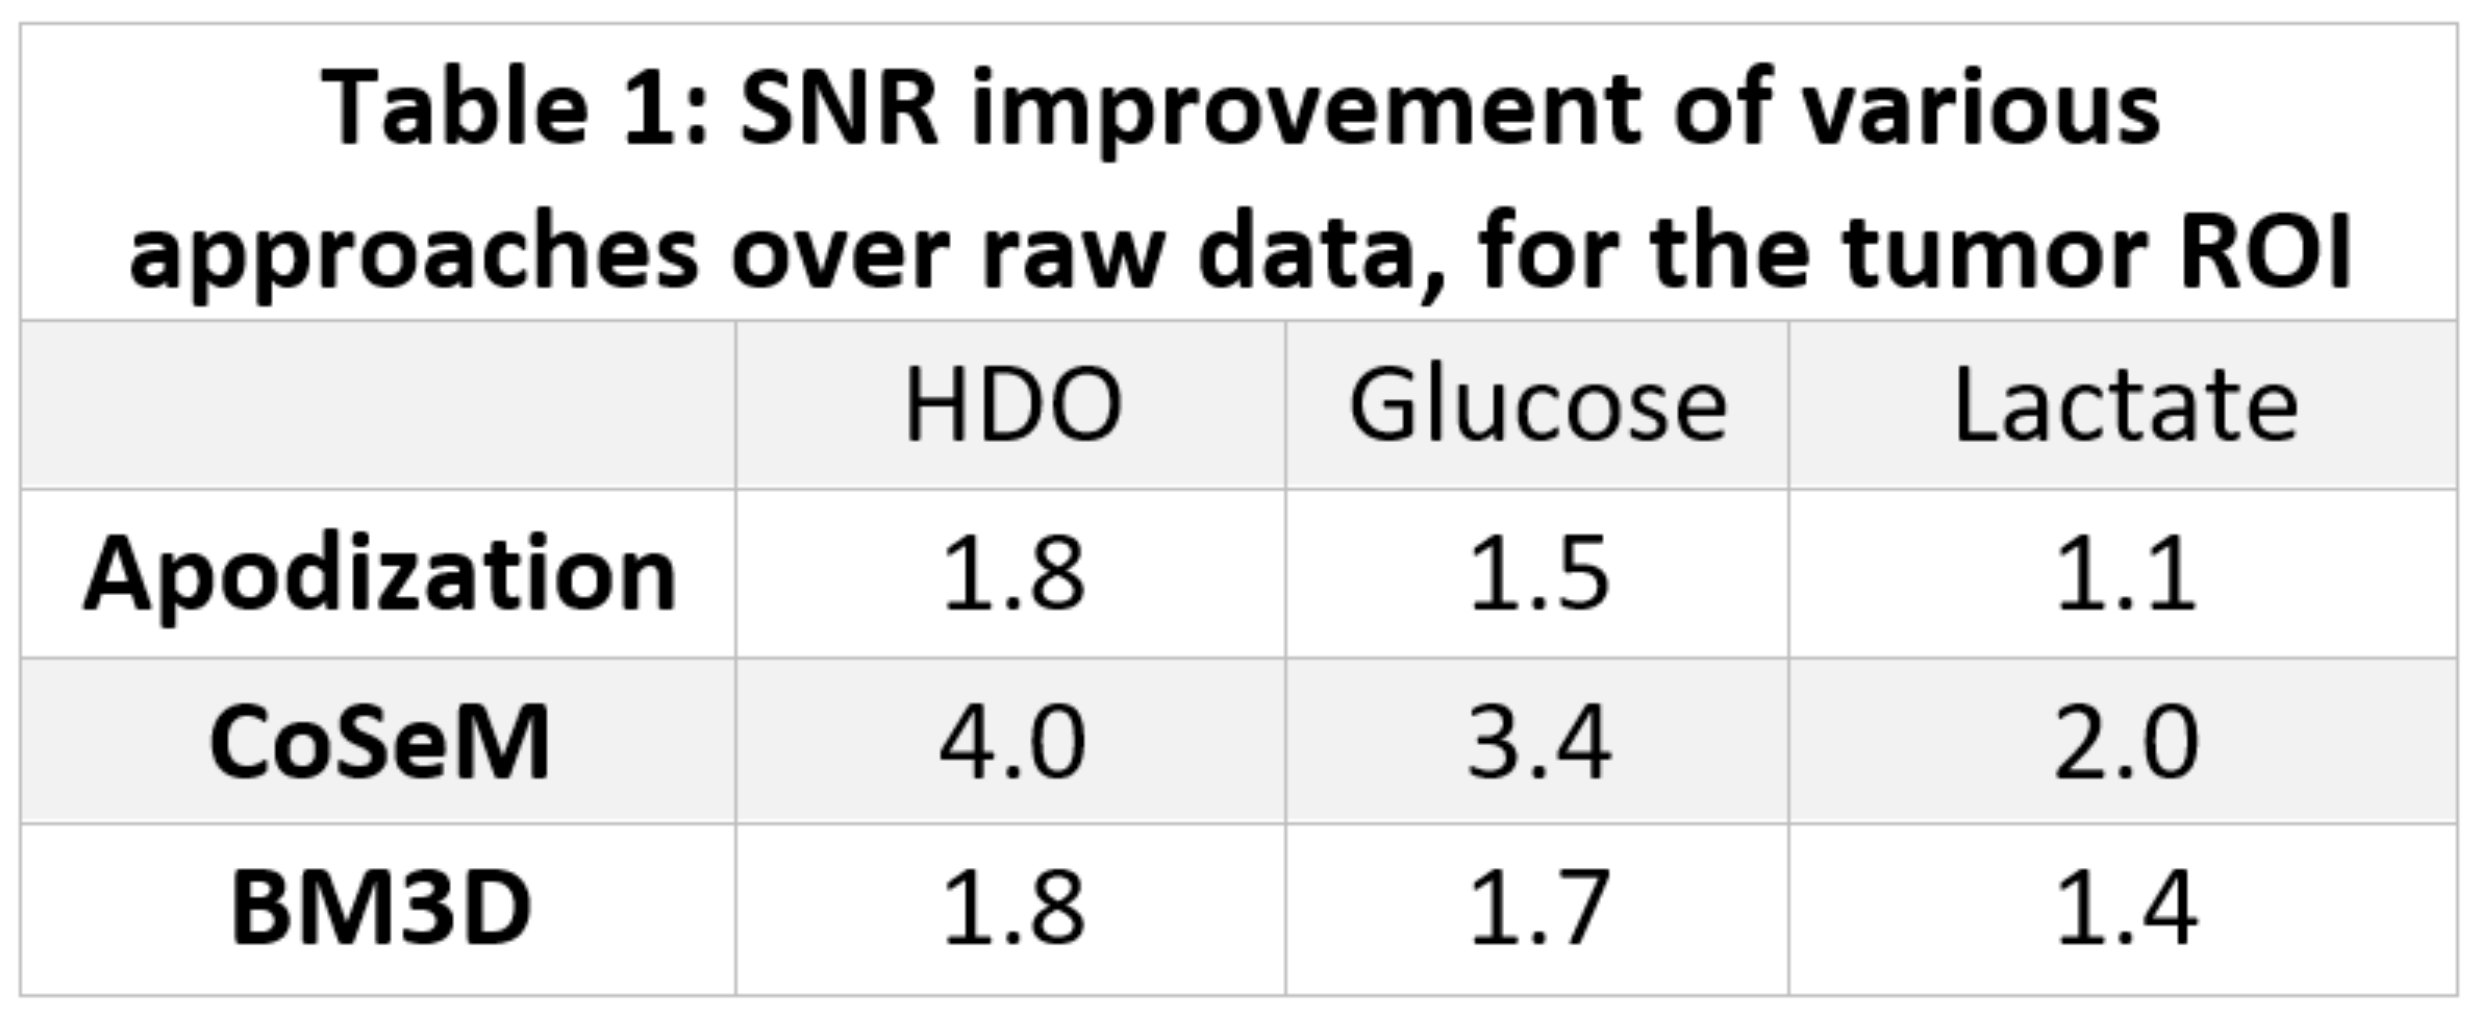
Figure 1 shows a 1H image acquired prior to DMI, on a PDAC-implanted mouse. Also shown are DMI images arising ≈1 hour after [6,6’-2H2]-glucose injection, collected using ME-bSSFP and then separated for HDO, glucose and lactate. At this time the lactate is maximal and, although glucose has largely washed out from the kidney, it is still present in this organ as well as in the tumor region. Lactate is only present in the tumor, while HDO is relatively diffuse throughout the body –even if it is visible with major intensity in the tumor position.Figure 2 compares the DMI images of Figure 1, with denoised versions. All methods improve the SNR; for a ROI containing the tumor, these SNR increases in the 2H images are as per Table 1. Still, blurring effects brought about by the sensitivity enhancement are also noticeable.
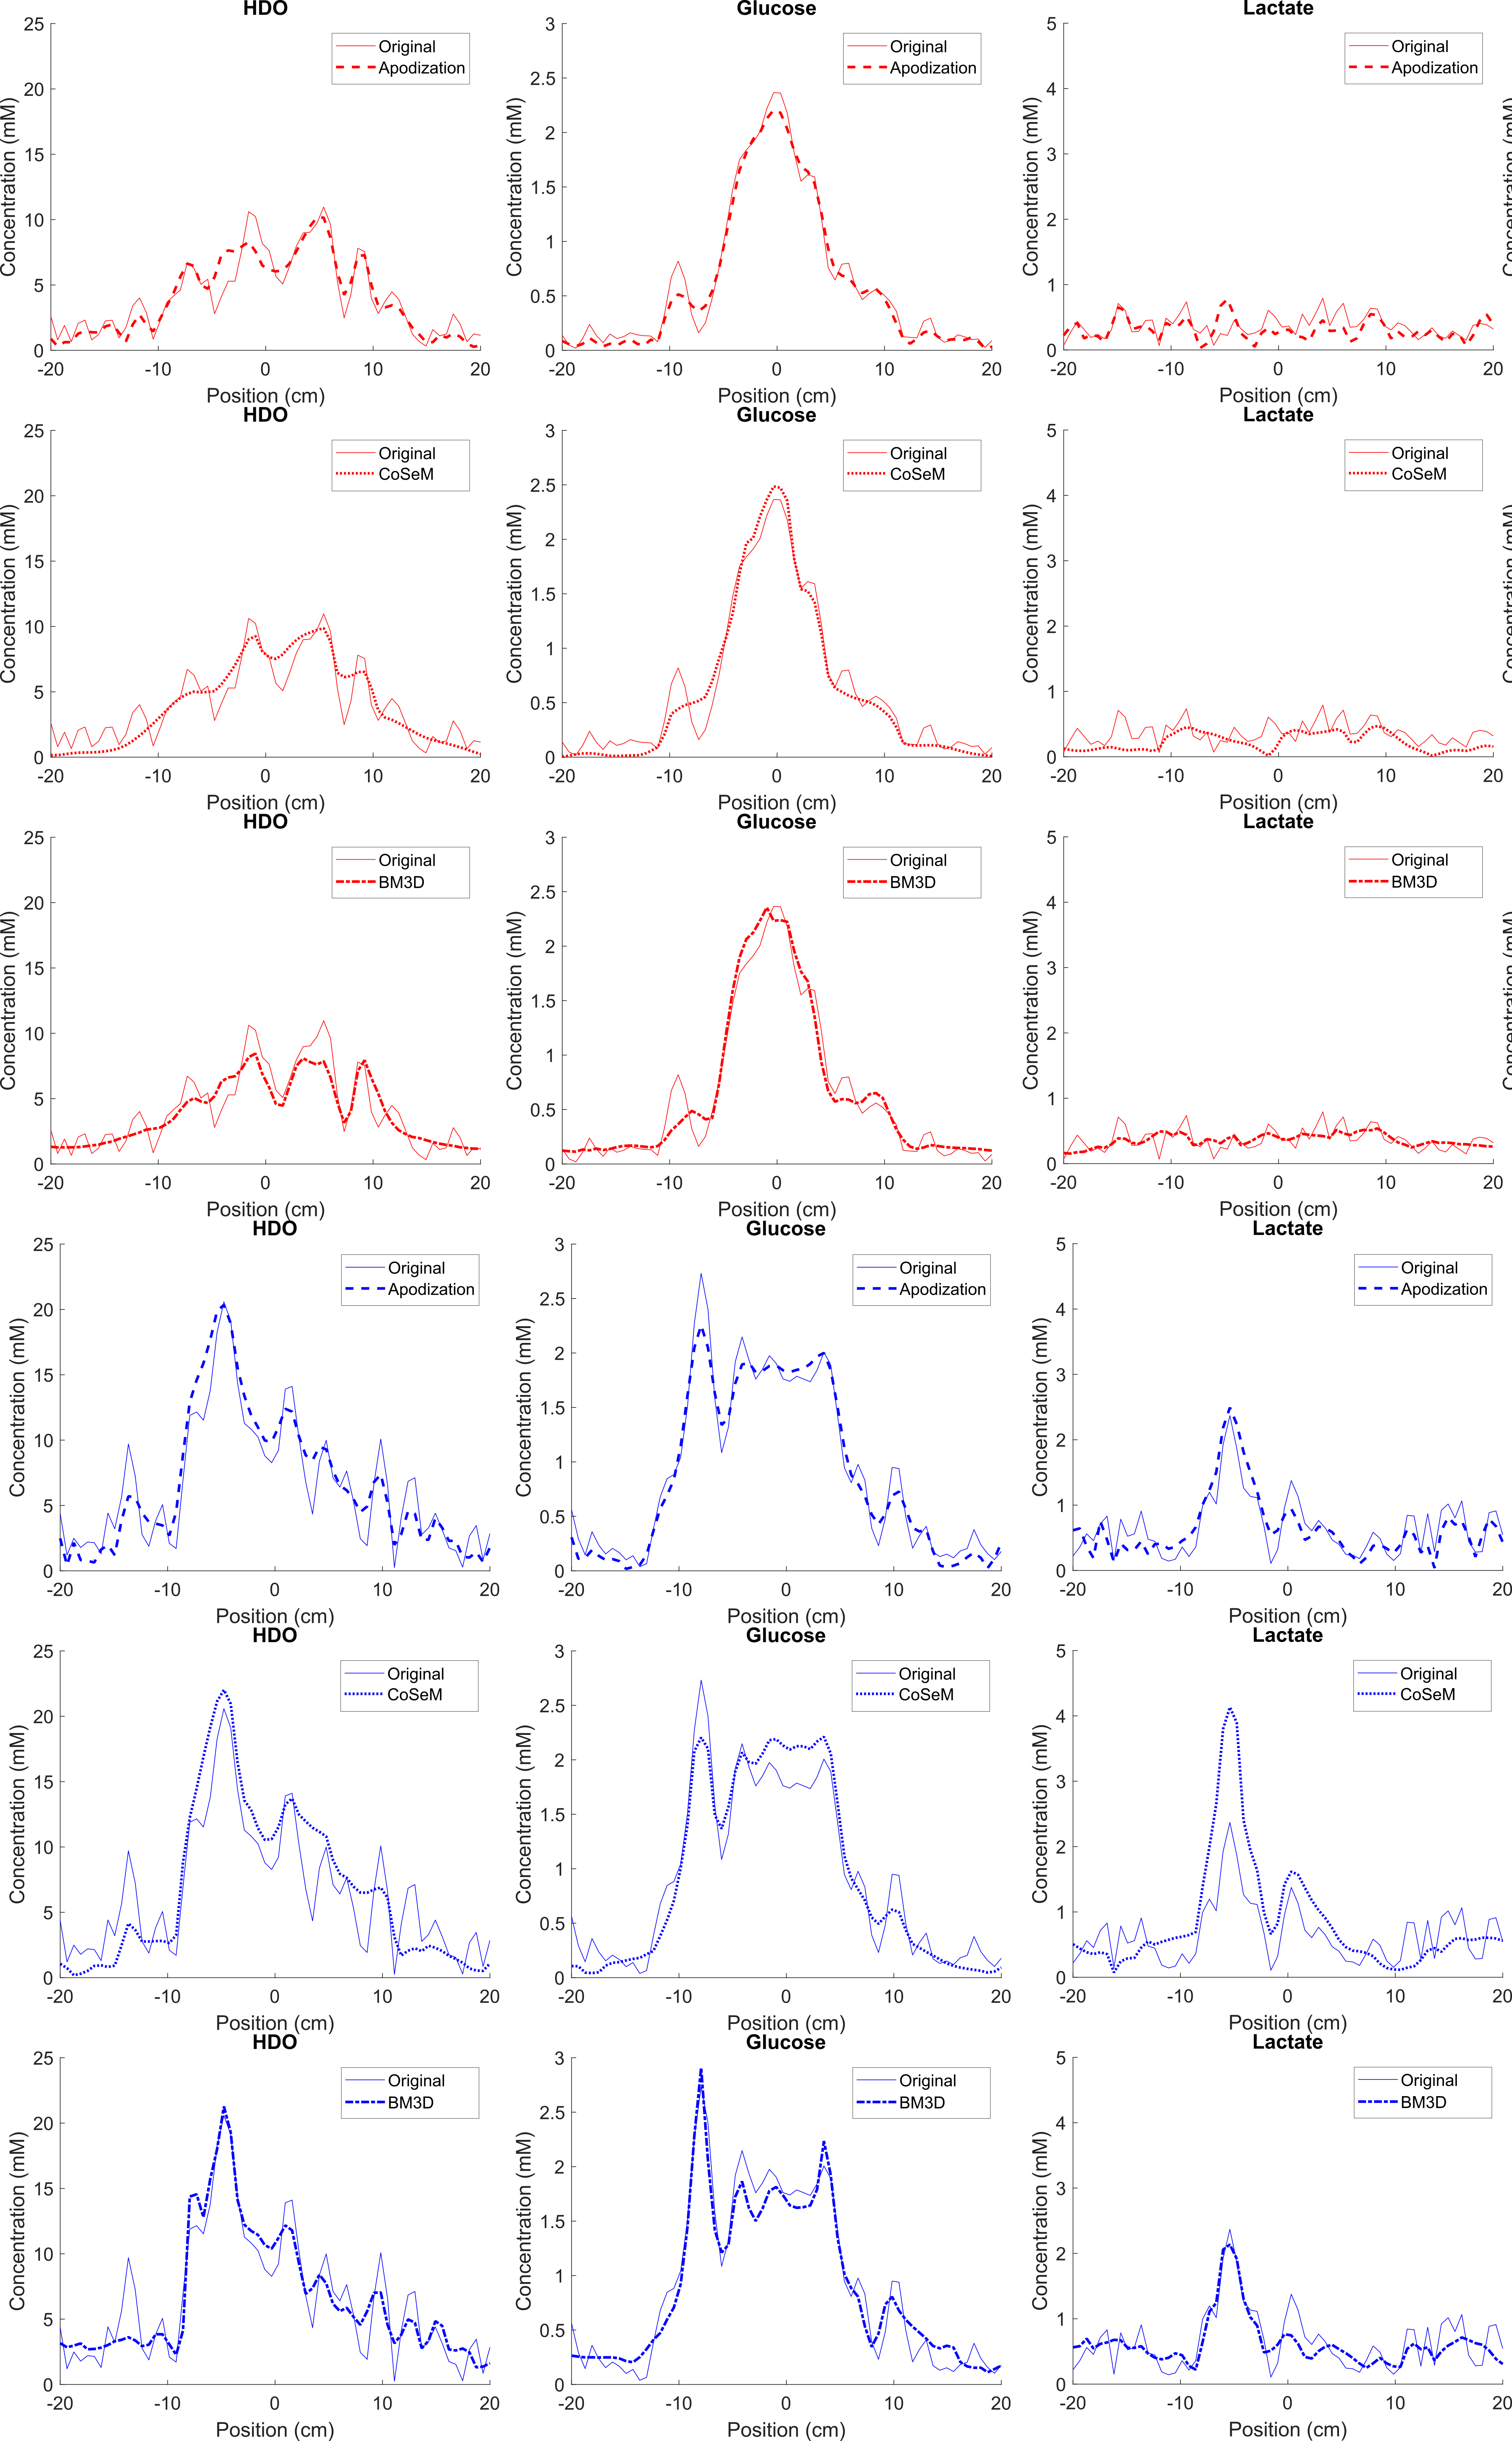
The changes in SNR and resolution are more clearly highlighted in Figure 3, which plots the transverse and longitudinal cross sections shown by colored lines in Figure 2. From these traces one can appreciate how all denoising methods smooth out obvious noise features; apodization, however, clearly smooths out fine image structures as well –foremost among them details of glucose’s tumor rim uptake. No significant differences can be appreciated between the resolutions and sensitivities of BM3D and CoSeM.
Conclusion
DMI denoising methods were tested on a KPC model of PDAC. All increased SNR, but only CoSeM and BM3D did so without excessive smearing. Chances are that when SNR is at premium, e.g. lactate’s detection, this blurring is not important; but it may be so if trying to define subtler features and physiologically meaningful heterogeneities.Acknowledgements
This work was supported by the Thompson Family, the Minerva and the Israel Cancer Research Foundations. LF heads the Clore Institute for High-Field Magnetic Resonance Imaging and Spectroscopy, whose support is also acknowledged.References
1. Lu M, Zhu XH, Zhang Y, Mateescu G, Chen W. Quantitative assessment of brain glucose metabolic rates using in vivo deuterium magnetic resonance spectroscopy. J Cereb Blood Flow Metab. 2017 Nov;37(11):3518-3530. doi: 10.1177/0271678X17706444. Epub 2017 May 15. PMID: 28503999; PMCID: PMC5669347.
2. De Feyter HM, Behar KL, Corbin ZA, Fulbright RK, Brown PB, McIntyre S, Nixon TW, Rothman DL, de Graaf RA. Deuterium metabolic imaging (DMI) for MRI-based 3D mapping of metabolism in vivo. Sci Adv. 2018 Aug 22;4(8):eaat7314. doi: 10.1126/sciadv.aat7314. PMID: 30140744; PMCID: PMC6105304.
3. Markovic S, Roussel T, Agemy L, Sasson K, Preise D, Scherz A, Frydman L. Deuterium MRSI characterizations of glucose metabolism in orthotopic pancreatic cancer mouse models. NMR Biomed. 2021 Sep;34(9):e4569. doi: 10.1002/nbm.4569. Epub 2021 Jun 16. PMID: 34137085.
4. Peters, DC, Markovic, S, Bao, Q, et al. Improving deuterium metabolic imaging (DMI) signal-to-noise ratio by spectroscopic multi-echo bSSFP: A pancreatic cancer investigation. Magn Reson Med. 2021; 86: 2604– 2617. https://doi.org/10.1002/mrm.28906
5. Li Y, Zhao Y, Guo R, Wang T, Zhang Y, Chrostek M, Low WC, Zhu XH, Liang ZP, Chen W. Machine Learning-Enabled High-Resolution Dynamic Deuterium MR Spectroscopic Imaging. IEEE Trans Med Imaging. 2021 Jul 28;PP. doi: 10.1109/TMI.2021.3101149. Epub ahead of print. PMID: 34319872.
6. Y. Mäkinen, L. Azzari and A. Foi, "Collaborative Filtering of Correlated Noise: Exact Transform-Domain Variance for Improved Shrinkage and Patch Matching," in IEEE Transactions on Image Processing, vol. 29, pp. 8339-8354, 2020, doi: 10.1109/TIP.2020.3014721.
7. Martinho RP, Koprivica D, Novakovic M, Jaroszewicz MJ, Frydman L. A multiplicative denoising method based on compressed sensing for magnetic resonance spectroscopy and imaging, submitted, ISMRM 2022.
8. Martinho RP, Bao Q, Markovic S, Preise D, Sasson K, Agemy L, Scherz A, Frydman L. Identification of variable stages in murine pancreatic tumors by a multiparametric approach employing hyperpolarized 13 C MRSI, 1 H diffusivity and 1 H T1 MRI. NMR Biomed. 2021 Feb;34(2):e4446. doi: 10.1002/nbm.4446. Epub 2020 Nov 21. PMID: 33219722.
9. Reeder SB, Pineda AR, Wen Z, Shimakawa A, Yu H, Brittain JH, Gold GE, Beaulieu CH, Pelc NJ. Iterative decomposition of water and fat with echo asymmetry and least-squares estimation (IDEAL): application with fast spin-echo imaging. Magn Reson Med. 2005 Sep;54(3):636-44. doi: 10.1002/mrm.20624. PMID: 16092103.
10. Yu H, Reeder SB, Shimakawa A, Brittain JH, Pelc NJ. Field map estimation with a region growing scheme for iterative 3-point water-fat decomposition. Magn Reson Med. 2005 Oct;54(4):1032-9. doi: 10.1002/mrm.20654. PMID: 16142718.
Figures